Discussion of "Matrix Completion When Missing Is Not at Random and Its Applications in Causal Panel Data Models"
Choi and Yuan (2025) propose a novel approach to applying matrix completion to the problem of estimating causal effects in panel data. The key insight is that even in the presence of structured patterns of missing data -- i.e. selection into treatmen…
Authors: Eli Ben-Michael, Avi Feller
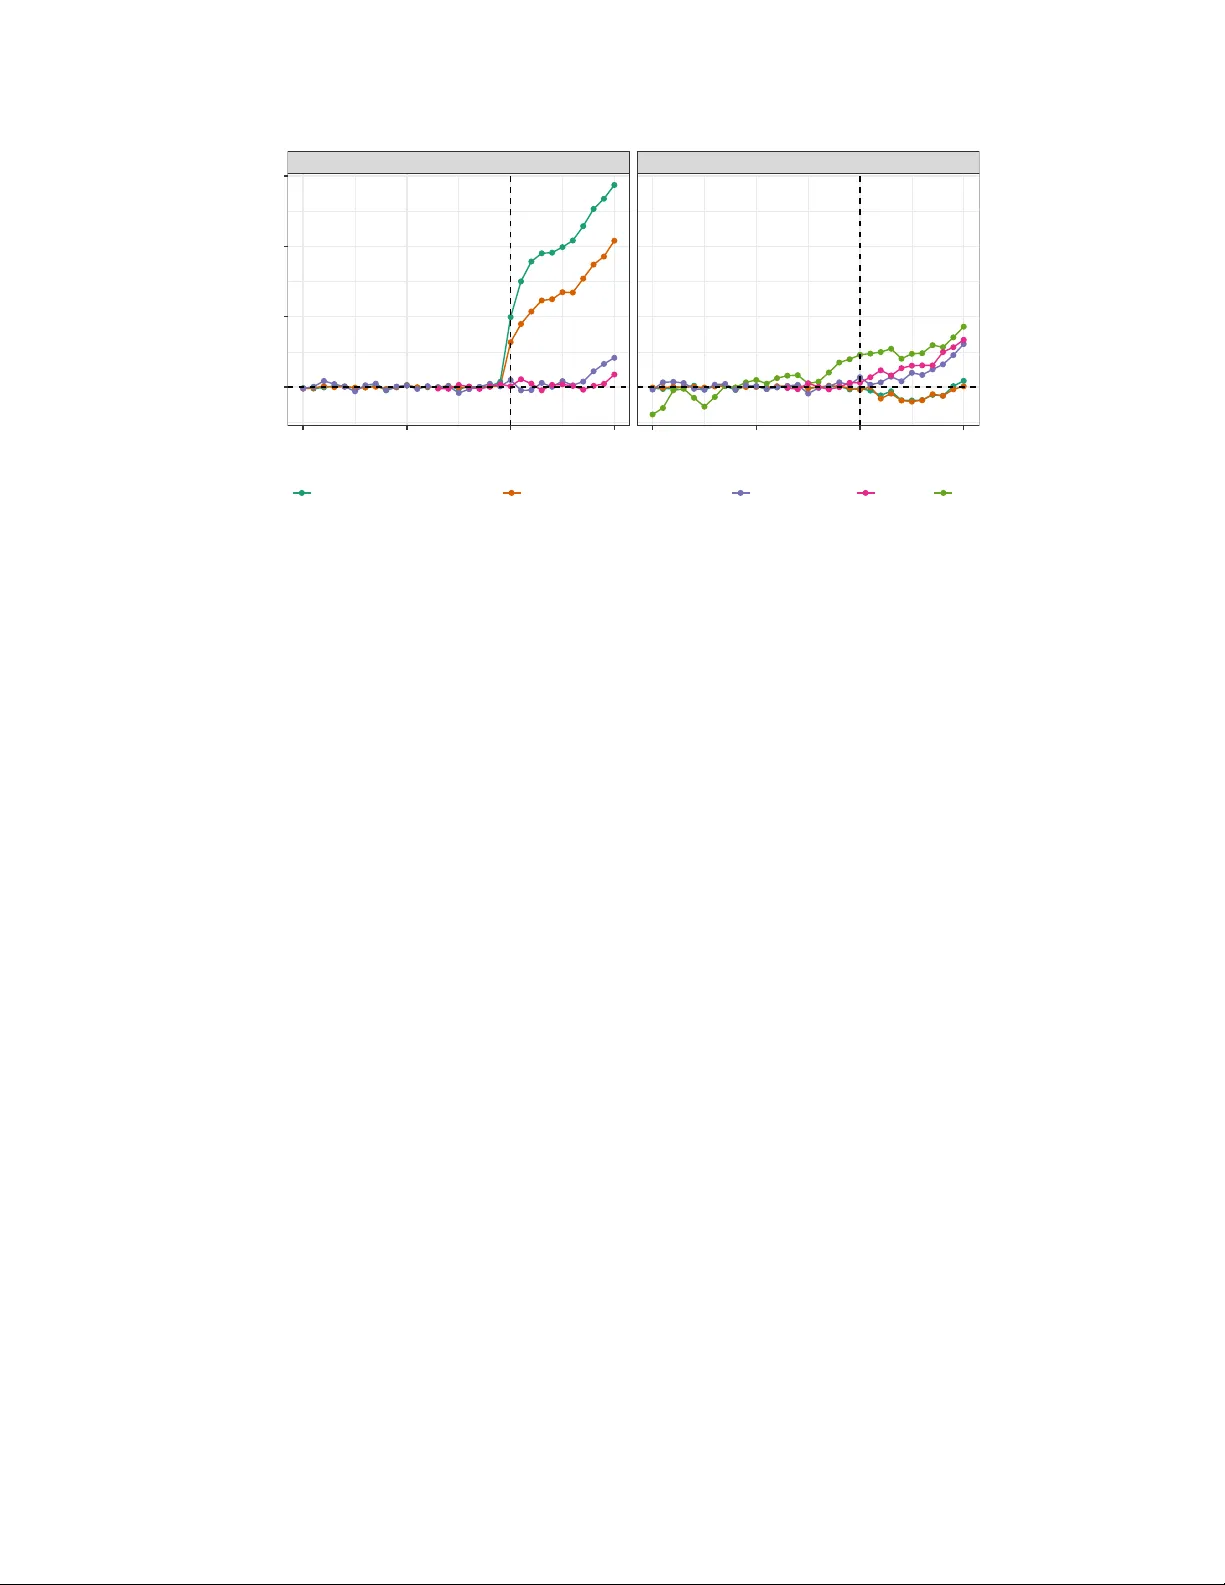
Discussion of “Matrix Completion When Missing Is Not at Random and Its Applications in Causal P anel Data Mo dels” Eli Ben-Mic hael ∗ Avi F eller † 1 In tro duction Choi and Y uan (2025) (hereafter CY) prop ose a no vel approac h to applying matrix comple- tion to the problem of estimating causal effects in panel data. The k ey insight is that ev en in the presence of structured patterns of missing data—i.e. selection in to treatmen t—matrix completion can b e effective if the n um b er of treated observ ations is small relative to the n umber of control observ ations. W e applaud the authors for their insightful and in teresting pap er. Belo w, w e situate their prop osal as an example of a “split-apply-com bine” strategy for panel data estimators (Section 2 ). W e then discuss the issue of the statistical “last mile problem”—the gap b et ween theory and practice—and offer suggestions on how to partially address it (Section 3 ). W e conclude by considering the challenges of estimating the impacts of public p olicies using panel data and apply the approach to a study on the effect of right to carry la ws on violen t crime (Section 4 ). T o do so, w e extend CY’s setup using the fol- lo wing notation. Let G i ∈ { 1 , . . . , T , ∞} indicate the treatment time for unit i = 1 , . . . , N , D it = 1 { t ≥ G i } b e the treatment indicator for unit i at time t = 1 , . . . , T , and Y it ( g ) denote the p oten tial outcome for unit i at time t if it w ere to b e treated in p erio d g . Under the assumptions of no anticipation and no interference, the observed outcome Y it is related to the p otential outcomes as Y it = Y it ( ∞ )(1 − D it ) + Y it ( G i ) D it ( A they and Imbens , 2022 ). ∗ Assistan t Professor, Department of Statistics & Data Science and Heinz College of Information Systems & Public P olicy , Carnegie Mellon Universit y † Asso ciate Professor, Goldman Sc ho ol of Public Policy & Department of Statistics, Universit y of Califor- nia, Berk eley 1 Apply ˆ τ 2x2 DiD Split T reatment-time cohorts Com bine Even t time (a) Difference in differences. Apply ˆ τ Matrix completion Split Unit-time pairs Com bine Calendar time (b) Matrix completion in CY. Figure 1: Split-apply-combine strategies for panel data estimators. 2 The split-apply-com bine strategy CY’s prop osal uses a“split-apply-com bine” strategy that “break[s] up a big problem into manageable pieces, op erate[s] on each piece indep endently and then put[s] all the pieces bac k together” ( Wickham , 2011 ). This framew ork is the backbone of many mo dern panel data estimators, including difference in differences and synthetic control approac hes. 2.1 Split-apply-com bine panel data estimators The split-apply-combine framew ork has b een successful in transforming the w ay practitioners estimate causal effects with difference in differences (DiD) under staggered adoption. Prior to recen t metho dological adv ances, common practice was to estimate a single t w o-wa y fixed effects (TWFE) regression model on the en tire panel dataset: Y it = α i + η t + τ D it + ε it , where α i and η t are unit and time fixed effects, resp ectiv ely , and ε it is a mean-zero error term. As CY note, this model estimates a single treatmen t effect τ and do es not allo w for treatmen t effect heterogeneity . In the tw o-p erio d, tw o-group case where no units are treated in the first p erio d and some—but not all—units are treated in the second p erio d, τ is the a v erage treatmen t effect on the treated in the second p erio d. Ho w ev er, this do es not necessarily hold in general: if there exist heterogeneous treatment effects b y units and time, then τ may not ev en estimate a coheren t av erage of effects ( Goo dman-Bacon , 2021 ; Borusy ak et al. , 2024 ). Mo dern approaches to DiD address this challenge using the split-apply-combine strategy ( Sun and Abraham , 2021 ; Calla wa y and San t’Anna , 2021 ). The idea is to (i) split the panel in to the p ossible t w o-p erio d, t wo-group cases; (ii) estimate the effect τ from the TWFE mo del for eac h case; and (iii) combine estimates from the different cases to obtain a final estimate (see Figure 1a ). This split-apply-com bine strategy av oids so-called “forbidden com- parisons” b etw een already treated units and estimates a coherent com bination of treatmen t 2 effects. Suc h split-apply-combine strategies are also found in synthetic con trol approaches with m ultiple treated units: (i) splitting into treated units or treatmen t-time cohorts; (ii) fitting a synthetic control for eac h treated unit or the av erage of the treatment-time co- hort; and (iii) a v eraging the synthetic con trol estimates (see, e.g. Abadie and L’Hour , 2021 ; Ben-Mic hael et al. , 2022 ). CY thoughtfully emplo y the split-apply-combine strategy to matrix completion estima- tors. The split step first selects a focal time p erio d and a set of units with the same treatmen t time b efore the fo cal perio d. It then subsets the matrix in to the selected set of treated units and the full set of not-y et-treated units for the pre-treatment time p erio ds and the fo cal time p erio d. The apply step imputes the missing counterfactuals via nuclear-norm regu- larized matrix completion. Finally , the c ombine step av erages the difference b et w een the observ ed outcomes and the imputed coun terfactual across treated units (see Figure 1b ). 2.2 Com bining b efore applying: lessons from w eigh ting estimators CY consider tw o estimands: (i) the individual treatment effect (ITE) τ it ≡ Y it ( G i ) − Y it ( ∞ ) for each treated unit, and (ii) the av erage treatmen t effect on the treated (A TT) at time t 0 : τ cal t 0 ≡ 1 N t 0 P i : D it 0 =1 τ it 0 , where N t 0 is the num b er of treated units at time t 0 , and where “cal” denotes calendar time (w e return to this b elo w). While CY provide high probabilit y b ounds on the the imputation error for the structural comp onen t of the ITE, w e cannot ha ve useful b ounds for the estimation error of the ITE itself b ecause of the idiosyncratic error term. This is the fund amental pr oblem of c ausal infer enc e : it is not generally p ossible to fully impute individual-lev el coun terfactuals. This identifiabilit y issue mak es the A TT an attractive alternativ e when there are m ul- tiple treated units. In this case it is often useful to com bine b efor e applying the impu- tation/treatmen t effect estimation step. F or instance, this is common with matc hing and w eighting estimators in cross-sectional observ ational studies. Here the split-apply-c ombine strategy is to: (i) split the data b y eac h treated unit, (ii) find a set of matc hed or re-w eigh ted con trol units with a similar co v ariate profile to the treated unit and impute the coun terfac- tual, and (iii) av erage the differences betw een the observed and imputed outcomes. If the exp ected p otential outcome conditional on the co v ariates has some amoun t of smo othness, this approach will b e inefficient compared to the c ombine-apply strategy: (i) a verage the treated units together and (ii) find a set of matched or re-weigh ted con trol units that has a similar co v ariate profile to the a v erage treated unit, then estimate the difference in matc hed or re-weigh ted means. Such “fine balance” ( Zubizarreta et al. , 2011 ) approac hes ha v e larger effectiv e sample sizes. Similar combine-apply strategies are also useful 3 in syn thetic control settings (see, e.g. Kreif et al. , 2016 ; Robbins et al. , 2017 ; Ben-Michael et al. , 2022 ). F or the matrix completion estimator that CY prop ose, such a com bine-apply strategy may also be effectiv e when targeting the A TT. 3 The statistical last mile problem The “last mile problem” refers to the challenges and costs asso ciated with the final step of delivering go o ds or services, such as moving a pack age from a distribution center to its final destination. Statistical metho dology suffers from suc h a last mile problem: we often dev elop estimators with go o d theoretical guaran tees under ideal settings, but face hurdles in deplo ying these to ols in practice. Overcoming this last mile problem remains a central c hallenge for our field and, w e b eliev e, is an imp ortant complement to cutting-edge core metho dological developmen t, like CY. In that spirit, w e offer some p ossible directions for o vercoming the last mile problem in deplo ying CY’s prop osal. Com bining effects by calendar time vs ev ent time. CY target a c alendar time a verage treatmen t effect, τ cal t 0 , that a verages across all treated units at a given calendar time t 0 . The calendar time av erage is difficult to in terpret when there are treatment effect dynamics: it aggregates effects for units at differen t p oin ts in the treatmen t pro cess, a v eraging together units that only just receiv ed treatmen t and that hav e receiv ed treatmen t for many p erio ds. Muc h applied w ork instead fo cuses on the event time av erage, which av erages treatment effects across all treated units at a giv en ev ent time G i + k : τ even t k ≡ 1 N k P i : G i < ∞ τ i,k + G i , where N k is the num b er of treated units that hav e observ ed outcomes k p erio ds after treatmen t (i.e. G i + k ≤ T ); see, for example, Roth et al. ( 2023 ). Measuring effects according to ev ent time is often more interpretable: it a verages together units that ha ve b een treated for the same amount of time. Despite this app eal, estimating effects b y ev ent time in low-rank matrix or factor mo del settings inv olv es aggregating across differen t calendar times — and therefore a veraging across different righ t singular v alues/factors. As a result, the argumen t for asymptotic normalit y and the form of the asymptotic v ariance ma y v ary from the calendar time estimand in CY. Heterosk edastic-robust inference. Ensuring that inference is robust to heterosk edastic- it y is often a minimum requirement for uncertain ty quantification in the so cial sciences, where w e exp ect individuals or regions to b e idiosyncratic. W e commend CY for extending their asymptotic results to heterosk edastic errors in the blo c k missingness case in the supplemen- tary materials, whic h go es a long wa y to solving this last mile problem. A heteroskedastic- robust v ariance estimator in the staggered adoption case likely extends from these results 4 and would b e of great use to practitioners. Hyp er-parameter selection. CY’s prop osal requires c ho osing a tuning parameter that con trols the level of regularization. Hyp er-parameter selection in panel data with structured patterns of missing data is a difficult problem, and v arious forms of cross-v alidation strategies ha ve b een prop osed. F or example A they et al. ( 2021 ) prop ose a cross-v alidation strategy that randomly selects subsets of the observed data so that the observ ed fraction is the same as the fraction of missing data in the full matrix. A challenge is that this form of subsampling does not resp ect the structure of the missing data, and the a verage p erformance of the imputations ma y not b e representativ e of the performance on the full matrix. F or syn thetic controls with blo c k adoption, Abadie and L’Hour ( 2021 ) and Ben-Michael et al. ( 2021 ) prop ose a cross- v alidation scheme that holds out pre-treatmen t p erio ds and ev aluates the p erformance of the imputation for treated units in the held-out p erio ds, though this may not extend to other missing data patterns. A simple, effectiv e, and p erformant approach to hyper-parameter selection would help address this last mile problem. Diagnostics. Another k ey last mile c hallenge is the construction of diagnostic measures to assess the credibilit y of results. F or panel data analyses a common diagnostic is the “ev ent study plot” that plots estimated even t-time effects for eac h ev ent time k . F or negativ e ev ent times k < 0, ˆ τ even t k serv es as a placeb o c hec k. Under the parallel trends assumption, ˆ τ even t k should b e close to zero prior to treatment, and substan tial deviations from zero serv e as evidence against this assumption. Similar diagnostics are used in syn thetic con trol analyses, where it is common to sho w b oth the ev ent study plot and a “gap plot” that includes estimates of the individual treatmen t effects τ i ( G i + k ) with k < 0 ( Abadie et al. , 2010 ). W e illustrate this diagnostic for CY’s prop osal b elow. While a useful first step, we also note that this diagnostic is likely insufficien t: for matrix completion estimators, placeb o estimates of ˆ τ i ( G i + k ) near zero ma y reflect ov er-fitting. One common and applicable alternativ e diagnostic is the “in-time-placebo” chec k ( Abadie et al. , 2015 ). This is an out-of-sample fit diagnostic that creates placeb o treatmen t times ˜ G i = G i − ℓ for some ℓ > 0 and estimates the treatment effects ˆ τ i ( ˜ G i + k ) for each unit i at even t time k < ℓ . Non-zero in-time-placeb o estimates are an indication that some key assumption is violated. Suc h diagnostics w ould b e appropriate for CY’s prop osal; lik ely there are other useful p otential diagnostics as well. 4 Ev aluating public p olicy with panel data W e conclude by discussing ev aluating public p olicies using panel data metho ds. 5 4.1 Challenges in ev aluating p olicy c hange with panel data A k ey feature of public p olicy ev aluations is that p olicy changes often o ccur at at the ju- risdictional lev el, e.g. at the state- or municipalit y-lev el. State-lev el p olicy ev aluations are esp ecially common b ecause standardized, aggregated data at the state lev el is often a v ail- able via federal agencies, at least for the past several decades, while cov erage can b e p o or for more fine-grained data. Therefore, a t ypical state-level p olicy ev aluation has a limited n umber of units ( N ≈ 50 states) and time p erio ds ( T ≈ 50 years), limiting the applicability of asymptotic theory that rely on gro wing N and T . This can b e particularly challenging b ecause the underlying data is often ill-conditioned: simple structures such as tw o-wa y fixed effects or one or t wo laten t factors can explain a high degree of the v ariation in the data, but there is often a long tail of laten t factors that accoun t for a small but non-negligible amoun t of v ariation. F or example, in the application we discuss b elow, the condition num b er of the estimated matrix is b etw een 100-10,000, dep ending on the lev el of regularization. Other difficulties emerge. There is often wide v ariation in the timing of p olicy c hanges across states. Early adopters serv e as mo dels for later adopters, and sometimes decades can pass b etw een the first and last states adopting a p olicy . Th us, early adopters may hav e relativ ely few pre-treatmen t p erio ds, and the range in the n umber of pre-treatmen t p erio ds across states can b e large. W e also usually exp ect there to b e treatment effect dynamics: p olicy effects ma y phase in o v er time as a policy is more fully rolled out, or they ma y app ear instan tly and then phase out as individuals c hange their b ehavior in resp onse to the p olicy . Finally , there is often a high degree of heteroskedasticit y , as individual contexts v ary widely across jurisdictions. 4.2 A protot ypical p olicy ev aluation example As an example p olicy ev aluation problem, we consider the effect of “right to carry” (R TC) la ws on violent crime. Broadly , R TC la ws allo w individuals to carry concealed firearms in public either without a p ermit or with a p ermit that is easy to obtain. Here we analyze the impact of R TC la ws on violent crime follo wing the data setup in Donoh ue et al. ( 2019 ). The panel measures the violent crime rate for each state in the United States from 1977 to 2014. 1 Figure 2 sho ws the timing of enacting R TC laws across the 44 states that had at least 8 y ears of pre-treatmen t observ ations (the remaining 6 states had enacted an R TC law before 1980). There is a wide v ariation in treatment timing: the final state (IL) enacted an R TC la w 1 The reduced data set used for this analysis is a v ailable at https://ebenmichael.github.io/assets/code/rtc panel.csv . 6 ME ND SD FL GA P A WV ID MS OR MT AK AZ WY AR NC NV UT VA KY LA OK SC TN TX MI CO MN MO NM OH KS NE IA WI IL CA DE HI MA MD NJ NY RI 1980 1990 2000 2010 Figure 2: T reatmen t timing for the R TC data. Blac k indicates that the state had not adopted an R TC la w at that time, while white indicates that it had and so Y it ( ∞ ) is missing. 29 y ears after the first states (ME, ND, SD). W e pro ceed to estimate the even t-time effects of R TC laws, ˆ τ even t k , for k = − 20 , . . . , 10 using (i) n uclear-norm regularized matrix completion on the en tire matrix; (ii) the CY estimator; (iii) partially p o oled synthetic controls ( Ben- Mic hael et al. , 2022 ); and (iv) the Gsyn th estimator ( Xu , 2017 ). F or the matrix completion estimators w e c ho ose hyper-parameters via 5-fold cross v alidation on the observed unit-time pairs. Computational issues w ere not a concern, so w e implemen t CY’s prop osal using the smallest group size p ossible of 1, p er their suggestion. The left panel of Figure 3 sho ws the estimates. First, note that the pre-treatment esti- mates ˆ τ even t k for k < 0 are all close to zero for the matrix completion estimators. How ever, the p ost-treatmen t effect estimates for k ≥ 0 are implausibly large: matrix completion estimates an a verage p ost-treatmen t increase in violen t crime of 205 p er 100,000 p eople in the years follo wing the enactment of an R TC la w. CY’s prop osal gives somewhat low er estimates, with a mean p ost-treatmen t increase of 136 violent crimes p er 100,000. Again, these are implausibly large: comparing to features of the ra w data, the a verage difference betw een the highest and lowest violent crime rates within each state during the 37 y ear panel p erio d is 342 p er 100,000. Comparing to alternative estimators, we see that the matrix completion approac hes estimate effects an order of magnitude larger than the alternatives (syn thetic con trol a v erage: 11.3 p er 100,000; Gsyn th av erage: 3.86 p er 100,000). Finally , w e can also consider using t w o-wa y fixed effects as a pr e-pr o c essing step b y estimating unit and time fixed effects from the observed data matrix and then subtracting them from the observed violen t crime rate b efore using the v arious estimators. Suc h pre- 7 No Fixed Eff ects Fixed Eff ects −20 −10 0 10 −20 −10 0 10 0 100 200 300 Event Time Estimated effect on violent crime per 100,000 Matrix Completion (full matrix) Matrix Completion (one at a time) P. P ooled SCM Gsynth DiD Figure 3: Estimates of the even t-time effects τ even t k for k = − 20 , . . . , 10 using (i) nuclear- norm regularized matrix completion on the entire matrix; (ii) the CY estimator; (iii) partially p o oled syn thetic con trols ( Ben-Michael et al. , 2022 ); (iv) the Gsyn th estimator ( Xu , 2017 ); and (v) a DiD estimator. Estimators (i)-(iv) are estimated without (left panel) and with (righ t panel) residualizing out unit and time fixed effects. pro cessing has pro ven effectiv e in syn thetic control settings b ecause it directly accoun ts for level differences across units and time (e.g. F erman and Pinto , 2021 ); if no additional estimation step is applied, this yields a standard DiD estimator. The right panel of Figure 3 sho ws the corresp onding even t study plot on residualized data, along with an additional DiD estimate. The unadjusted DiD estimate shows clear evidence against parallel trends, with pre-treatmen t placeb o estimates far from zero. Nonetheless, after removing unit and time fixed effects as a pre-pro cessing step, the matrix completion estimates are in m uch greater alignmen t with alternative approac hes. Matrix completion on the full matrix and the CY estimator estimate a mean p ost-treatmen t decrease of 8.5 and 10.1 violen t crimes p er 100,000, resp ectiv ely , compared to an estimated increase of 23 and 32 violent crimes p er 100,000 for the synthetic control and Gsyn th estimators, resp ectively . A b o otstrap-based appro ximate 95% confidence in terv al for the synthetic con trol estimate ranges from -48 to 116, a wide range that includes the matrix completion estimates with fixed effects pre-pro cessing, but not without pre-pro cessing. 8 References Abadie, A., Diamond, A., and Hainm ueller, J. (2010). Synthetic Con trol Metho ds for Com- parativ e Case Studies: Estimating the Effect of California’s T obacco Con trol Program. Jour- nal of the A meric an Statistic al Asso ciation , 105(490):493–505. ISBN: 0162-1459. Abadie, A., Diamond, A., and Hainmueller, J. (2015). Comparativ e P olitics and the Syn- thetic Control Metho d. A meric an Journal of Politic al Scienc e , 59(2):495–510. Abadie, A. and L’Hour, J. (2021). A P enalized Syn thetic Con trol Estimator for Disaggre- gated Data. Journal of the A meric an Statistic al Asso ciation , 116(536):1817–1834. Publisher: T aylor & F rancis. A they , S., Ba y ati, M., Doudchenk o, N., Imbens, G., and Khosravi, K. (2021). Matrix Comple- tion Metho ds for Causal Panel Data Models. Journal of the Americ an Statistic al Asso ciation , 116(536):1716–1730. A they , S. and Im b ens, G. W. (2022). Design-based analysis in Difference-In-Differences settings with staggered adoption. Journal of Ec onometrics , 226(1):62–79. Ben-Mic hael, E., F eller, A., and Rothstein, J. (2021). The Augmen ted Synthetic Con trol Metho d. Journal of the A meric an Statistic al Asso ciation , 116(536):1789–1803. Ben-Mic hael, E., F eller, A., and Rothstein, J. (2022). Synthetic con trols with staggered adop- tion. Journal of the R oyal Statistic al So ciety. Series B: Statistic al Metho dolo gy , 84(2):351– 381. Borusy ak, K., Jarav el, X., and Spiess, J. (2024). Revisiting Ev ent-Study Designs: Robust and Efficient Estimation. The R eview of Ec onomic Studies , 91(6):3253–3285. Calla wa y , B. and Sant’Anna, P . H. (2021). Difference-in-Differences with Multiple Time P erio ds. Journal of Ec onometrics , 225(2):200–230. Donoh ue, J. J., Aneja, A., and W eb er, K. D. (2019). Right-to-carry la ws and violent crime: A comprehensiv e assessmen t using panel data and a state-level synthetic con trol analysis. Journal of Empiric al L e gal Studies , 16(2):198–247. F erman, B. and Pin to, C. (2021). Synthetic controls with imp erfect pretreatmen t fit. Quan- titative Ec onomics , 12(4):1197–1221. Go o dman-Bacon, A. (2021). Difference-in-differences with v ariation in treatmen t timing. Journal of Ec onometrics , 225(2):254–277. Kreif, N., Grieve, R., Sutton, M., and Sekhon, J. (2016). Estimating causal effects: consider- ing three alternatives to difference-in-differences estimation. He alth Servic es and Outc omes R ese ar ch Metho dolo gy , 16:1–21. 9 Robbins, M. W., Saunders, J., and Kilmer, B. (2017). A F ramew ork for Syn thetic Con trol Metho ds With High-Dimensional, Micro-Level Data: Ev aluating a Neigh b orho o d-Sp ecific Crime Interv ention. Journal of the A meric an Statistic al Asso ciation , 112(517):109–126. Roth, J., San t’Anna, P . H. C., Bilinski, A., and Poe, J. (2023). What’s trending in difference- in-differences? A syn thesis of the recen t econometrics literature. Journal of Ec onometrics , 235(2):2218–2244. Sun, L. and Abraham, S. (2021). Estimating dynamic treatment effects in ev ent studies with heterogeneous treatment effects. Journal of Ec onometrics , 225(2):175–199. Wic kham, H. (2011). The Split-Apply-Com bine Strategy for Data Analysis. Journal of Statistic al Softwar e , 40:1–29. Xu, Y. (2017). Generalized Syn thetic Control Metho d: Causal Inference with In teractiv e Fixed Effects Mo dels. Politic al A nalysis , 25(1):57–76. Zubizarreta, J. R., Reinke, C. E., Kelz, R. R., Silb er, J. H., and Rosen baum, P . R. (2011). Matc hing for Several Sparse Nominal V ariables in a Case-Con trol Study of Readmission F ollowing Surgery. The Americ an Statistician , 65(4):229–238. 10
Original Paper
Loading high-quality paper...
Comments & Academic Discussion
Loading comments...
Leave a Comment