Estimating the Partially Linear Zero-Inflated Poisson Regression Model: a Robust Approach Using a EM-like Algorithm
Count data with an excessive number of zeros frequently arise in fields such as economics, medicine, and public health. Traditional count models often fail to adequately handle such data, especially when the relationship between the response and some…
Authors: María José Llop, Andrea Bergesio, Anne-Françoise Yao
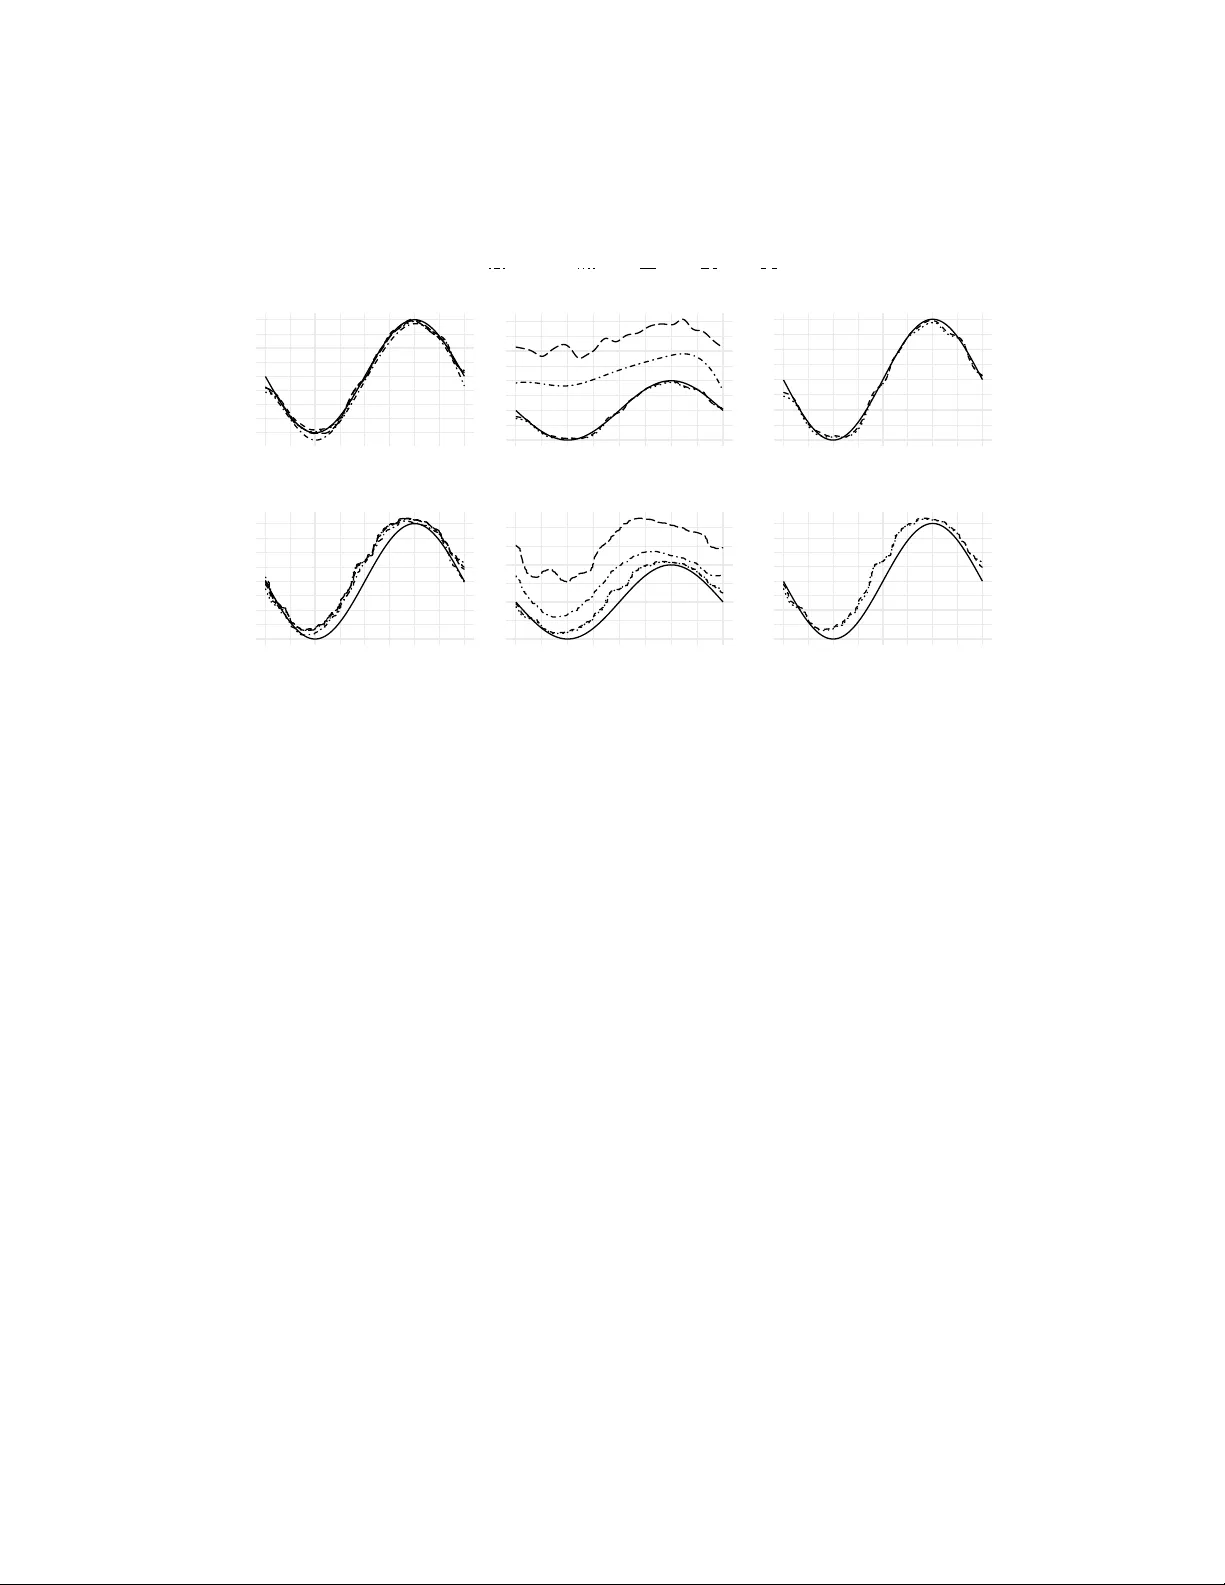
Estimating the P artially Linear Zero-Inflated P oisson Regression Mo del: a Robust Approac h Using a EM-lik e Algorithm María José Llop a,b, ∗ , Andrea Bergesio a , Anne-F rançoise Y ao c a Dep artamento de Matemátic a, F acultad de Ingeniería Químic a, Universidad Nacional del Litor al, Ar gentina b CONICET, Ar gentina c L ab or atoir e de Mathématiques, Université Clermont A uver gne, F r anc e Abstract Coun t data with an excessiv e n umber of zeros frequently arise in fields suc h as economics, medicine, and public health. T raditional coun t mod- els often fail to adequately handle such data, esp ecially when the relation- ship b et w een the resp onse and some predictors is nonlinear. T o o vercome these limitations, the partially linear zero-inflated Poisson (PLZIP) mo del has b een prop osed as a flexible alternative. Ho wev er, all existing estima- tion approac hes for this mo del are based on likelihoo d, which is kno wn to b e highly sensitiv e to outliers and slight deviations from the model assumptions. This article presen ts the first robust estimation method sp ecifically developed for the PLZIP mo del. An Exp ectation-Maximization-lik e algorithm is used to tak e adv an tage of the mixture nature of the mo del and to address ex- treme observ ations in b oth the resp onse and the cov ariates. Results of the algorithm conv ergence and the consistency of the estimators are prov ed. A sim ulation study under v arious con tamination schemes show ed the robust- ness and efficiency of the proposed estimators in finite samples, compared to classical estimators. Finally , the application of the metho dology is illustrated through an example using real data. Keywor ds: Generalized partially linear mo del, Zero-inflated P oisson regression mo del, EM-lik e algorithm, Robust estimation, Asymptotic ∗ Corresp onding author Email addr ess: llopmariajose@gmail.com (María José Llop) prop erties. 1. In tro duction Coun t data frequen tly arise in fields such as economics, medicine, and public health. These data often exhibit more zeros than standard coun t mo dels like P oisson or negative binomial can arise. Zero-inflated models address this issue by mo deling the data as a t wo-component mixture: a degenerate distribution with mass one at zero and a non-degenerate count distribution. Thus, a binomial component determines whether a count arises from structural zeros or from the coun t process. T o analyze such data, [1] in tro duced the zero-inflated Poisson (ZIP) mo del. Ho wev er, ZIP regression can b e to o restrictiv e when the relationship b et ween the resp onse and some predictors is nonlinear. T o o vercome this, [2] proposed the partially linear ZIP mo del (PLZIP), whic h incorp orates a nonparametric component to relax mo del assumptions and better capture complex asso ciations. Sp ecifically , w e will sa y throughout the pap er that a random v ariable y ∈ N 0 follo ws the PLZIP mo del if y ∼ ( 0 with probabilit y π P ( λ ) with probabilit y 1 − π where 0 ≤ π ≤ 1 and P ( λ ) is a P oisson distribution with parameter λ > 0 . The mixing probabilit y π is mo deled via a logistic link as logit ( π ) = log π 1 − π = z ⊤ γ and the Poisson mean is mo deled as log ( λ ) = x ⊤ β + m ( t ) , where z ∈ R q , x ∈ R p and t ∈ R are predictor v ariables, while β ∈ R p and γ ∈ R q are the regression parameters, and m is a contin u ous function. So, the parameter space for the PLZIP mo del is defined as Θ = { θ = ( β , γ , m ) ∈ R p × R q × C } , where C is the space of contin uous functions. The semiparametric structure of the PLZIP mo del requires b oth classical estimation metho ds for the parameters, suc h as maximum lik eliho o d, and smo othing tec hniques for the nonparametric part. In this context, [2] pro- p osed sieve maximum likelihoo d estimators using piecewise linear approx- imations. Later extensions include the doubly semiparametric ZIP mo del b y [3], and the single-index ZIP mo del estimated via profile likelihoo d with 2 B-splines b y [4]. Ho wev er, all these metho ds rely on lik eliho o d-based esti- mation, which is known to b e highly sensitiv e to outliers or slight deviations from mo del assumptions. Classical M-estimators, introduced by [5], provide robust alternatives to maxim um lik eliho o d b y replacing the score function with a robust estimat- ing function that do wnw eights observ ations with large residuals. Ho wev er, in mixture mo dels (particularly with w ell-separated comp onents) man y observ a- tions ma y naturally hav e large residuals relativ e to the ov erall mean, leading to excessiv e do wn weigh ting and biased estimates. T o address this limitation, [6] prop osed the robust exp ectation solution (RES) algorithm, whic h uses the Exp ectation-Maximization (EM) algorithm to iden tify the comp onen t mem- b ership of eac h observ ation and reduce the influence of extreme observ ations within eac h comp onen t. In partially linear mo dels, extreme v alues can also affect the shap e and scale of the estimate of the non-parametric comp onent. In this context, [7] analyzed the sens itivit y of classical estimators in generalized partially linear mo dels and prop osed robust alternatives based on lik eliho o d profiles. Later, [8] in tro duced a computationally efficient three-step robust procedure that estimates the linear and nonparametric comp onen ts sim ultaneously , solving the dep endency issue in profile lik eliho o ds. They also established consis- tency , asymptotic normalit y , and dev elop ed a robust test for the parametric comp onen t. The main goal of this article is to in tro duce a new robust estimation pro ce- dure for the PLZIP regression mo del. T o achiev e this, w e prop ose an EM-lik e algorithm combined with the three-step pro cedure in tro duced by [8], whic h enables the sequential estimation of linear and nonparametric components. Robust loss functions are incorp orated in to the M-step of the EM framework, instead of traditional log-likelihoo d functions, reducing the con tribution of extreme observ ations in terms of the comp onen t they b elong to. T aking ad- v an tage of the mixed nature of the mo del, this approac h addresses b oth the p oten tial complex relationships b etw een v ariables and sensitivity to outliers. The proposal and implemen tation of a robust method sp ecifically dev elop ed for the PLZIP model b ecomes a useful to ol for analyzing zero-inflated count data with complex predictor relationships. The pap er is organized as follows: In Section 2 w e in tro duce the robust estimator for the PLZIP mo del. In Section 3 a robust estimation EM-lik e algorithm is in tro duced to obtain the prop osed estimators and a result on the con v ergence of the algorithm is given. The consistency of the obtained 3 estimators is pro ved in Section 4. In Section 5 w e presen t simulation studies to compare the p erformance of the estimators under different con tamination sc hemes. Finally , the application of the metho dology is illustrated through an example using healthcare data in Section 6. 2. Robust estimators for the PLZIP mo del Let { ( y i , x ⊤ i , z ⊤ i , t i ) } n i =1 ∈ N 0 × R p × R q × R a random sample that follows the PLZIP mo del. Defining y = ( y 1 , . . . , y n ) the resp onse vector, the log- lik eliho o d function for the PLZIP model is given b y l n ( y , θ ) = X y i =0 log e z ⊤ i γ + exp ( − e x ⊤ i β + m ( t i ) ) − n X i =1 log(1 + e z ⊤ i γ ) + X y i > 0 y i ( x ⊤ i β + m ( t i )) − e x ⊤ i β + m ( t i ) − X y i > 0 log ( y i !) . Let us supp ose that we can observe an auxiliary (also known as latent or missing) v ariable w that indicates whether the response y arises from the degenerate distribution, i.e. it is a structural zero ( w = 1 ), or from the P oisson distribution ( w = 0 ). Then, the complete-data log-likelihoo d function for the complete data ( y , w ) where w = ( w 1 , . . . , w n ) , results l c n ( y , w , θ ) = n X i =1 (1 − w i ) y i x ⊤ i β + m ( t i ) − e x ⊤ i β + m ( t i ) − log ( y i !) (1) + n X i =1 w i z ⊤ i γ − log 1 + e z ⊤ i γ . Note that the first summation dep ends only on β and m , while the second summation depends only on γ . This separability allo ws the t wo terms to b e optimized indep enden tly , simplifying the estimation pro cedure. The fact that the first term in (1) in v olves both a linear component β and a nonparametric comp onen t m , makes it necessary to combine parametric and nonparametric estimation tec hniques. T o address this, we adopt the estimation pro cedure prop osed by [8], which allo ws these comp onen ts to b e estimated sequentially . Sp ecifically , w e pro ceed through the following three steps: 4 Step 1: F or each fixed v alue of the v ariable t , let sa y t = τ , denote η = m ( τ ) and compute ( ˜ β n ( τ ) , ˜ m n ( τ )) = argmin β , η n X i =1 W i,n ( τ )(1 − w i ) e x ⊤ i β + η − y i x ⊤ i β + η + log ( y i !) , where W i,n ( τ ) is the classical Nadaray a-W atson k ernel type weigh ts W i,n ( τ ) = K τ − t i h n P n j =1 K τ − t j h n , with K a k ernel function usually symmetric and p ositiv e, and h n > 0 a smo othing parameter selected to matc h the smo othness of m . F ollo wing the weigh ted lik eliho o d estimation approach prop osed b y [9] and [10], k ernel w eights are incorporated into the estimation procedure to exploit the assumed smo othness of the function m . Sp ecifically , the assumption that m is smooth implies that if t j is close to τ , then hen the corresp onding v alues y j and x j pro vide relev ant information about m ( τ ) . Step 2: Once an initial estimate of the nonparametric comp onen t has b een obtained, it is then used to get an estimate (indep enden t of τ ) of the linear parameter, as follo ws b β n = argmin β n X i =1 (1 − w i ) e x ⊤ i β + ˜ m n ( t i ) − y i x ⊤ i β + ˜ m n ( t i ) + log ( y i !) and an estimator of γ is found as b γ n = argmin γ n X i =1 log 1 + e z ⊤ i γ − w ( r ) i z ⊤ i γ . Step 3 : The estimate of β obtained in Step 2 is then used to improv e the nonparametric estimation of m b m n ( τ ) = argmin η n X i =1 (1 − w i ) e x ⊤ i b β + η − y i x ⊤ i b β + η + log ( y i !) , where, again, this estimation is carried out for eac h fixed v alue t = τ . 5 The pro cedure described abov e relies on the assumption that the auxiliary v ariable w i is observ able, ho wev er, it is not p ossible to determine whether a zero is structural or comes from the Poisson comp onen t. In this con text w e use the main idea of the EM algorithm, which pro ceeds by computing the conditional exp ectation of (1) giv en the resp onse and then maximizing it. F urthermore, because the complete-data log-lik eliho o d is linear in w i , this step is equiv alent to directly replacing w i b y its conditional exp ectation E ( w i | y i ) in (1). In that direction, by Ba y es’ rule, it is easy to show that (see [1], page 4) E θ ( w i | y i ) = 1 1 + exp {− z ⊤ i γ − e x ⊤ i β + m ( t i ) } if y i = 0 0 if y i > 0 . T o obtain robust estimators, we prop ose replacing the estimation func- tions used in the three steps with robust alternatives. In that direction, consider ρ : N 0 × R → R a loss function (on which conditions are imp osed in Section 4), ω 1 : R p → R and ω 2 : R q → R p enalt y functions con trol- ling the high leverage x and z predictors, resp ectiv ely . Define the following functionals Q 1 ( η , β , τ | θ ) = E 0 (1 − E θ ( w | y )) ρ ( y , x ⊤ β + η ) ω 1 ( x ) | t = τ , (2) Q 2 ( β , m | θ ) = E 0 (1 − E θ ( w | y )) ρ ( y , x ⊤ β + m ( t )) ω 1 ( x ) , (3) Q 3 ( γ | θ ) = E 0 h log 1 + e z ⊤ γ − E θ ( w | y ) z ⊤ γ ω 2 ( z ) i , (4) where E 0 denote the exp ectation under the true mo del, this is, when the true parameter v alue is θ 0 = ( β 0 , γ 0 , m 0 ) ∈ Θ . The last argumen t θ emphasizes that the conditional exp ectation E θ ( w | y ) is taken under the parameter θ . Throughout this article w e assume that ρ , ω 1 and ω 2 are suc h that ( ˜ β 0 ( τ ) , m 0 ( τ )) = argmin β ,η Q 1 ( η , β , τ | θ ) , β 0 = argmin β Q 2 ( β , m 0 | θ ) , γ 0 = argmin γ Q 3 ( γ | θ ) , and ρ is selected to ensure the uniqueness of β 0 and m 0 ( · ) . As motiv ated b y the discussion ab o v e regarding the smoothness of m and the use of kernel weigh ts, we construct the empirical analogue of (2) b y 6 means of a robust v ersion of the w eighted likelihoo d approach prop osed by [9] and [10]. Sp ecifically , Q n, 1 ( η , β , τ | θ ) = n X i =1 W i,n ( τ )(1 − E θ ( w i | y i )) ρ ( y i , x ⊤ i β + η ) ω 1 ( x i ) . (5) T o obtain the empirical analogues of (3) and (4), w e replace the exp ectation op erator E 0 b y integration with resp ect to the empirical distribution of the observ ed data, which yields the following expressions Q n, 2 ( m, β | θ ) = 1 n n X i =1 (1 − E θ ( w i | y i )) ρ ( y i , x ⊤ i β + m ( t i )) ω 1 ( x i ) , Q n, 3 ( γ | θ ) = 1 n n X i =1 log 1 + e z ⊤ i γ − E θ ( w i | y i ) z ⊤ i γ ω 2 ( z i ) . (6) Definition 2.1. Given the r andom sample { ( y i , x ⊤ i , z ⊤ i , t i ) } n i =1 ∈ N 0 × R p × R q × R , which fol lows the PLZIP mo del with p ar ameter θ 0 = ( β 0 , γ 0 , m 0 ) ∈ Θ , the r obust thr e e-step estimator b θ n = ( b β n , b γ n , b m n ) for θ 0 is given by the fol lowing steps: Step 1: ( ˜ β n ( τ ) , ˜ m n ( τ )) = ar gmin β ,η Q n, 1 ( η , β , τ | θ ) . Step 2 : b β n = ar gmin β Q n, 2 ( ˜ m n , β | θ ) , b γ n = ar gmin γ Q n, 3 ( γ | θ ) . Step 3: b m n ( τ ) = ar gmin η Q n, 1 ( η , b β n , τ | θ ) . The estimators also can b e obtained by differen tiating the functions Q n, 1 , Q n, 2 and Q n, 3 and equating them to zero. More sp ecifically , let S n ( θ ) = ( S n, 1 ( η , β , τ | θ ) ⊤ , S n, 2 ( m, β | θ ) ⊤ , S n, 3 ( γ | θ ) ⊤ ) ⊤ (7) 7 with S n, 1 ( η , β , τ | θ ) = n X i =1 W i,n ( τ )(1 − E θ ( w i | y i ))Ψ( y i , x ⊤ i β + η ) ω 1 ( x i ) a i , S n, 2 ( m, β | θ ) = 1 n n X i =1 (1 − E θ ( w i | y i ))Ψ( y i , x ⊤ i β + m ( t i )) ω 1 ( x i ) x ⊤ i , S n, 3 ( γ | θ ) = 1 n n X i =1 1 + e − z ⊤ i γ − 1 − E θ ( w i | y i ) z ⊤ i ω 2 ( z i ) , where Ψ( y , u ) = ∂ ∂ u ρ ( y , u ) and a i = (1 , x i ) ⊤ . Then, the empiric al estimation e quations system giving rise to the estimators is S n ( θ ) = 0 . (8) Under the true mo del, e.i. when the parameter v alue is θ 0 , (7) is given b y S 0 ( θ ) = ( S 1 ( β , η , τ | θ ) ⊤ , S 2 ( β , m | θ ) ⊤ , S 3 ( γ | θ ) ⊤ ) , with S 1 ( β , η , τ | θ ) = E 0 [(1 − E θ ( w | y ))Ψ( y , x ⊤ β + η ) ω 1 ( x ) a | t = τ ] , S 2 ( β , m | θ ) = E 0 [(1 − E θ ( w | y ))Ψ( y , x ⊤ β + m ( t )) ω 1 ( x ) x ⊤ ] , S 3 ( γ | θ ) = E 0 1 + e − z ⊤ γ − 1 − E θ ( w | y ) z ⊤ ω 2 ( z ) , where a = (1 , x ⊤ ) ⊤ . Then, the theoretical system of estimation equations results S 0 ( θ ) = 0 . (9) Note that if we c ho ose the function ρ is deriv able with deriv ative Ψ sat- isfying E θ (Ψ( y i , x ⊤ β + m ( t )) | x , t ) = 0 , it is easy to sho w that θ 0 v erifies (9). Condition E θ (Ψ( y i , x ⊤ β + m ( t )) | x , t ) = 0 is known as c onditional Fisher- c onsistency . T o satisfy this condition, the loss functions ρ considered in this w ork are defined as follows ρ ( y , u ) = ϕ ( e u − y ( u + 1 − ln y )) + G ( e u ) (10) 8 where ϕ ( x ) is a b ounded non-decreasing function for x > 0 , with con tinu- ous deriv ative φ , and G ( e u ) is a correction term that guaran tees the Fisher consistency condition. In this case, it is given by G ( s ) = − Z φ ( s ) e − s ds (11) + ∞ X j =1 Z φ ( s − j ( l n ( s ) + 1 − ln j )) ( s j e − s ) j ! ( j − s ) s ds. Remark 2.1. A r obust loss function is not ne e de d in (6) sinc e, as discusse d by [6], r e ducing the influenc e of high-lever age c ovariate observations by me ans of the weight function ω 2 and ensuring an ac cur ate estimation of w i thr ough its c onditional exp e ctation (obtaine d via a r obust estimate of β ) is sufficient to pr eserve the r obustness of the estimator γ . 3. The robust EM-lik e algorithm T o compute the estimator prop osed in Definition 2.1, we in tro duce an EM-lik e algorithm that com bines the three-step procedure describ ed ab ov e with the EM framew ork. It consists of the following steps: (Initialization) Get an initial v alue b θ (0) n = ( b β (0) n , b γ (0) n , b m (0) n ) . ( E step) In the r -th iteration estimate w i b y w ( r ) i = E b θ ( r ) n ( w i | y i ) where the exp ectation is tak en under the curren t parameter estimator b θ ( r ) n . ( M step) Carry out the three-step pro cedure: Step 1: F or eac h fixed v alue t = τ denote η = m ( τ ) and calculate ( ˜ β n ( τ ) , ˜ m n ( τ )) = argmin β ,η Q n, 1 ( η , β , τ | b θ ( r ) n ) . Step 2: Compute β estimator using ˜ m n from Step 1 b β ( r +1) n = argmin β Q n, 2 ( ˜ m n , β | b θ ( r ) n ) and find γ estimate as b γ ( r +1) n = argmin γ Q n, 3 ( γ | b θ ( r ) n ) . 9 Step 3: Using b β ( r +1) n from Step 2, up date m estimator as b m n ( τ ) = argmin η Q n, 1 ( η , b β ( r +1) n , τ | b θ ( r ) n ) . Remark 3.1. A dapting the pr ofile likeliho o d appr o ach use d by [7], for e ach fixe d value of β ∈ R p we should c alculate ˜ m β ,n ( τ ) = ar gmin η Q n, 1 ( η , β , τ | b θ n ) . Conse quently, it would b e ne c essary to c ompute ˜ m β ,n at e ach data p oint t i over a grid of p ossible values of β , in or der to c alculate the obje ctive func- tion Q n, 2 ( β , ˜ m β ,n | b θ n ) , which r esults in a c onsider able c omputational c ost. In c ontr ast, the simultane ous estimation of β and η in Step 1 avoids neste d op- timization, sinc e β and η ar e estimate d jointly for e ach data p oint t i , without the ne e d to do so for a grid of β values, r e ducing the c omputational c ost. 3.1. A lgorithm c onver genc e In [6] the authors prop osed robust estimating equations to obtain the ZIP mo del estimators b y the exp ectation-solution (ES) algorithm. This is similar to the EM but an estimating equation is solv ed instead of maximizing the exp ected log-likelihoo d. When the deriv atives of the log-likelihoo d function giv e the equations of the ES algorithm, the ES and EM algorithms are equiv a- len t. [11] sho wed under certain regularity conditions that if the ES algorithm con verges, it conv erges to a solution of an un biased estimating function. In this article, a similar result is pro ved for the estimation equations defined in (8). Theorem 3.1. If ther e exists a p oint θ ∗ such that the ES algorithm c on- ver ges to, this is lim r →∞ b θ ( r ) n = θ ∗ , and ρ is such that its derivative Ψ is c ontinuous and verifies E θ (Ψ( y , x ⊤ β + m ( t )) | x , t ) = 0 , then S n ( θ ∗ ) = 0 . F urthermor e, S n is an unbiase d estimation e quation, this is E θ ( S n ( θ )) = 0 for e ach θ ∈ Θ . The pro of of Theorem 3.1 follows from the Prop osition in App endix of [11], since it is easy to sho w that the following conditions are satisfied 1) E θ ( S n, 1 ( β , η , τ | θ )) = 0 , E θ ( S n, 2 ( β , m | θ )) = 0 and E θ ( S n, 3 ( γ | θ )) = 0 . 2) S n ( θ ) is a con tin uous function in Θ . 10 Remark 3.2. The or em 3.1 guar ante es that the algorithm c onver ges to a so- lution of the system S n ( θ ) = 0 . Mor e over, the r obust thr e e-step pr o c e dur e estimator intr o duc e d in Definition 2.1 is also a solution to this system; how- ever, uniqueness is not guar ante e d. Conse quently, a go o d initialization of the algorithm is essential in pr actic e to r e aching the glob al minimum and to avoid c onver genc e to lo c al solutions. 4. Asymptotic prop erties Under the regularity conditions presented in [8] we pro ve the consistency of the estimators presen ted in this work. C1 ρ ( y , u ) is con tinuously differen tiable and b ounded; ω 1 and ω 2 are b ounded. C2 The k ernel function K : R → R is even, non-negative, bounded and con tinuous with a b ounded deriv ative, whic h satisfies R K ( u ) du = 1 , R u 2 K ( u ) du < ∞ and | u | K ( u ) → 0 if | u | → 0 . C3 The sequence h n satisfies h n → 0 y nh n / log( n ) → ∞ . C4 The marginal density of t , f T , is a b ounded function on T . Let T 0 ⊂ T b e compact set and let T δ ⊂ T b e the closure of a δ -neighborho o d of T 0 , there exists a p ositive constan t A 1 ( T δ ) suc h that A 1 ( T δ ) < f T ( t ) ∀ t ∈ T δ . C5 Q 1 ( η , β , τ | θ ) satisfies the follo wing equicontin uity condition: given ε > 0 ∃ δ > 0 such that | τ 1 − τ 2 | < δ for τ i ∈ T 0 and || β 1 − β 2 || < δ for β i ∈ K , i = 1 , 2 . Then sup η ∈ R | Q 1 ( η , β 1 , τ 1 | θ ) − Q 1 ( η , β 2 , τ 2 | θ ) | < ε . || · || indicates L 2 − norm. C6 Q 1 ( η , β , τ | θ ) and m 0 ( t ) are con tinuous. T o in tro duce the notation to b e used from no w on, supp ose that v : T → R is a con tinuous function and define || v || ∞ = sup t ∈T | v ( t ) | and || v || 0 , ∞ = sup t ∈T 0 | v ( t ) | where T 0 ⊂ T is a compact set. N ( ε, F , L 1 ( Q )) denotes the co v- ering n umber of a family of functions F . Sp ecific details ab out the co vering n umber of a class can b e found in [12]. Lemma 4.1. L et K ⊂ R p b e a c omp act set, supp ose that C1-C6 ar e satisfie d and K is a b ounde d variation function. Consider the family of functions F = { f β ,η ( y , x | θ ) = (1 − E θ ( w | y )) ρ ( y , x ⊤ β + η ) ω 1 ( x ) , β ∈ K , η ∈ R } . Supp ose that exist c onstants A and W such that F has a c overing numb er sup Q N ( ε, F , L 1 ( Q )) ≤ Aε − W . Then, 11 (a) sup β ∈K , η ∈ R || Q n, 1 ( η , β , ·| θ ) − Q 1 ( η , β , ·| θ ) || 0 , ∞ a.s. − → 0 (b) || ˜ m n − m 0 || 0 , ∞ a.s. − → 0 and || ˜ β n − β 0 || 0 , ∞ a.s. − → 0 . Pro of of Lemma 4.1. The pro of of (a) follo ws from the steps of the pro of of Lemma 3.1 of [7], b y b ounding the term | 1 − E θ ( w i | y i ) | < 1 . See details in App endix A. (b) is easy to pro v e using (a), C 6 and Lemma A1 of [13]. In the notation of the Lemma A1, take f = Q 1 with unique minimizer ( β 0 , m 0 ( t )) ∈ K × C and f n = Q n, 1 with a minimizer ( ˜ β n ( t ) , ˜ m n ( t )) . ■ Theorem 4.1. Supp ose that Ψ is b ounde d, c onditions of L emma 4.1 ar e satisfie d and the family of functions H = { h β ( y , x , t | θ ) = (1 − E θ ( w | y )) ρ ( y , x ⊤ β + ˜ m n ( t )) ω 1 ( x ) , β ∈ R p } has a c over age numb er such that log N ( ε, H , L 1 ( P n )) = o p ( n ) , wher e P n is the empiric al distribution of ( y , x , t ) . Then the fol lowing c onditions ar e satisfie d, (a) sup β ∈ R p | Q n, 2 ( ˜ m n , β | θ ) − Q 2 ( m 0 , β | θ ) | a.s. − → 0 . (b) If Q 2 ( m 0 , β | θ ) has a unique minimum β 0 , x has a se c ond finite moment and l im inf || β ||→∞ Q 2 ( m 0 , β | θ ) > Q 2 ( m 0 , β 0 | θ ) , then b β n a.s. − → β 0 . Pro of of Theorem 4.1 is giv en in App endix A. Remark 4.1. Applying known r esults it is e asy to se e that the c ondition on the c overing numb er of the family F in L emma 4.1 is fulfil le d under gener al c onditions when ρ is define d as (10) . Inde e d, if ϕ and G ( e u ) of (10) have b ounde d variation, by L emma 22 of [14] the c overing numb er of the class { G ( e x ⊤ β + η ) , β ∈ R q , η ∈ R } gr ows at a p olynomial r ate (is b onde d by Ae − W for some c onstants A and W ). On the other hand, the c overing numb er of the class { e x ⊤ β + η − y ( x ⊤ β + η + 1 − ln y ) , β ∈ R p , η ∈ R } gr ows at a p olynomial r ate sinc e the family { x ⊤ β + η , β ∈ R p , η ∈ R } has finite dimension (and by L emma 28 of [12] gr ows at a p olynomial r ate). Using the L emma 16 of [14] which states that for r ≥ 1 N ( ε, H 1 + H 2 , L r ( P )) ≤ N ( ε, H 1 , L r ( P )) N ( ε, H 2 , L r ( P )) the r esult is derive d. A similar r e asoning c an b e applie d to the c ondition ab out the c overing numb er of the functions family H in The or em (4.1) . 12 Corollary 4.1. If hyp othesis of The or em 4.1 ar e verifie d, || b m n − m 0 || 0 , ∞ a.s. − → 0 . The pro of of Corollary 4.1 follows easily from Lemma 4.1 and Theorem 4.1, applying Lemma A1 of [13]. The follo wing theorem states the consistency of b γ n and is based on an analogous result to that of [15] for the consistency of ML estimator under w eaker conditions than usual. Theorem 4.2. Supp ose that exist N 0 such that b γ n ∈ K 1 ∀ n > N 0 with K 1 a c omp act set. Supp ose also that the fol lowing c onditions hold (a) L et B b e an op en neighb orho o d of γ ′ , E 0 inf γ ∈B log 1 + e z ⊤ γ − E θ ( w | y ) z ⊤ γ ω 2 ( z ) → Q 3 ( γ ′ | θ ) when B → γ ′ . (b) Exists γ 0 such that Q 3 ( γ 0 | θ ) < Q 3 ( γ | θ ) for al l γ . Then b γ n a.s. − → γ 0 . 5. Sim ulation Studies In this section, w e conduct a finite-sample sim ulation study to ev aluate the robustness and p erformance of the estimators prop osed in this article, under four differen t con tamination schemes. F or eac h simulated sample, the PLZIP mo del is estimated using the pro cedure describ ed in Section 3. Ad- ditionally , estimators proposed b y other authors are computed to enable a comparativ e assessment of p erformance. 5.1. R obust L oss F unction The loss functions employ ed in this article ha ve the general form giv en in (10), where the term G , which ensures Fisher consistency , is defined in (11). Th us, the only remaining choice is the sp ecification of the function ϕ . In this w ork, we consider t w o different c hoices for ϕ , resulting in tw o robust estimators for eac h linear parameter and the nonparametric function of the PLZIP mo del. 13 One of the ϕ functions implemented is that prop osed by [16]. In their w ork, the authors extended the study of [17] to robustly estimate logistic regression mo dels, deriving conditions for the existence of the estimator in finite samples and proposing a corresponding algorithm for its computation. The robust function is giv en by ϕ C H ( s ) = ( se − √ c , | s | ≤ c e − √ c (2(1 + √ c ) + c ) − 2 e − √ s (1 + √ s ) , | s | > c where the constant c is chosen following the recommendation of [16], who suggest selecting it as a trade-off b et ween robustness and efficiency: larger v alues of c improv e efficiency at the exp ense of robustness, and smaller v alues increase robustness but reduce efficiency . In this work, we set c = 0 . 5 as a balanced c hoice. The estimators obtained using this robust loss function, are denoted CH, whic h refers to the authors Croux and Haesbro ec k. The second ϕ function is based on the redescending M-estimators applied to transformed resp onses (MT estimators) prop osed by [18]. In their w ork, the authors suggested transforming the resp onse v ariable to stabilize its v ari- ance to an appro ximately constant v alue, ensuring appropriate scaling of the loss function used to define the M-estimator. They demonstrated that, in the case of the P oisson distribution, the square ro ot transformation effectiv ely mak es the v ariance of the response v ariable nearly constan t. Sp ecifically , the robust loss function is giv en by ρ ( y , u ) = ϕ M T ( √ y − f ( e u )) , (12) with ϕ M T ( s ) = 1 − 1 − s c 2 4 , | s | ≤ c 1 , | s | > c and f ( λ ) = argmin u E λ ( ϕ M T ( √ y − u )) , where the exp ectation is tak en under a Poisson distribution with parameter λ . As the authors indicate, the constan t is c hosen c = 2 . 9 to hav e an effi- ciency b et ween 75% and 90% . The estimators obtained using this robust loss function are denoted MT. The weigh t functions ω 1 and ω 2 that we use are those of [18], defined as functions of the Mahalanobis distance. 14 Remark 5.1. It is worth noting that the additional term G is not r e quir e d in (12) , sinc e, due to the choic e of f , the function natur al ly satisfies the Fisher c onsistency c ondition. F or comparison purp oses, we also compute estimators with EM-lik e al- gorithm prop osed in this w ork, using the standard log-lik eliho o d function; these are denoted ML. Moreo ver, to enric h the comparativ e analysis, we implemen t the approach prop osed by [4] for estimating the PLZIP mo del based on lik eliho o d profiles and B-spline approximations, which we denote b y BS-ML (where BS indicates the use of B-splines). In addition, we consider estimators of the ZIP linear regression model by introducing the cov ariate t as a linear predictor. In this context, we include the RES estimator of [6] as w ell as the classical maximum likelihoo d estimator for the ZIP mo del, denoted RES and ZIP-ML, resp ectiv ely . A t this p oin t it is imp ortan t to highligh t that ZIP-ML and RES are estimators of a mo del that is not the true mo del of the data, which could affect their p erformance in sim ulation studies. 5.2. Contamination Schemes T o ev aluate the robustness of the prop osed estimators we consider four differen t contamination schemes inspired b y the simulation study in [6]. The first one is non-con taminated, while the remaining sc hemes inv olve 10% con- tamination either in the resp onse v ariable, in the cov ariates, or in b oth. The parameters are set to β = (2 , 2) ⊤ and γ = ( − 1 , 1) ⊤ . The cov ariates are generated as follows: x 1 = 1 for the first n/ 2 observ ations and x 1 = 0 otherwise; x 2 ∼ U [0 , 1] ; t ∼ U [ − 2 , 2] ; z 1 ∼ U [0 , 1] ; and z 2 ∼ N (0 , 1) . The nonparametric comp onen t is defined as m ( t ) = sin π 2 t . F or this parameter setting, N = 100 data sets of sample size n = 500 w ere generated. The con tamination schemes considered in this study are the following: Sc heme C 0 : Non-con taminated. Sc heme C 1 : 10% of the resp onse v ariable is contaminated b y adding a large fixed v alue y 0 = 70 . Sc heme C 2 : 10% of the cov ariate x 2 is con taminated, no w generated with distribution U [1 , 2] . In the same observ ations, the resp onse is set to y = 0 . This leads to “false zeros” since, for these con taminated observ ations, x ⊤ i β is large and th us the exp ected Poisson mean λ i = e x ⊤ i β + m ( t i ) w ould suggest large counts. Ho w ever, zeros are observ ed instead. F or this contamination 15 sc heme, it is necessary to also incorp orate the w eight ω 2 ( x i ) in (6) to properly address the presence of false zeros. Sc heme C 3 : This scenario combines sc hemes C 1 and C 2 . Specifically , 5% of the co v ariate x 2 is con taminated with distribution U [1 , 2] , and in the same observ ations, the resp onse is set to y = 0 . Additionally , 5% of the resp onse v ariable is con taminated by adding a constan t v alue y 0 = 70 . 5.3. Me asur e of Performanc e V arious p erformance metrics are calculated to ev aluate the obtained es- timators. Sp ecifically , to quantify the error of b m , the w ell-known root mean square error (RMSE) RM S E ( b m ) = 1 n n X i =1 ( b m n ( t i ) − m 0 ( t i )) 2 ! 1 / 2 is computed for eac h sample. Concerning the linear parameters, the distances b et w een the estimators obtained with each sample and the true parameter v alue are calculated. That is || b β n − β 0 || and || b γ n − γ 0 || , where || · || represents the L 2 -norm. 5.4. R esults In this subsection, we present the results corresp onding to each con tami- nation scheme. The estimators prop osed in this work require the sp ecification of the smo othing parameter h n , associated with the Nadara ya-W atson k ernel w eights used in (5). The v alue of h n w as computed for eac h estimator using 5-fold cross-v alidation on the first ten simulated datasets. T o select h n , w e applied 5-fold cross-v alidation to the first ten simulated datasets, follo wing the pro cedure describ ed in [7]. Given the similarit y of the optimal h n v alues obtained across these datasets and in order to reduce the ov erall computa- tional cost, w e adopted the a verage of the ten selected v alues as a fixed h n for the remaining datasets. The final v alues of the smo othing parameter used for each estimator were h n,M L = 0 . 126 , h n,M T = 0 . 135 and h n,C H = 0 . 159 for ML, MT and CH estimators, resp ectiv ely . Figure 1 sho ws the L 2 -norm distance b et w een each β estimator and the true parameter v alue β 0 , for each metho d and contamination scheme. In Figure 1a), it can b e seen that under sc heme C 0 , the ML estimator prop osed in this work shows the b est p erformance, follow ed b y the BS-ML estimator 16 0.0 0.1 0.2 0.3 0.4 BS−ML CH ML MT RES ZIP−ML a) C0 0.0 0.5 1.0 1.5 BS−ML CH ML MT RES ZIP−ML b) C1 0.0 0.1 0.2 0.3 0.4 CH MT RES c) C1 0.0 0.1 0.2 0.3 0.4 BS−ML CH ML MT RES ZIP−ML d) C2 0.0 0.5 1.0 1.5 BS−ML CH ML MT RES ZIP−ML e) C3 0.0 0.1 0.2 0.3 0.4 CH MT RES f) C3 Figure 1: L 2 -norm distance from β 0 to the estimators. The panels a), b), d) and e) represen t each contamination sc heme. c) and f ) are zo omed views of the panels b) and e), resp ectiv ely . and the robust CH and MT estimators. The b eha vior of the robust esti- mators do es not differ significan tly from that of the ML estimators in this scenario, demonstrating their efficiency . In contrast, the RES and ZIP-ML estimators p erform worse since the data w ere generated under a partially linear mo del. On the other hand, Figures 1b) and 1e) show that in sc hemes C 1 and C 3 , where con tamination is presen t in the response v ariable, the max- im um likelihoo d-based estimators p erform p o orly , as exp ected. In this case the BS-ML and ZIP-ML estimators are more conserv ativ e than the ML esti- mator, since the latter offers more flexibility provided by the nonparametric comp onen t estimated using the w eigh ted log-lik eliho o d function, allo wing the estimator to b etter adapt to the data. Ho wev er, when the data contain ex- treme v alues, this flexibility b ecomes counterproductive. Figure 1d) shows that sc heme C 2 do es not seem to affect the estimation of β , as the b eha vior of the estimators is v ery similar to sc heme C 0 . This is reasonable since high- lev erage observ ations in the cov ariate x are controlled b y the function ω 1 , and false zeros mainly affect the estimation of γ . Figures 1c) and 1f ) pro vide a zo omed view of panels b) and e), resp ectively , allo wing for a clearer exam- ination of the b eha vior of the robust estimators. It can b e seen that in both sc hemes C 1 and C 3 , the RES estimator p erforms w orse than the other ro- bust metho ds, while the MT estimator sho ws the b est p erformance, slightly 17 0.0 0.1 0.2 0.3 0.4 BS−ML CH ML MT RES ZIP−ML a) C0 0.0 0.2 0.4 BS−ML CH ML MT RES ZIP−ML b) C1 0.0 0.2 0.4 0.6 0.8 BS−ML CH ML MT RES ZIP−ML c) C2 0.0 0.2 0.4 0.6 BS−ML CH ML MT RES ZIP−ML d) C3 Figure 2: L 2 -norm distance from γ 0 to each estimator. The panels a), b), c) and d) represen t eac h con tamination sc heme. outp erforming CH. Ov erall, b oth MT and CH estimators demonstrate go o d p erformance on uncontaminated data and strong resistance to outliers on con taminated data. In Figure 2 the L 2 -norm distances b et ween the γ estimators and the true parameter v alue γ 0 are plotted. Specifically , in Figure 2a), it can b e observ ed that all estimators achiev e similar p erformance. In this case, the RES and ZIP-ML estimators are not affected b y the sp ecification of the mo del b ecause it does not include a nonparametric component in the π i parameter. Figure 2b) shows that contamination under scheme C 1 induces a sligh t inefficiency in the robust MT, CH, and RES estimators. In the scenarios with con tamination in the predictor v ariable, C 2 and C 3 , the robust MT and CH estimators clearly outp erform the other metho ds. This result is consisten t, since the weigh ts used to control extreme v alues of the cov ariates prev ent false zeros from affecting the MT and CH estimators. The RES estimator p erforms p o orly under this t yp e of contamination, p ossibly due to the lac k of weigh ts that control extreme v alues on x . Figure 3 plots the RMSE v alues for the estimators of the function m , for those metho ds that allo w its estimation. In scheme C 0 , the BS-ML estimator p erforms slightly b etter than the others. In the remaining schemes, the b e- ha vior of the estimators is quite similar to that of the β 0 estimators describ ed in Figure 1, as the β parameter and the function m are estimated by mini- 18 0.00 0.05 0.10 0.15 0.20 0.25 BS−ML CH ML MT a) C0 0 1 2 3 BS−ML CH ML MT b) C1 0.00 0.05 0.10 0.15 0.20 0.25 CH MT c) C1 0.00 0.05 0.10 0.15 0.20 0.25 BS−ML CH ML MT d) C2 0 1 2 3 BS−ML CH ML MT e) C3 0.00 0.05 0.10 0.15 0.20 0.25 CH MT f) C3 Figure 3: RMSE of each estimator of the nonparametric comp onen t m 0 . The panels a), b), d) and e) represent each contamination sc heme. c) and f ) are zo omed views of the panels b) and e), resp ectiv ely . mizing the same ob jective function and, therefore, con taminated data affect b oth in a similar w ay . Sp ecifically , w e observe that under sc heme C 2 , the p erformance of the estimators is similar to that under C 0 , while in sc hemes C 1 and C 3 , the non-robust estimators are affected by extreme v alues. The p erformance of the robust estimators can b e b etter appreciated in Figures 3c) and 3f ), whic h pro vide zo omed views of panels b) and e), resp ectiv ely . These plots show that the MT estimator ac hieves sligh tly b etter p erformance than the CH estimator. Figure 4 illustrates an example of the estimated function m for a par- ticular sample. It can b e observed that under sc hemes C 1 and C 3 , the lik eliho o d-based estimators, ML and BS-ML, p erform p oorly , whereas the robust estimators maintain go o d performance. In contrast, under sc hemes C 0 and C 2 , all estimators exhibit similarly go od b ehavior. 6. Example In this section, a real-world data example is presen ted to ev aluate the predictiv e p ow er of the estimators. The example is based on data from a public health surv ey conducted in Indonesia in 1997, for more details see [19]. The resp onse v ariable of in terest is the num b er of da ys that w orking- 19 Estimator BS−ML CH m0 ML MT −1.0 −0.5 0.0 0.5 1.0 −2 −1 0 1 2 t a) C0 −1 0 1 2 3 −2 −1 0 1 2 t b) C1 −1.0 −0.5 0.0 0.5 1.0 −2 −1 0 1 2 t c) C1 −1.0 −0.5 0.0 0.5 1.0 −2 −1 0 1 2 t d) C2 −1 0 1 2 −2 −1 0 1 2 t e) C3 −1.0 −0.5 0.0 0.5 1.0 −2 −1 0 1 2 t f) C3 Figure 4: T rue function m 0 and its estimates obtained from a sp ecific simulated dataset under each contamination scheme. age ( 18 − 60 y ears) individuals missed their main activities due to illness in the previous four weeks self-reported b y the resp onden t. The explanatory v ariables are household annual p er capita income ( x 1 in thousands), gender ( x 2 = 1 for women and 0 otherwise), the household h ygiene index ( x 3 ranges from 0 to 5 , from b est to worst), and age ( t ranges from 18 to 60 years). One observ ation is randomly selected from each household to a void the problem of p ossible in tra-household correlation. W e supp ose that the population is divide in to the lo w-risk group, whic h generates structural zeros; and the high- risk group, whose coun ts can b e mo deled using a Poisson regression mo del. W e assumed that the prop ortion of lo w-risk sub jects could b e affected b y the predictor v ariables z = (1 , x ⊤ , t ) ⊤ , where x ⊤ = ( x 1 , x 2 , x 3 ) ⊤ . The num b er of days that individuals missed their main activities due to illness in the previous four weeks ranges from 0 to 28 with a mean of 1 . 05 and v ariance of 10 . 16 . The v ariance is m uch larger than the mean, indicating p oten tial o verdispersion. As shown in Figure 5, the data con tain more zero visits than a typical P oisson distribution. Sp ecifically , the p ercen tage of the zero coun t is 6359 / 5073 ≈ 80% . In addition, there are some particularly extreme coun ts. 20 0.0 0.2 0.4 0.6 0.8 0 1 2 3 4 5 6 7 8 9 10 11 12 13 14 15 16 17 18 20 21 24 25 28 Frecuency Figure 5: Barplot of the num b er of days of missed primary activities due to illness in the past 4 weeks self-rep orted by the respondent. This data w ere also analyzed b y [2] using a semiparametric ZIP regression mo del. The authors men tion that the age v ariable is generally not signifi- can t when assuming a linear relationship in a parametric setting, primarily b ecause the effects of age can b e very differen t across age groups. Therefore, they p ostulate that the age v ariable has a nonlinear relationship with the natural logarithm of the a verage num b er of da ys of absence from main ac- tivities due to illness among sub jects in the high-risk group. In this article, the PLZIP model is emplo yed to study the relationship b et ween the num b er of da ys of absence and co v ariates. Based on the assumption of [2] we include the v ariable age in the nonparametric comp onen t, so that logit ( π ) = γ 0 + γ 1 x 1 + γ 2 x 2 + γ 3 x 3 + γ 4 t, log( λ ) = β 1 x 1 + β 2 x 2 + β 3 x 3 + m ( t ) . W e estimate the model using the estimators prop osed in this article, as well as those previously presented in Section 5. T o provide a measure of the prediction error, we p erformed a 5-fold cross-v alidation and calculated the trimmed mean of the 20% squared prediction error within eac h fold. The results are presented in Figure 6. This indicates that predictions made using the maximum lik eliho o d function (ZIP-ML, BS-ML, and ML) exhibit greater errors than those obtained with mo dels estimated robustly 21 0.8 0.9 1.0 1.1 T rimmed Mean Estimator CH ML MT RES SB−ML ZIP−ML Figure 6: T rimmed mean of the quadratic error for each estimator in each fold. (RES, MT, and CH), suggesting the presence of outliers, that is, a few ob- serv ations that deviate from the mo del. Bet ween the lik eliho o d-based estimators, ZIP-ML, whic h does not include a non-parametric comp onen t, sho ws the w orse p erformance. The ML estima- tor is o v erly adaptiv e to the data, due to the flexibilit y offered b y k ernel-based estimators, whic h can b e a problem in the presence of extreme v alues in the data. The BS-ML estimator, whic h estimate the nonparametric comp onent via B-splines, seems to b e a sligh tly b etter option. On the other hand, b et w een the robust estimators, the predictions ob- tained using the PLZIP mo del with the MT and CH estimators proposed in this article, present smaller errors than the predictions made using the ZIP mo del with RES estimators. This suggests that, in addition to preferring the use of robust estimators, nonparametric mo deling of the age v ariable is more appropriate than linear mo deling. T able 6 rep orts the estimates of the regression parameters β and γ ob- tained under the different estimation pro cedures. Several remarks can b e made. First, the signs and magnitudes of the co efficients are generally con- sisten t across metho ds. Regarding the estimates of β , income ( x 1 ) sho ws a negativ e effect, indicating that higher so cio economic status is asso ciated with few er absen t da ys due to illness. Gender ( x 2 ) generally shows a p ositiv e effect (except for the ZIP-ML and ML estimators), suggesting that w omen 22 tend to rep ort more absents due to illness. The h ygiene index ( x 3 ) also has a p ositive co efficien t, indicating that p o orer h ygiene conditions increase the absen ts. On the other hand, the estimators of γ show similar patterns across all methods: higher income ( x 1 ) increases the probability of b elonging to the lo w-risk group, while b eing female ( x 2 = 1 ), p o or household hygiene ( x 3 ), and age ( t ) decrease it. Figure 7 shows the estimates of m ( t ) for eac h partially linear metho d. It can b e seen that the likelihoo d-based estimates fluctuate but generally sho w an increasing trend in the effect of age on the resp onse. While the robust estimators show that the effect of age decreases until age 30 and then increases, remaining approximately constan t b etw een 50 and 60 y ears. This corrob orates the fact that age do es not ha ve a simple linear effect on the resp onse and suggests including m ( t ) as a nonparametric comp onent in the PLZIP sp ecification. This allows the age effect to v ary flexibly across groups, explaining the b etter p erformance of the robust partially linear estimators observ ed in the cross-v alidation study . ZIP-ML ML SB-ML RES MT CH β 0 1.633 - - 1.393 - - β 1 -0.017 -0.008 -0.017 -0.018 -0.27 -0.302 β 2 -0.009 -0.002 0.05 0.048 0.167 0.176 β 3 0.013 0.015 0.016 0.019 0.003 0.006 β 4 0.098 - - 0.084 - - γ 0 1.606 1.606 1.604 1.592 1.546 1.549 γ 1 0.04 0.041 0.04 0.04 0.075 0.075 γ 2 -0.396 -0.396 -0.394 -0.393 -0.371 - 0.372 γ 3 -0.048 -0.048 -0.048 -0.047 -0.048 - 0.047 γ 4 -0.109 -0.11 -0.11 -0.106 -0.098 - 0.096 T able 1: β and γ estimates. This preliminary analysis shows th at the use of partially linear mo dels in a context of zero-inflated data, combined with robust estimation, b ecomes a p o w erful predictiv e to ol in the face of the p ossible presence of extreme v alues and complex relationships b et w een v ariables. 23 1.00 1.25 1.50 1.75 20 30 40 50 60 t Estimator BS−ML CH ML MT Figure 7: m ( t ) estimates using public health survey data. 7. Conclusions This study introduced an estimation pro cedure for the PLZIP regression mo del that allo ws obtaining robust estimators. The ML estimators of the parameters β and the nonparametric function m are susceptible to the presence of outliers in the resp onse v ariable. Sim- ilarly , the ML estimator of the parameter γ exhibits notable sensitivity to false zeros and extreme v alues in the cov ariates, resulting in po or p erformance under con tamination. In con trast, the robust CH and MT estimators demon- strated resistance to contamination in b oth the resp onse and cov ariates. Both estimators sho w ed similar performance, with the MT estimator slightly out- p erforming the CH in all simulation sc hemes. In non-con tamination schemes, b oth robust estimators maintained comparable p erformance to the likelihoo d- based estimators. The application of robust estimators in the analysis of real-w orld public health data reaffirmed their predictiv e sup eriorit y ov er those based on the lik eliho o d. The robustly estimated mo dels exhibited low er prediction errors, suggesting the presence of outliers or sligh t deviations from mo del assump- tions in the data. F urthermore, the results indicated that nonparametric age 24 mo deling is more appropriate than a linear approach, highligh ting the im- p ortance of the PLZIP mo del structure in capturing complex and nonlinear relationships. It is w orth men tioning that the estimation pro cedure dev elop ed in this ar- ticle can be naturally extended to the doubly semiparametric framework. In this setting, the logistic link function incorp orates a nonparametric comp o- nen t, relaxing the parametric assumptions and allo wing for greater mo deling flexibilit y . The implemen tation of this extension only requires adapting Step 1 of the pro cedure in the same wa y as for the estimation of β and m . This mo dification results in a more versatile to ol, applicable to a larger class of problems in complex data analysis scenarios. In conclusion, the robust estimation metho dology for the PLZIP mo del in tro duced in this w ork not only addresses the limitations of lik eliho o d-based metho ds in the presence of outliers but also offers a p ow erful and versatile predictiv e to ol. Therefore, the CH and MT estimators effectiv ely com bine robustness and efficiency , so their application in studies in volving PLZIP mo dels is highly recommended. A c knowledgemen ts This pap er has been supported b y the MA TH-AmSud in ternational grant 22MA TH-07. W e appreciate the support and funding pro vided by this ini- tiativ e, which has b een crucial in completing this work. App endix A. Pro of of Lemma 4.1 (a). Define R n, 1 ( η , β , τ | θ ) = ( nh n ) − 1 n X i =1 (1 − E θ ( w i | y i )) ρ ( y i , x i ⊤ β + η ) ω 1 ( x i ) K (( t i − τ ) /h n ) , R n, 0 ( τ ) = ( nh n ) − 1 n X j =1 K t j − τ h n 25 and Q n, 1 ( η , β , τ | θ ) = R n, 1 ( η , β , τ | θ ) /R n, 0 ( τ ) . Then, sup β ∈K η ∈ R || Q n, 1 ( η , β , ·| θ ) − Q 1 ( η , β , ·| θ ) || 0 , ∞ = sup β ∈K , η ∈ R || R n, 1 ( η , β , ·| θ ) − Q 1 ( η , β , ·| θ ) R n, 0 ( · ) || 0 , ∞ inf τ ∈T 0 R n, 0 ( τ ) − 1 ≤ sup β ∈K , η ∈ R || R n, 1 ( η , β , ·| θ ) − E 0 ( R n, 1 ( η , β , ·| θ )) || 0 , ∞ + sup β ∈K , η ∈ R || E 0 ( R n, 1 ( η , β , ·| θ )) − Q 1 ( η , β , ·| θ ) E 0 ( R n, 0 ( · )) || 0 , ∞ sup β ∈K , η ∈ R || Q 1 ( η , β , ·| θ ) || 0 , ∞ || R n, 0 ( · ) − E 0 ( R n, 0 ( · )) || 0 , ∞ inf τ ∈T 0 R n, 0 ( τ ) − 1 . C4 implies that E 0 ( R 0 ( t )) = R K ( u ) f T ( t − uh n ) du > A 1 ( T δ ) . Therefore it is enough to pro ve the following con v ergences: (A) sup β ∈K , η ∈ R || R n, 1 ( η , β , ·| θ ) − E 0 ( R n, 1 ( η , β , ·| θ )) || 0 , ∞ a.s. − → 0 , (B) sup β ∈K , η ∈ R || E 0 ( R n, 1 ( η , β , ·| θ )) − Q 1 ( η , β , ·| θ ) E 0 ( R n, 0 ( · )) || 0 , ∞ a.s. − → 0 , (C) sup β ∈K , η ∈ R || Q 1 ( η , β , ·| θ ) || 0 , ∞ || R n, 0 ( · ) − E 0 ( R n, 0 ( · )) || 0 , ∞ a.s. − → 0 . T o pro ve (A), Theorem 37 of [12] is applied to the family of functions F n = n f n η , β ,τ ( y , x , t | θ ) = (1 − E θ ( w | y )) ρ ( y , x ⊤ β + η ) ω 1 ( x ) K (( t − τ ) /h n ) || ρ || ∞ || ω 1 || ∞ || K || ∞ , β ∈ K , η ∈ R , τ ∈ T 0 o , where || ρ || ∞ = sup y ,u | ρ ( y , u ) | , || ω 1 || ∞ = sup x | ω 1 ( x ) | y || K || ∞ = sup v | K ( v ) | . Note that F n dep ends on n through h n . T o ensure the conditions of the theorem, consider the family K n = k n τ ( t ) = K t − τ h n , τ ∈ T 0 , where K is a b ounded v ariation function on R satisfying K ≤ || K || ∞ . Then, b y Lemma 22 (ii) of [14], the graphs of functions in K n ha ve p olynomial discrimination. Therefore, b y Lemma 25 of [12], there are real v alues A 1 and W 1 (dep ending only on the discriminant p olynomial) suc h that for any 0 < ε < 1 and probabilit y measure Q , N ( ε || K || ∞ , K n , L 1 ( Q )) ≤ A 1 ε − W 1 . 26 So, there are constants A 2 and W 2 suc h that sup Q N ( F n || K || ∞ , ε, L 1 ( Q )) < A 2 ε − W 2 for all 0 < ε < 1 . In addition, since | 1 − E θ ( w i | y i ) | < 1 , | f n η , β ,τ | < 1 for all f n η , β ,τ ∈ F n . F urthermore, E 0 (( f n η , β ,τ ( y , x , t | θ ))) 2 ≤ E 0 ( f n η , β ,τ ( y , x , t | θ ))) = E 0 (1 − E θ ( w | y )) ρ ( y , x ⊤ β + η ) ω 1 ( x ) K (( t − τ ) /h n ) || ρ || ∞ || ω 1 || ∞ || K || ∞ ≤ E 0 K (( t − τ ) /h n ) || K || ∞ = 1 || K || ∞ Z K t − τ h n f T ( t ) dt ( l = ( t − τ ) /h n ) = h n || K || ∞ Z K ( l ) f T ( l h n + τ ) dl ≤ h n || f T || ∞ || K || ∞ Z K ( l ) dl = h n || f T || ∞ || K || − 1 ∞ . = δ 2 n . T aking α n = 1 , nδ 2 n α 2 n >> log( n ) , sup F n 1 n n X i =1 f n η , β ,τ ( y i , x i , t i | θ )) − E 0 ( f n η , β ,τ ( y , x , t | θ ))) << δ 2 n α n c.s. , it means that 1 || f T || ∞ || ρ || ∞ || ω 1 || ∞ sup β ∈K , η ∈ R || R n, 1 ( η , β , ·| θ )) − E 0 ( R n, 1 ( η , β , ·| θ ))) || 0 , ∞ a.s. − → 0 , and the first factor is finite, so (A) is pro ven. T o pro ve (B), note that | E 0 ( R n, 1 ( η , β , τ | θ ))) − Q 1 ( η , β , τ | θ )) E 0 ( R n, 0 ( τ )) | = h − 1 n Z Q 1 ( η , β , t | θ )) K t − τ h n f T ( t ) dt − Z Q 1 ( η , β , τ | θ )) K t − τ h n f T ( t ) dt = Z ( Q 1 ( η , β , l h n + τ | θ )) − Q 1 ( η , β , τ | θ ))) K ( l ) f T ( l h n + τ ) dl ≤ || f T || ∞ Z Q 1 ( η , β , l h n + τ | θ )) − Q 1 ( η , β , τ | θ )) K ( l ) dl. 27 The fact that h n → 0 and the condition C5 imply that sup β ∈K , η ∈ R || E 0 ( R n, 1 ( η , β , ·| θ ))) − Q 1 ( η , β , ·| θ )) E 0 ( R n, 0 ( · )) || 0 , ∞ → 0 . T o pro ve (C) it is enough to show that || R n, 0 ( · ) − E 0 ( R n, 0 ( · )) || 0 , ∞ a.s. − → 0 . Since | 1 − E θ ( w | y ) | < 1 , sup β ∈K , η ∈ R || Q 1 ( η , β , ·| θ ) || 0 , ∞ ≤ || ρ || ∞ || ω 1 || ∞ , with ρ and ω 1 b ounded. The h yp othesis of Theorem 37 of [12] are v erified for the family K n . Indeed, without loss of generalit y , if the kernel function is b ounded by 1 Z K (( t − τ ) /h n ) 2 f T ( t ) dt ≤ Z K (( t − τ ) /h n ) f T ( t ) dt = h n Z K ( l ) f T ( l h n + τ ) dl ≤ h n || f T || ∞ , and taking α n = 1 , b y hypothesis nδ 2 n α 2 n >> log( n ) . Th us, sup K n 1 n n X i =1 K (( t i − τ ) /h n ) − E 0 ( K (( t − τ ) /h n )) << || f T || ∞ h n a.s., and then sup K n | R n, 0 ( τ ) − E 0 ( R n, 0 ( τ )) | a.s. − → 0 , whic h concluded the pro of of (a). ■ Pro of of Theorem 4.1. T o pro ve (a), note that sup β ∈ R p | Q n, 2 ( ˜ m, β | θ ) − Q 2 ( m 0 , β | θ ) | ≤ sup β ∈ R p | Q n, 2 ( ˜ m, β | θ ) − Q n, 2 ( m 0 , β | θ ) | + sup β ∈ R p | Q n, 2 ( m 0 , β | θ ) − Q 2 ( m 0 , β | θ ) | . So, it is enough to sho w the conv ergences 28 (A) sup β ∈ R p | Q n, 2 ( ˜ m, β | θ ) − Q n, 2 ( m 0 , β | θ ) | a.s. − → 0 , (B) sup β ∈ R p | Q n, 2 ( m 0 , β | θ ) − Q 2 ( m 0 , β | θ ) | a.s. − → 0 . Let T 0 ∈ T b e a compact set suc h that P ( t i / ∈ T 0 ) < ε , the first-order T aylor expansion of ρ around x ⊤ i β + m 0 ( t i ) for eac h i = 1 , . . . , n implies that sup β ∈ R p | Q n, 2 ( ˜ m, β | θ ) − Q n, 2 ( m 0 , β | θ ) | ≤ sup β ∈ R p 1 n n X i =1 | Ψ( y i , u i ) || ˜ m ( t i ) − m 0 ( t i ) || ω 1 ( x i ) |I ( t i ∈ T 0 ) + sup β ∈ R p 1 n n X i =1 | ρ ( y i , x ⊤ i β + ˜ m ( t i )) | + | ρ ( y i , x ⊤ i β + m 0 ( t i )) | | ω 1 ( x i ) |I ( t i / ∈ T 0 ) ≤ || Ψ || ∞ || ˜ m − m 0 || 0 , ∞ || ω 2 || ∞ + 2 || ρ || ∞ || ω 2 || ∞ 1 n n X i =1 I ( t i / ∈ T 0 ) , where u i ∈ ( x ⊤ i β + ˜ m ( t i ) , x ⊤ i β + m 0 ( t i )) ∀ i = 1 , . . . , n . Since Ψ and ω 2 are b ounded, and || ˜ m − m 0 || 0 , ∞ a.s. − → 0 in T 0 , the first term tends to 0 a.s. Concerning the second term, since ρ is b ounded and E ( I ( t i / ∈ T 0 )) = P ( t i / ∈ T 0 ) < ε the Strong Law of Large Num b ers implies that the second term tends to 0 a.s. On the other hand, the h yp othesis o ver the co v ering n um b er of H , the fact that the functions in H hav e the uniform b ound || ρ || ∞ || ω 1 || ∞ and Theorem 24 of [12] ensure that (B) holds, whic h concludes the pro of of (a). T o pro ve (b), let b β k b e a con vergen t sequence of b β with limit β ∗ . Supp ose without loss of generalit y that b β a.s. − → β ∗ . If || β ∗ || < ∞ , from (a) Q n, 2 ( b m, β 0 | θ ) − Q 2 ( m 0 , β 0 | θ ) a.s. − → 0 . Moreov er, from the con tinuit y of Q 2 , Q n, 2 ( ˜ m, b β | θ ) − Q 2 ( m 0 , β ∗ | θ ) a.s. − → 0 , indeed | Q n, 2 ( ˜ m, b β | θ ) − Q 2 ( m 0 , β ∗ | θ ) | ≤ | Q n, 2 ( ˜ m, b β | θ ) − Q 2 ( m 0 , b β | θ ) | + | Q 2 ( m 0 , b β | θ ) − Q 2 ( m 0 , β ∗ | θ ) | . The first term tends to 0 a.s. b y (a). Regarding the second term, the first- 29 order T a ylor expansion of ρ around x ⊤ β ∗ + m 0 ( t ) implies that | Q 2 ( m 0 , b β | θ ) − Q 2 ( m 0 , β ∗ | θ ) | ≤ E 0 | 1 − E θ ( w | y ) || ρ ( y , x ⊤ b β + m 0 ( t )) − ρ ( y , x ⊤ β ∗ + m 0 ( t )) || ω 1 ( x ) | ≤ E 0 | Ψ( y , u ) || x ⊤ ( b β − β ∗ ) || ω 1 ( x ) | ≤ || Ψ || ∞ E 0 || x ⊤ || || b β − β ∗ |||| ω 1 || ∞ , where u ∈ ( x ⊤ b β + η , x ⊤ β ∗ + η ) , Ψ and ω 1 are bounded functions, x has finite second momen t, and b β a.s. − → β ∗ . Therefore Q 2 ( m 0 , b β | θ ) − Q 2 ( m 0 , β ∗ | θ ) a.s. − → 0 , whic h implies Q n, 2 ( ˜ m, b β | θ ) − Q 2 ( m 0 , β ∗ | θ ) a.s. − → 0 . Note that Q n, 2 ( ˜ m, b β | θ ) ≤ Q n, 2 ( ˜ m, β 0 | θ ) , since b β = argmin β ∈ R p Q n, 2 ( ˜ m, β | θ ) . Then, taking a.s. limit Q 2 ( m 0 , β ∗ | θ ) ≤ Q 2 ( m 0 , β 0 | θ ) , but ( β 0 , m 0 ) is the only minim um of Q 2 , so it m ust b e β ∗ = β 0 . If || β ∗ || = ∞ , by (a) and the contin uit y of Q 2 , Q n, 2 ( ˜ m, β 0 | θ ) − Q 2 ( m 0 , β 0 | θ ) a.s. − → 0 and Q n, 2 ( ˜ m, b β | θ ) − Q 2 ( m 0 , β ∗ | θ ) a.s. − → 0 . Moreov er, Q n, 2 ( ˜ m, b β | θ ) ≤ Q n, 2 ( ˜ m, β 0 | θ ) . Hence 0 ≥ Q n, 2 ( ˜ m, b β | θ ) − Q n, 2 ( ˜ m, β 0 | θ ) ≥ Q n, 2 ( ˜ m, b β | θ ) − Q 2 ( m 0 , β ∗ | θ ) − ( Q n, 2 ( ˜ m, β 0 | θ ) − Q 2 ( m 0 , β 0 | θ )) + Q 2 ( m 0 , β ∗ | θ ) − Q 2 ( m 0 , β 0 | θ ) . T aking a.s. limit, lim || β ||→∞ Q 2 ( m 0 , β | θ ) ≥ Q 2 ( m 0 , β 0 | θ ) , whic h, by hypothesis, is absurd. Therefore it m ust b e || β ∗ || < ∞ . ■ References [1] D. Lambert, Zero-inflated p oisson regression, with an application to defects in man ufacturing, T echnometrics 34 (1) (1992) 1–14. doi:10.2307/1269547. [2] K. F. Lam, H. Xue, Y. B. Cheung, Semiparametric analysis of zero-inflated count data, Biometrics 62 (4) (2006) 996–1003. doi:10.1111/j.1541-0420.2006.00575.x. 30 [3] X. He, H. Xue, N. Z. Shi, Sieve maximum likelihoo d estimation for dou- bly semiparametric zero-inflated p oisson models, Journal of Multiv ariate Analysis 101 (9) (2010) 2026–2038. doi:10.1016/j.jm v a.2010.05.003. [4] X. W ang, J. Zhang, L. Y u, G. Yin, Generalized partially linear single- index mo del for zero-inflated coun t data, Statistics in Medicine 34 (4) (2015) 876–886. doi:10.1002/sim.6382. [5] P . J. Hub er, Robust estimation of a lo cation parameter, The Annals of Mathematical Statistics 35 (1) (1964) 73–101. doi:10.1214/aoms/1177703732. [6] D. Hall, J. Shen, Robust estimation for zero-inflated p oisson re- gression, Scandina vian Journal of Statistics 37 (2) (2010) 237–252. doi:10.1111/j.1467-9469.2009.00657.x. [7] G. Bo en te, X. He, J. Zhou, Robust estimates in generalized par- tially linear mo dels, The Annals of Statistics 34 (6) (2006) 2856–2878. doi:10.1214/009053606000000858. [8] G. Bo en te, D. Ro driguez, Robust inference in generalized partially lin- ear models, Computational Statistics and Data Analysis 54 (12) (2010) 2942–2966. doi:10.1016/j.csda.2010.05.025. [9] J. G. Stanisw alis, The kernel estimate of a regression function in lik eliho o d-based mo dels, J ournal of the American Statistical Asso cia- tion 84 (405) (1989) 276–283. doi:10.1080/01621459.1989.10478766. [10] T. A. Severini, J. G. Staniswalis, Quasi-lik eliho o d estimation in semi- parametric mo dels, Journal of the American Statistical Asso ciation 89 (426) (1994) 501–511. doi:10.1080/01621459.1994.10476774. [11] O. Rosen, W. Jiang, M. A. T anner, Mixtures of marginal mo dels, Biometrik a 87 (2) (2000) 391–404. doi:10.1093/biomet/87.2.391. [12] D. Pollard, Conv ergence of sto c hastic pro cesses, Springer, New Y ork ; Berlin ; T oky o, 1984. [13] R. J. Carroll, J. F an, I. Gijb els, M. P . W and, Generalized partially lin- ear single-index mo dels, Journal of the American Statistical Asso ciation 92 (438) (1997) 477–489. doi:10.1080/01621459.1997.10474001. 31 [14] D. Nolan, D. P ollard, U-pro cesses: Rates of conv ergence, The Annals of Statistics 15 (2) (1987) 780–799. doi:10.1214/aos/1176350374. [15] P . J. Huber, The b ehavior of maxim um lik eliho o d estimates under non- standard conditions, Pro ceedings of the 5th Berk eley Symp osium on Mathematical Statistics and Probabilit y 1 (1967) 221–223. [16] C. Croux, G. Haesbro ec k, Implemen ting the bianco and y ohai estimator for logistic regression, Computational Statistics & Data Analysis 44 (1) (2002) 273–295. doi:10.1016/S0167-9473(03)00042-2. [17] A. M. Bianco, V. J. Y ohai, Robust estimation in the logistic regression mo del, Computational Statistics & Data Analysis 22 (2) (1996) 193–204. doi:10.1016/S0378-3758(00)00312-8. [18] V. V aldora, V. J. Y ohai, Robust estimators for generalized linear mo d- els, Journal of Statistical Planning and Inference 146 (2014) 31–48. doi:10.1016/j.jspi.2013.09.016. [19] E. F rank en b erg, D. Thomas, The Indonesian F amily Life Survey: Study Design and Results from W av es 1 and 2., RAND, Santa Monica, Cali- fornia, 2000. 32
Original Paper
Loading high-quality paper...
Comments & Academic Discussion
Loading comments...
Leave a Comment