Confidence Distributions and Related Themes
This is the guest editors' general introduction to a Special Issue of the Journal of Statistical Planning and Inference, dedicated to confidence distributions and related themes. Confidence distributions (CDs) are distributions for parameters of inte…
Authors: Nils Lid Hjort, Tore Schweder
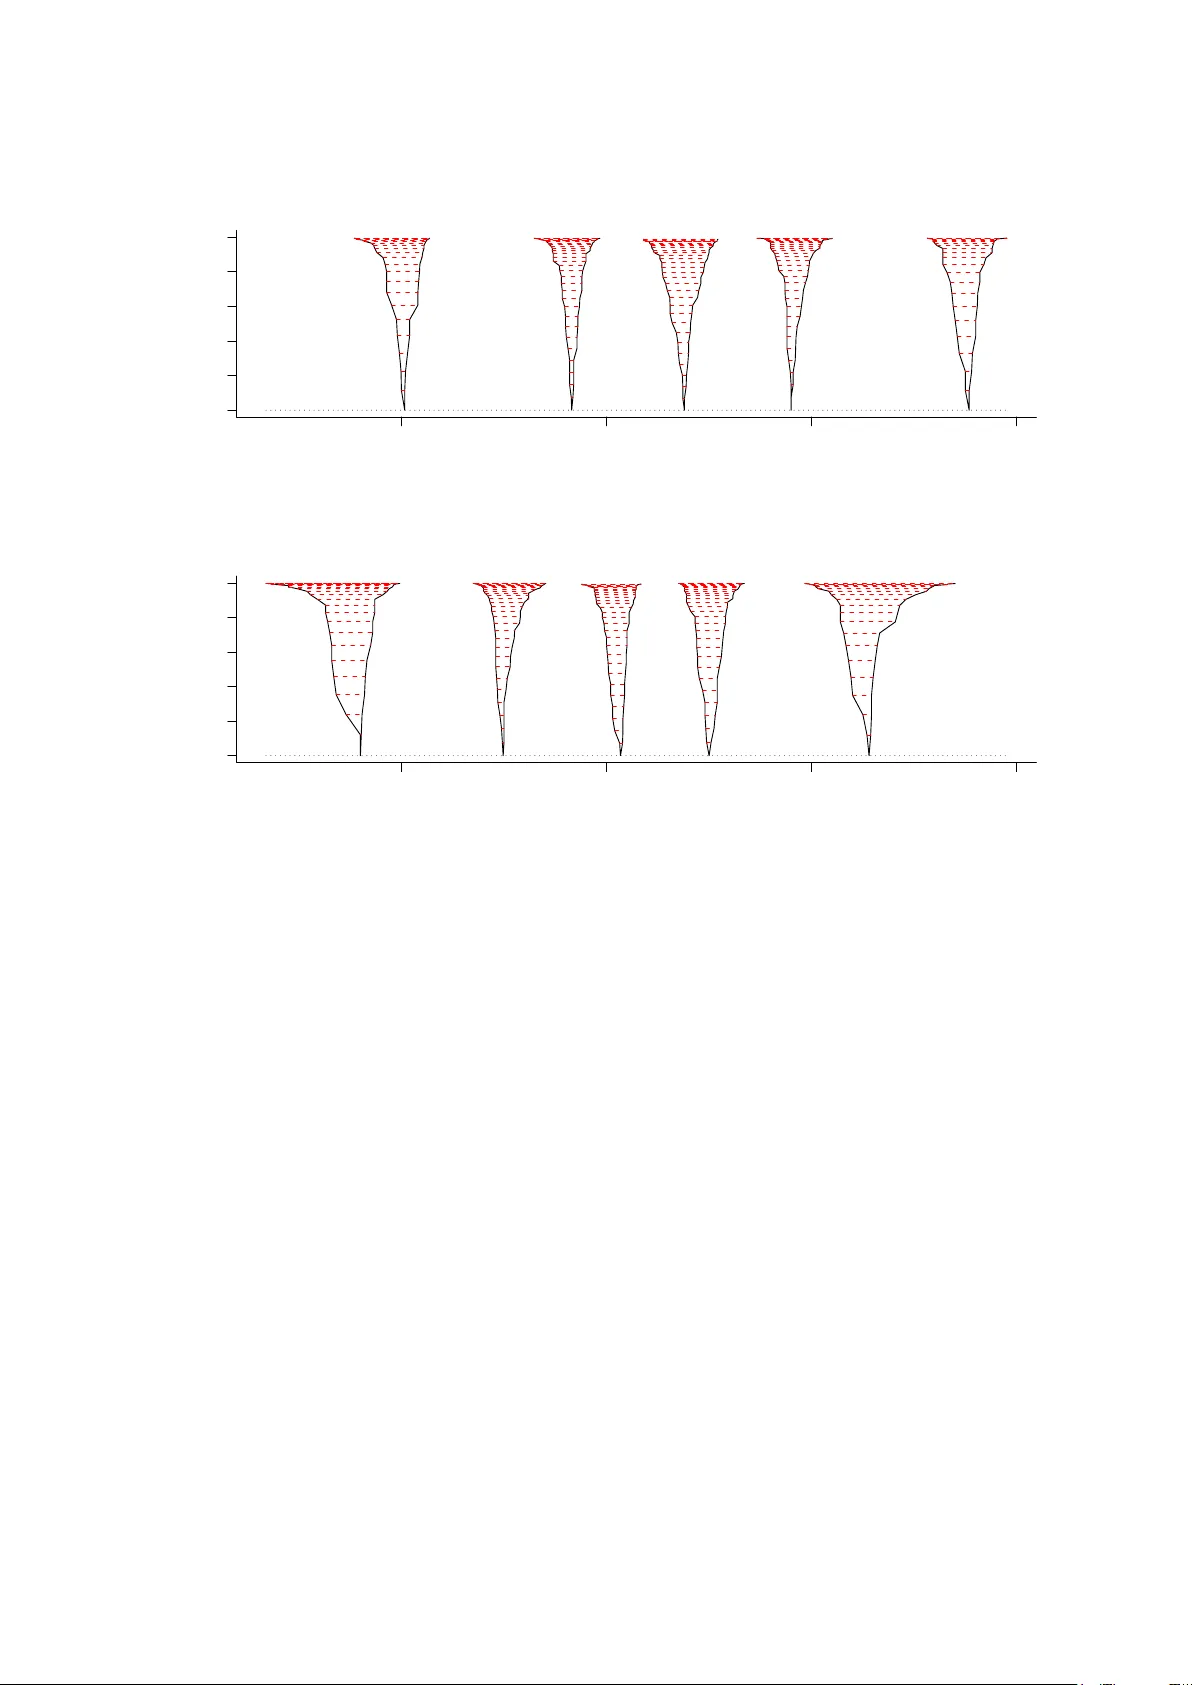
CONFIDENCE DISTRIBUTIONS AND RELA TED THEMES Nils Lid Hjort 1 and T ore Sc h w eder 2 1 Departmen t of Mathematics and 2 Departmen t of Economics Univ ersit y of Oslo Abstract . This is the guest editors’ general in tro duction to a Sp ecial Issue of the Journal of Statistical Planning and Inference, dedicated to confidence dis- tributions and related themes. Confidence distributions (CDs) are distributions for parameters of in terest, constructed via a statistical model after analysing the data. As suc h they serve the same purp ose for the frequen tist statisticians as the p osterior distributions for the Ba y esians. There ha v e b een sev eral attempts in the literature to put up a clear theory for such confidence distributions, from Fisher’s fiducial inference and on w ards. There are certain obstacles and difficul- ties inv olv ed in these attempts, both conceptually and op erationally , whic h hav e con tributed to the CDs being slow in en tering statistical mainstream. Recently there is a renewed surge of interest in CDs and v arious related themes, how ev er, reflected in b oth series of new metho dological research, adv anced applications to substan tiv e sciences, and dissemination and communication via w orkshops and conferences. The present sp ecial issue of the JSPI is a collection of papers ema- nating from the Infer enc e With Confidenc e workshop in Oslo, May 2015. Several of the pap ers app earing here were first presen ted at that workshop. The presen t collection includes ho w ev er also new research pap ers from other sc holars in the field. Key wor ds: confidence curv es, confidence distributions, fo cus para meters, lik eliho o d, meta-analysis, probabi lit y The Journal of Statisti cal Planning and Inference d ecided in the autumn of 2015 to arrange for a Sp ecial Issue on confidence distribution and related themes. After v arious efforts, by patient authors, referees, and colleagues, along with the customary revision pro cesses, this has resulted in the curren t collection of eleven journal articles: 1 Cunen et al. (2017a), on CDs and confidence curv es for c hange p oin ts, with applications to mediaev al literature and to fisheri es sciences; 2 De Blasi & Sch weder (2017), on median bias corrections for fine-tuning CDs; 3 Gr ¨ un w ald (2017), on safe probabilit y , leading also to to ols for predictions; 4 Hannig et al. (2017), on fusion learning and in ter-laboratory analyses; 5 Lewis (2017), on combining inferences, with application to climate statistics; Date : June 2017. 1 2 CDS AND RELA TED THEMES 6 Lindqvist & T araldsen (2017), on proper uses of improper distributions; 7 Martin (2017), on generalised inference mo dels; 8 Sc hw eder (2017), with an essa y on epistemic probabilit y; 9 Shen et al. (2017), on CDs for predictions, in differen t setups; 10 T araldsen & Lindqvist (2017), on condi tional fiducial models; and 11 V eronese & Melilli (2017), on CDs and their connections to ob jectiv e Bay es. These pap ers deal with theory and applications for distributional statistical infer- ence, with CDs and fiducial distributions b eing the cen tral concepts. Quite a few con tributions also touc h Ba y esian angles and connections, how ever (Cunen et al. (2017a), Gr ¨ un w ald (2017), Lewis (2017), Lindqvist & T araldsen (2017), T araldsen & Lindqvist (2017), V eronese & Melilli (2017)). In the present general in tro duc- tion to the Sp ecial Issue, by the guest editors, efforts are made b oth to explain to the broader statistical audience what confidence distributions (CDs) and confidence curv es are; why and ho w they are steadily b ecoming more popular, in statistical theory and practice; and to briefly place the elev en papers in a broader context. In our article, whic h is b y itself a gen tle introduction to the general CD themes, w e also attempt to p oin t to aspects and issues and t ypes of application not already con tained in the review pap er Xie & Singh (2013) and ensuing discussion. 1. The Hol y Grail: frequentist posterior distributions Supp ose data are analysed via some mo del, and that ψ is a parameter of par- ticular in terest. Statisticians ha v e many methods in their to olb o xes for conducting inference for ψ , suc h as reac hing a point estimate, assessing its precision, setting up tests, along with p-v alues when of relev ance, finding confidence interv als, comparing the ψ with other parameters from other studies, etc. F or the frequen tist, co nstructing a distribution for ψ , giv en the a v ailable information, is more probl ematic, ho w ev er, also conceptually . Someho w it app ears to b e a strict Ba y esian privilege to arrive at an appropriate p osterior distribution, say p ( ψ | data) – along with the asso ciated difficulties of car- rying out Bay esian w ork in the first place, in v olving elicitation of prior distributions and combinin g these with probabilit y distributions of a differen t kind. W orking out a p ( ψ | data) in the frequen tist framew ork app ears to clash with the basic premise that the parameter v ector of the model is a fixed but unkno wn p oin t in the param- eter space. This has not stopp ed sc holars from attempting precisely such a feat, called the Holy Grail of parametric statistics by Brad Efron (Efron, 2010). The earliest attempts were b y none other than Sir Ronald Fisher, in a series of pap ers in the 1930ies (Fisher , 1930, 1932, 1933, 1935). Certain obstacles and difficultie s w ere found and p oin ted to by a n umber of critical sc holars, how ever, and Fisher did not CDS AND RELA TED THEMES 3 quite manage to defend his notion of a fiducial distribution for parameters. Indeed the fiducial ideas ha v e b een referred to as ‘Fisher’s biggest blunder’; see Sc h w eder & Hjort (2016, Ch. 6) for an accoun t of the historical dev elopmen t, and also Gr ¨ un w ald (2017, this issue) . There are how ev er othe r and partly related notions of ho w to reac h prop er frequen tist p osterior distributions, without priors, and the collective lab els for a fair p ortion of these refined and mo dernised constructions are c onfidenc e distributions (CDs) and c onfidenc e curves . There is a clear surge of in terest in these metho ds and in v arious related themes, regarding b oth theory and applications. This is witnessed in b o oks and journal articles and by applied adv anced w ork, and is also reflected in high-lev el w orkshops and conferences. The BFF: Bayes, F r e quentist, Fiducial series of conferences (also ref erred to as ‘Best F riends F orev er’) is reac hing a steadily wider audience, with the curren t list b eing Shanghai (2014, 2015), Rutgers, New Jersey (2016), Harv ard, Massac h usetts (2017), Ann Arb or, Mic higan (2018), and Duk e and SAMSI, North Carolina (2019). There are also sp ecial invited sessions at ma jor conferences, etc., dedicated to CDs and BFF themes. Efron (1998) sp eculates that Fisher’s (alleged) biggest blunder migh t turn into a big hit for the 21st century; see also Efron & Hastie (2016, Ch. 11). The presen t sp ecial issue of the JSPI is dedicated to suc h CDs and the growing list of related topics. The collection of pap ers and the ensuing organisa tion of the sp ecial issue hav e gro wn out of one of these conferences, the Infer enc e With Confi- denc e workshop in Oslo in May 2015, organised by the the research group F o cuStat: F o cus Driven Statistic al Infer enc e With Complex Data . Some of the papers appear- ing in this issue w ere first presen ted as invited lectures at this workshop. W e ha v e also recruited con tributions from other sc holars in the field, ho w ev er, in an attempt to exhibit and see discussed a decen t range of the more crucial dimensions of CDs and their increasing scop e and usefulness, in methodological and applied statistical w ork. “The three revo lutions in parametric statistical inference are due to Laplace (1774), Gauss and Laplace (1809–1811) and Fisher (1922)” , is the clear op ening statemen t in the t wo b o oks Hald (1998, 2006). Somewhat b oldly , Sch weder & Hjort (2016, Preface) claim there is an ongoing fourth revolution in statistics, at the start of the curren t millennium. This fourth revol ution has p erhaps a less clear fo cus than the three drastic methodological c hanges Hald describ es, and is arguably more ab out the who and what than about the how , but w e argue there that CDs and confidence curv es ha v e a natural place in the w orld of statistical co mputation an d comm unication, also with Big Data. “I wish I’d seen a confidence curv e earlier” , as t w eeted J.M. White, who manages a branch of F aceb o ok’s Core Data Science team, in April 2017. W e 4 CDS AND RELA TED THEMES should also make clear that there by necessit y are several approac hes (partly related and partly comp eting) to the alleged Holy Grail of reaching posteriors without priors. In addition to the CD theory exp ounded in Sch w eder & Hjort (2002, 2003, 2016); Xie & Singh (2013), with ro ots all the wa y back to Fisher in the 1930ies, there is generalised fiducial inference, see Hannig et al. (2016) and Hannig et al. (2017, this issue), along with Lindqvist & T araldsen (2017, this issue) and T araldsen & Lindqvist (2017, this issue); as wel l as the theory of inferential mo dels, cf. Martin & Liu (2015) and Martin (2017, this issue). There is b ound to b e y et other h ybrids and connections, and some of these are touc hed up on in the presen t collection of journal articles. 2. Wha t are confidence distributions and confidence cur ves? There are sev eral wa ys in which to motiv ate, define and construct such CDs, along with associated concepts and functions. Supp ose the mo del for the data y is go v erned by a parameter vector θ , and that the in terest parameter ψ is a function ψ ( θ ) of the mo del parameter. A mo dern definition of a c onfidenc e curve for ψ , say cc( ψ , y ), see Sch weder & Hjort (2002, 2016); Xie & Singh (2013), is as follo ws. W e write Y for the random outcome of the data generating mec hanism and y obs for the actually observ ed data. A t the true parameter p oin t ψ 0 = ψ ( θ 0 ), the random v ariable cc( ψ 0 , Y ) should hav e a uniform distribution on the unit in terv al. Then P θ 0 { cc( ψ 0 , Y ) ≤ α } = α for all α. (2.1) Th us confidence int erv als, and more generally confidence regions, can b e read off, at each desired level; the 90% confidence region is { ψ : cc( ψ , y obs ) ≤ 0 . 90 } , etc. When α tends to zero the confidence region t ypically tends to a single point, sa y b ψ , an estimator of ψ . In regular cases the cc( ψ , y ) is decreasing to the left of b ψ and increasing to the righ t, in whic h case the confidence curv e cc( ψ , y ) can b e uniquely link ed to a full confidence distribution C ( ψ , y ), via cc( ψ , y ) = | 1 − 2 C ( ψ , y ) | = 1 − 2 C ( ψ , y ) if ψ ≤ b ψ , 2 C ( ψ , y ) − 1 if ψ ≥ b ψ . (2.2) The confidence name giv en to these p ost-data summaries for fo cus parame- ters stems from the in timate connection to the familiar confidence in terv als. With C ( ψ , y ) a CD, [ C − 1 (0 . 05 , y obs ) , C − 1 (0 . 95 , y obs )] b ecomes an equi-tailed 90% confi- dence in terv al, etc. Also, solving cc( ψ , y obs ) = 0 . 90 yields t w o cut-off p oints for ψ , precisely those of the 90% confide nce in terv al. Corresp ondingly one ma y start with a given set of nested confidence in terv als, for all lev els α , and conv ert these in to, precisely , a CD. CDS AND RELA TED THEMES 5 3. General recipes Supp ose a mo del with parameter vector θ is used for data y and again that ψ = ψ ( θ ) is a fo cus parameter . If piv ( ψ , y ) is a function monotone increasing in ψ , with a distribution not dep ending on the underlying param eter, w e term it a piv ot. Th us K ( x ) = P θ { piv( ψ , Y ) ≤ x } do es not depend on θ , or on ψ , whic h implies that C ( ψ , y ) = K (piv ( ψ , y )) is a CD. The classical construction of this type is that of Studen t (1908), namely t = µ − ¯ y s/ √ n for a normal sample, with ¯ y and s denoting the sample mean and empirical standar d deviation. The ensuing CD for µ b ecomes C ( µ, data) = F ν ( √ n ( µ − ¯ y ) /s ) , with F ν the cum ulativ e distribution function of a t distribution with the relev ant degrees of freedom. In v arious classical setups for parametric mo dels, there are w ell-workin g large- sample appro ximations for the the b eha viour of estimators, deviance functions, etc., and these lead to construction s of CDs and confidence curv es. First, if b ψ is such that √ n ( b ψ − ψ ) → d N(0 , τ 2 ), and b τ is a consisten t estimator for the τ in question, then √ n ( b ψ − ψ ) / b τ → d N(0 , 1). W riting C n ( ψ , D n ) = Φ( √ n ( ψ − b ψ ) / b τ ) , (3.1) therefore, with D n the data a v ailable after n observ ations, w e hav e C n ( ψ , D n ) → d unif ; in particular, the C n ( ψ , D n ) is a symptotically a piv ot in the ab o v e sense. Hence suc h a C n ( ψ , D n, obs ) is a large-s ample v alid CD, allo wing us to write ψ | data ≈ d N( b ψ , b τ 2 /n ) , (3.2) in the CD sense. This is akin to a Ba yesian posterior distribution for ψ (but without an y notion of a prior distribution in volv ed). Also, the asso ciated confidence curve, asymptotically v alid, is cc( ψ , D n, obs ) = | 1 − 2 Φ( √ n ( ψ − b ψ obs ) / b τ obs ) | . These first-order large-sample appro ximations (3.1)–(3.2) are simple and useful but sometimes to o coarse. A recip e that typically w orks b etter is the follo wing. With ℓ n ( θ ) the log-likelihoo d function, let ℓ n, prof ( ψ ) = max { ℓ n ( θ ) : ψ ( θ ) = ψ } b e the profile, whic h we then turn in to the devian ce function dev n ( ψ ) = 2 { ℓ n, prof ( b ψ ) − ℓ n, prof ( ψ ) } . (3.3) 6 CDS AND RELA TED THEMES By the Wilks theorem (see e.g. Sc h w eder & Hjort (2016, Chs. 2-3)), under mild regu- larit y conditions dev n ( ψ 0 ) → d χ 2 1 , at the true v alue ψ 0 = ψ ( θ 0 ). Hence cc n ( ψ 0 , D n ) = Γ 1 (dev n ( ψ 0 )) → d unif , with Γ 1 ( · ) denoting the χ 2 1 distribution function , and cc n ( ψ , D n, obs ) = Γ 1 (dev n ( ψ )) (3.4) is our confidence curv e. It can reflect asymmetry and also likelihoo d multimodality in the unde rlying distrib utions, unlik e the simpler method of (3.1). Since a confidenc e curv e can b e deriv ed from a prop er CD, via (2.2), but not alw ays the other wa y around, the confidence curv e is arguably a more fundamen tal notion or concept than a CD. There is an extensiv e literature in probabilit y theory and statist ics regarding the man y w a ys of fine-tuning the distributional approximations asso ciated with the first- order normality result (3.1) and the Wilks theorem for (3.3). Key words for suc h metho ds include Bartletting, expansions, mo dified profiles, saddlepointing, b o ot- strap refinemen ts, prepiv oting, etc.; see e.g. Brazzale et al. (2007); Brazzale & Da vi- son (2008); Barndorff-Nielsen & Co x (1994). Man y of these methods ma y then b e w ork ed with further to yield fine-tuning instrumen ts for CDs and confidence curv es. Some of these translations, from the more traditional setup of assessing accuracy of a certain approximation , or how to correct for a t yp e of bias, are fairly straigh t- forw ard, leading to goo d CD recip es. Other suc h translations, inv olving p erhaps higher-lev el b o otstrapping or mo dified log-lik eliho o d op erations, are non-trivial. In- terestingly , some of the more in tricate pro cedures, lik e Barndorff-Nielsen’s ‘magic form ula’, ha v e relativ ely sp eaking easier cousins in the CD univ erse of things, and p oten tially with easier explanations; see Sc h w eder & Hjort (2016, Ch. 7) for discus- sion and illustr ations. A confidence curve analysis is often m uc h more informative than pro viding the protot ypical 95% in terv al or a p-v alue for an asso ciated hypothesis test. Figure 3.1 displa ys the confidence curv e cc( p ) for the probabilit y p that the world would see a 100 m sprin t race in a time of 9.72 seconds or faster, inside the calendar year 2008, with this question asked on Jan uary 1 that year. In other words, this is an attempt to quan tify ho w surprised we ought to hav e b een, when we learned that Usain Bolt had set his first w orld record, in May that y ear. W e ha v e used the general apparatus of extreme v alue theory to make suc h a question precise, taking as data the n = 195 races (which w e were able to trac k down from v arious sources) with a result time of 10.00 or b etter, in the course of the eight calendar years 2000–2007. Theory for extreme v alues leads to a certain parametric form for the b est races, in v olving parameters ( a, σ ) (and the mo del has b een shown to fit v ery well to the sprin t data). The cc( p ) giv en in the figure has come ab out by (i) expressing p as a function CDS AND RELA TED THEMES 7 0.00 0.05 0.10 0.15 0.20 0.25 0.0 0.2 0.4 0.6 0.8 1.0 probability of 9.72 in 2008 confidence Figure 3.1. Confidence curve for the probability p that there would b e a 100 m race of 9.72 or b etter, in the course of 2008, as seen from Januar y 1 that year. The p oint estimate is 0.034, and the 90% confidence in terv al is [0 , 0 . 189]. The dotted curv e is a fine-tuned version of (3.4), via Bartletting. of ( a, σ ), (ii) using the log-lik eliho o d function ℓ n ( a, σ ) to arriv e at the profile and deviance function for p ; and (iii) applying (3.4). T he p oint estimate is b p = 0 . 034, and a 90% confidence interv al, read off from the figure, is [0 , 0 . 189]. The natural sk ewness of the distributions in v olv ed mak es this a more appealing metho d than applying the traditio nal b p ± 1 . 645 b κ/ √ n , sa y . The dotted line in Figure 3.1 is what here comes out of using a fine-tuning v ersion of (3.4), namely Γ 1 (dev n ( p ) / (1 + b ε )), with 1 + b ε indicating a Bartlett correction for the distribution of dev n ( p ). In this particular case, 1 + b ε = 1 . 070, and the curv es are nearly identical. F or a fuller discussion and the required detail, see Sc hw eder & Hjort (2016, Section 7.4); see also De Blasi & Sc hw eder (2017, this issue), where a nov el correction metho d for fine-tuning of CDs is applied for this Bolt 2008 problem. 8 CDS AND RELA TED THEMES 4. Risk, performance, optimality, and testing Differen t wa ys of setting confidence interv als for the same parameter, and in deed more generally CDs, entail different p erformances. What is reasonably to b e under- sto o d b y ‘go o d p erformance’, for a confidence interv al or a CD, is less clear than for p oin t estimates or tests, where w e are used to assessing ro ot mean squared errors and p ow er curv es. Natural classes of loss functions ma y b e put forw ard, with the risk functions as usual defined as the exp ected v alues of these losses, as a function of the the p osition in the parameter space. Suc h themes are developed in Sc h weder & Hjort (2016, Chs. 5, 7, 8). This developmen t ma y b e seen as a natural extension of classical opti malit y theory , for testing and for point estimation, as with the bo dy of literature on Neyman–P earson testing, etc.; see e.g. Lehmann (1959); Lehmann & Romano (2005). Here w e are con tent to quote and then illustrate a certain optimalit y theorem, whic h in pa rticular can be put to use in m o dels of the classical exponential structure. Supp ose ψ is a fo cus parameter, and that the log-likelihoo d function for data can b e expressed in the form ℓ ( ψ , λ 1 , . . . , λ k ) = B ψ + k X j =1 A j λ j − c ( ψ , λ 1 , . . . , λ k ) + h ( D ) , with nui sance parameters λ 1 , . . . , λ k , with B and A 1 , . . . , A k functions of the data D , and appropriate functions c ( · ) and h ( · ). In that case, the CD C ∗ ( ψ , D ) = P ψ { B ≥ B obs | A 1 = A 1 , obs , . . . , A k = A k, obs } (4.1) enjo ys optimalit y prop erties with respect to a large class of loss functions for CDs; see Sc hw eder & Hjort (2016, Ch. 5). That this C ∗ ( ψ ) dep ends only on ψ , and not on the n uisance parameters, is part of the asso ciated theorems. T able 4.1. Lido caine data: Death rates for t w o groups of acute my o cardial in- farction patients, in six indep endent studies, with control group as- so ciated with ( m 0 , y 0 ) and lido caine treatmen t group with ( m 1 , y 1 ); from Normand (1999). See Figure 4.1. m 1 m 0 y 1 y 0 z 39 43 2 1 3 44 44 4 4 8 107 110 6 4 10 103 100 7 5 12 110 106 7 3 10 154 146 11 4 15 T o illustr ate this, consider T able 4.1, summarising the num b er of deaths y 0 and y 1 , with underlying sample sizes m 0 and m 1 , in k = 6 indep enden t studies, inv olving CDS AND RELA TED THEMES 9 acute my o cardial infarction patients. P atien ts in the treatmen t group, asso ciated with ( m 1 , y 1 ), receiv ed the drug lido caine; the con trol group, listed under ( m 0 , y 0 ), did not; see Normand (1999). These are binomial studies, and mo delling and analysis ma y pro ceed as in Sc h w eder & Hjort (2016, Ch. 14.6). Since the probabilities are small, w e choose a P oisson model for the presen t illustra tion. Our mo del tak es y j, 0 ∼ Pois( e j, 0 λ j, 0 ) and y j, 1 ∼ Pois( e j, 1 λ j, 1 ) , with λ j, 1 = γ λ j, 0 , (4.2) with exp osure n um b ers e j, 0 and e j, 1 prop ortional to sample sizes m j, 0 and m j, 1 , for j = 1 , . . . , k . Interest fo cuses on γ , whic h signals whether the drug use for these patien ts led to an increased death risk. The log-likeli ho o d for study j tak es the form ℓ j = − e j, 0 λ j, 0 + y j, 0 log λ j, 0 − e j, 1 λ j, 0 γ + y j, 1 (log λ j, 0 + log γ ) = y j, 1 log γ + z j log λ j, 0 − e j, 0 λ j, 0 − e j, 1 λ j, 0 γ , with z j = y j, 0 + y j, 1 . The optimalit y theorem applies, in volving the distribution of y j, 1 | z j , whic h is seen to be a binomial ( z j , e j, 1 γ / ( e j, 0 + e j, 1 γ )). The optimal CD for γ , based on study j alone, is hence C ∗ j ( γ , D j ) = 1 − B ( y j, 1 ; z j , e j, 1 γ / ( e j, 0 + e j, 1 γ )) + 1 2 b ( y j, 1 ; z j , e j, 1 γ / ( e j, 0 + e j, 1 γ )) , with D j signifying the data from source j , and with B ( · ; n, p ) and b ( · ; n, p ) denoting the cumulativ e and p oint distribution of a binomial ( n, p ). Here w e are using the b eneficial half-correction for discreteness, cf. Sc hw eder & Hjort (2016, Ch. 3.7). The k = 6 confidence curv es cc ∗ j ( γ , D j ) = | 1 − 2 C ∗ j ( γ , D j ) | for the risk inflation parameter γ coming out of this are seen in Figure 4.1 (the dashed curves). Also dis- pla y ed is the o v erall optimal confidence curv e for γ (the fatter, full curv e), emerging from studying the combined log-likel iho o d, ℓ = k X j =1 ℓ j = B log γ + k X j =1 z j log λ j, 0 − k X j =1 ( e j, 0 + e j, 1 γ ) λ j, 0 , with B = P k j =1 y j, 1 , and where our optimalit y theorem leads to C ∗ ( γ , D ) = P γ { B > B obs | z 1 = z 1 , obs , . . . , z k = z k, obs } + 1 2 P γ { B = B obs | z 1 = z 1 , obs , . . . , z k = z k, obs } , (4.3) with D denoting the full dataset. This is ev aluated n umerically b y sim ulating a large enough n umber of B , for eac h γ on a grid of suc h v alues, from the distribution of a sum of k binomials with differen t sets of parameters. The main in terest for the analysis of the lido caine dataset is the assessment of the risk inflation, if present, i.e. the degree to whic h the treatment for these patient s leads to increased risk of death. In our P oisson mo del (4.2), this is measured via the parameter γ . The perhaps most traditional statistical approac h is to test the null 10 CDS AND RELA TED THEMES 0 1 2 3 4 5 0.0 0.2 0.4 0.6 0.8 1.0 γ confidence curves Figure 4.1. The dashed lines are the confidence curves for the risk inflation pa- rameter γ from eac h of the six studies, from the model (4.2) with the lidocaine data of T able 4.1. The thic k black curv e is the opti- mal combined confidence curve, while the virtually identical dashed curv e is the com bined confide nce curve based on the II-CC-FF meth- o ds of Section 5, without using the Poisson mo del prop erties p er se. h yp othesis H 0 : γ ≤ 1 versus the alternative that γ > 1. As Figure 4.1 reveals, there is often more information in conducting a full confidence curv e analysis than in ex- ecuting a test with its traditional y es-or-no answer at a certain lev el of significance, lik e the ubiquitous 0.05. The cc ∗ ( γ , D ) rev eals not merely the o v erall p oint estimate 1.732, but the 0.95 in terv al [1 . 023 , 3 . 027], along with all other in terv als; also, the configram clearly reveals the relativ e influence of eac h of the k = 6 separate infor- mation sources. The p-v alue can also b e read off, from p = C ∗ (1 , D ), the epistemic confidence that γ ≤ 1; the v alue is 0.021. As another illustra tion of this general p oint, ab out how CD analyses and plots often conv ey more statistical inform ation than simple accept-or-reject answ ers from carrying out a test, consider Figure 4.2, with the left panel sho wing the increase in exp ected lifelength for wo men b orn in Norwa y (full curv e), Sw eden (dashed curv e), Denmark (dotted curve), for the y ears 1960, 1970, 1980, 1990, 2000, 2010, 2015, from the w ebsite worldlifeexpectan cy.com/history-of-life-expectancy . The gro wth in exp ected lifelength is amazingly linear, for this span of calendar time, and we view the data as three linear regressions, sa y y i,j = α i + β i x j + ε i,j for CDS AND RELA TED THEMES 11 coun tries i = 1 , 2 , 3 and calendar years x j represen ted by j = 1 , . . . , 7, and with error terms mo delled as indep enden t and ε i,j ∼ N(0 , σ 2 i ). W e may query whether the regression slope co efficient β is the same for the three Scandina vian coun tries. Rather than merely testing the hypothesis H 0 that β 1 = β 2 = β 3 , whic h w ould b e standard (the point estimates are 0.140, 0.162, 0.144, with considerable o verlap in their 0.95 confidence interv als), w e address the question b y modelling these three β co efficients as coming from a backgr ound N( β 0 , τ 2 ) model; hence H 0 is the same as τ = 0. Using metho ds of Sc h w eder & Hjort (2016, Ch. 13), we can derive and compute full CDs C ( τ , D ) for the spread parameter, displa y ed in the righ t panel. F or the three male regressio ns (not sho wn here), the CD has a big p oint-mass 0.603 at τ = 0; there is hence no reason to reject H 0 , and confidence interv als at all reasonable lev els start at zero (a 90% in terv al is [0 , C − 1 (0 . 90 , D )] = [0 , 0 . 060]). F or the female regressions, ho w ev er, there are noticeable differen ces in the three slopes underlying what is seen in the left panel; the p-v alue is C (0 , D ) = 0 . 021, and a 90% in terv al is [ C − 1 (0 . 05 , D ) , C − 1 (0 . 95 , D )] = [0 . 003 , 0 . 053]. 5. Da t a fusion via CDs Meta-analysis is a w ell-developed area of theoretical and applied statistics, ha v- ing to do with the comparison, assessmen t and p erhaps ranking of different parame- ters across similar studies. T ypical applications include analyses of d ifferen t sc ho ols, or hospitals, or sp ort teams, or departmen ts of statistics. Over the past few years these topics and metho ds ha v e b een expanded further, to account for the need to fuse together information from potentially v ery differen t types of sources, also in connection with the Data Science exploitation of Big Data. It is also imp ortant in v arious application areas to com bine Bay esian with frequen tist information, as discussed in Liu et al. (2015) and Lewis (2017, this issue); also, Gr ¨ un w ald (2017, this issue) touc hes on w a ys in which to handle m ultiple priors. Supp ose in general that data source y j carries infor mation about parameter ψ j , for sources j = 1 , . . . , k . W e wish to assess o v erall asp ects of these ψ j , p erhaps aiming for inference concerning one of more functions ϕ ( ψ 1 , . . . , ψ k ). Let us first assume that the ψ j parameter is the same, across studies, and that the separate studies ha v e led to CDs C j ( ψ , y j ). A class of metho ds for combinin g these is as follo ws; see Singh et al. (2005); Xie & Singh (2013); Liu et al. (2014) and further references therein. Under the true v alue, C j ( ψ , Y j ) ∼ unif , from whic h follo ws Φ − 1 ( C j ( ψ , Y j )) ∼ N(0 , 1). With weigh ts w j nonrandom and satisfying P k j =1 w 2 j = 1, therefore, ¯ C ( ψ , D ) = Φ k X j =1 w j Φ − 1 ( C j ( ψ , Y j )) , 12 CDS AND RELA TED THEMES 1960 1980 2000 74 76 78 80 82 84 bor n in year e xpected lif elength, f or Nor , Swe, Den 0.00 0.04 0.08 0.0 0.2 0.4 0.6 0.8 1.0 τ confidence Figure 4.2. Left panel: The exp ected mean lifelength for w omen born in Norwa y (full curv e), Sw eden (dashed curve), Denmark (dotted curve), in calendar y ears 1960, 1970, 1980, 1990, 200, 2010, 2015. Righ t panel: The CD C ( τ , D ) for the spread parameter in the mo del β 1 , β 2 , β 3 ∼ N( β 0 , τ 2 ) for the three regression slop e parameters; for men (dashed curv e, starting at 0.603 at zero) and for women (full curve, starting at 0.021 at zero). 95% interv als for τ are [0 , 0 . 060] for men and [0 . 003 , 0 . 053] for women. with D the full dataset, is a CD for the common in terest parameter ψ . Other start ingredien ts than the normal could also b e put to use, but with less amenable con v olutions and in v ersions. This is a versatile and broadly applicable method, but with some dra wbac ks. There are difficulties when estimated weig h ts b w j are used, and there is lack of full efficiency . In v arious cases, there are b etter CD combination metho ds, with higher confidence p o w er; see the discussion in Cunen & Hjort (2016). In clearly structured cases, as with sev eral of the simpler meta-analysis setups, one can w ork with the full likelihoo d of the observ ed data, and deduce go o d CDs for in terest parameters, see Sc h weder & Hjort (2016, Ch. 13). This does sometimes require the full set of raw data, ho w ev er, which is often a to o tall order. General CDS AND RELA TED THEMES 13 w a ys of dealing with data fusion with CDs are discussed and applied in Liu et al. (2015) and Hannig et al. (2017, this issue). Here w e describe a more general setup for carrying out data fusion, via CDs, whic h we call the I I-CC-FF paradigm; see Cunen & Hjort (2016). It is a more broadly applicable form ulation of likelihoo d syn thesis ideas first prop osed, dev elop ed and applied in Sc hw eder & Hjort (1996, 1997), in the sp ecific cont ext of population dynamics mo dels for whale abundance. I I Indep endent Insp e ction: F rom data source y j to estimate and confidence analysis, yielding a CD C j ( ψ j , y j ); y j = ⇒ C j ( ψ j , y j ). CC Confidenc e Conversion: F rom the CD to a confidence log-li k eliho o d, ℓ c,j ( ψ j ); C j ( ψ j , y j ) = ⇒ ℓ c,j ( ψ j ). FF F o cuse d F usion: Using the combined confidence log-lik elihoo d ℓ c = P k j =1 ℓ c,j ( ψ j ) to construct a CD for the given fo cus ϕ = ϕ ( ψ 1 , . . . , ψ k ), p erhaps via profiling, median-Bartletting, etc.; ℓ c ( ψ 1 , . . . , ψ k ) = ⇒ ¯ C fusion ( ϕ, D ), with D denoting the com bined dataset. The FF step, whic h ma y also be describ ed as the Summary of Summaries opera- tion, will t ypically inv olve log-lik elihoo d profiling and operations lik e (3.4), perhaps along with fine-tuning op erations for increased accuracy . Sometimes the CC step is the more difficult one, since a clear translation from confidence to lik elihoo d often w ould inv olve details of sampling design and proto col, etc. Under mild conditions, ho w ev er, the normal c onversion w orks w ell, whic h is ℓ c,j ( ψ j ) = − 1 2 Γ − 1 1 (cc j ( ψ j , y j )) = − 1 2 { Φ − 1 ( C j ( ψ j , y j )) } 2 , cf. (3.4). F or an illustration, let us go back to the lido caine story of T able 4.1 and Figu re 4.1, for which we ha v e already displa y ed the optimal meta-analysis confidence curv e (4.3) for the risk inflation parameter γ . W e may how ever attempt the I I-CC-FF recip e, whic h leads to a ¯ C fusion ( γ , D ) just from conv erting the k = 6 individual cc ∗ j ( γ , D j ) curv es, using normal con v ersion, but without using the raw data per se, or any further kno wledge of the underlying P oisson nature details of the mo delling of the data. Amazingly , this FF fusion curv e is almost indistinguishable from the C ∗ ( γ , D ). 6. CDs in semi- and nonp arametric situa tions The CDs and confidence curv es may also b e constructed in non- and semi- parametric situations. By argumen ts ab ov e, as long as there is an estimator b ψ for the required interest parameter ψ , with an asso ciated limit distribution (t ypically normal), we ma y construct a CD for ψ based on that estimator. The empirical 14 CDS AND RELA TED THEMES lik elihoo d may also b e work ed with to pro duce nonparametric CDs, in broad classes of situations, as developed and illustrated in Sch weder & Hjort (2016, Ch. 11). In some cases a more exact analysis is p ossible. A case in p oint is the follow- ing, where inference is required for the quan tiles µ p = F − 1 ( p ) of a con tinuous and increasing distribution function, based on i.i.d. data y 1 , . . . , y n . F rom the fact that the v ector of ordered observ ations y ( i ) has the same distribution as that of F − 1 ( u ( i ) ), where the u ( i ) are the ordered sample from a uniform distribution, w e can compute s n ( a, b ) = P { Y ( a ) ≤ µ p ≤ Y ( b ) } = P { U ( a ) ≤ p ≤ U ( b ) } for eac h pair ( a, b ); see Sch weder & Hjort (2016, Ch. 11). This can then b e used to compute and displa y confidence curv es cc( µ p , y ) for each p of in terest, as a nested sequence of confidence in terv als. An illu stration is giv en in Figure 6.1, where w e giv e the full confidence curv es for the 0.1, 0.3, 0.5, 0.7, 0.9 deciles for the birth w eigh t distributions of boys and girls, b orn in Oslo, 2001–2008. The cc( µ p , y ) curv es tend to be slimmer where there is more data, i.e. around the median on this occasion. In nonparame tric situations there are often parameters which cannot be esti- mated at the usual √ n rate. Kim & Pollard (1990) giv e an ov erview of classes of cases for whic h the estimator b ψ for the fo cus parameter ψ in question exhibits cub e- ro ot con v ergence in distribution, i.e. n 1 / 3 ( b ψ − ψ ) → d L for the appropriate (and non-normal) limit L . With appropriate extra efforts, in v olving the limit distributi on and a consisten t estimator for its v ariance, sa y b τ , one may construct CDs of the t ype K ( n 1 / 3 ( ψ − b ψ ) / b τ ), p erhaps along with further fine-tuning. 7. Robust CDs f or p arametric models The standard theory for parametric models evolv es around the use of likelih o o d metho ds. This is also at least partly the case for the theory and applications of CDs and confidence curves (Xie & Singh, 2013; Sch weder & Hjort, 2016). The basic concepts and recipes are ho w ev er not limited to lik eliho o ds per se, and v arious robust alternativ es ma y b e w ork ed with. T o illustrate such gen eral ideas and to ols, supp ose indep enden t observ ations y 1 , . . . , y n stem from an unkno wn densit y g , and that one wishes to fit the data to a parametric model, say f θ = f ( · , θ ), with θ a p -dimensional parameter. Consider d a ( g , f θ ) = Z { f 1+ a θ − (1 + 1 /a ) g f a θ + (1 /a ) g 1+ a } d y , for a positiv e tuning paramet er a . This is a divergence (nonnegativ e, and zero only if g = f θ ), and for a → 0 one finds the Kullback–Leibler div ergence R g log( g /f θ ) d y asso ciated with the maxim um lik elihoo d metho d. The BHHJ metho d, from Basu et al. (1998); Jones et al. (2001), estimates θ by minimising an empirical version of CDS AND RELA TED THEMES 15 3000 3500 4000 4500 0.0 0.2 0.4 0.6 0.8 1.0 bir thweights bo ys cc f or fiv e deciles 3000 3500 4000 4500 0.0 0.2 0.4 0.6 0.8 1.0 bir thweights girls cc f or fiv e deciles Figure 6.1. Confidence curv es cc( q ) for deciles 0.1, 0.3, 0.5, 0.7, 0.9 of birth- w eight distributions, for b oys ( n = 548) and girls ( n = 480) b orn in Oslo 2001–2008. d a , namely H n ( θ ) = R f 1+ a θ d y − (1 + a/n ) n − 1 P n i =1 f ( y i , θ ) a . Setting the deriv atives equal to zero, the BHHJ estimator is also the solution to the equation s n − 1 n X i =1 f ( y i , θ ) a u ( y i , θ ) = Z f 1+ a θ u θ d y , where u θ ( y ) = u ( y , θ ) = ∂ log f ( y , θ ) /∂ θ is the score function for the model. Con- tributions from data p oints with low probability under the model thus get w eighted do wn. The metho d is a successfu l robustification of the maxim um likelihoo d strategy (also in regression setups and other mo dels more elab orate than the i.i.d. situation considered here), earning bounded influ ence functions at the expense of a v ery mild loss of efficiency under p erfect mo del conditions, if a is small. The presen t p oin t w e wish to mak e is that the criterion function H n , used to find the BHHJ estimator and its appro ximate m ultinormal distribution, can also b e 16 CDS AND RELA TED THEMES ● ● ● ● ● ● ● ● ● ● ● ● ● ● ● ● ● ● ● ● ● ● ● ● ● ● ● ● 0 5 10 0 2 4 6 8 log bodyweight log brainweight humans: small brains 0.5 0.6 0.7 0.8 0.9 0.0 0.2 0.4 0.6 0.8 1.0 ρ confidence Figure 7.1. Left panel: with av erage x 0 b odyweigh t (in kg) and a verage brain- w eight y 0 (in g), for 28 sp ecies of land animals, the plot gives ( x, y ) = (log x 0 , log y 0 ). Right panel: t w o confidence curves for the correlation co efficient ρ , based on maximum lik eliho o d (estimate 0.779) and one using the robust BHHJ metho d (estimate 0.819). profiled, leading to confidence curv es for fo cus parameters. With ψ = ψ ( θ ) suc h a fo cus parameter, the BHHJ estimator is b ψ = ψ ( b θ ), and we form H n, prof ( ψ ) = min { H n ( θ ) : ψ ( θ ) = ψ } and then the associated deviance function, D n ( ψ ) = 2 n { H n, prof ( ψ ) − H n, prof ( b ψ ) } = 2 n { H n, prof ( ψ ) − H n, min } . With argumen ts along the lines of Sch weder & Hjort (2016, Ch. 2.4, App endix A.6), one ma y establish that D n ( ψ 0 ) → d k χ 2 1 , at the appropriate least false parameter v alue ψ 0 = ψ ( θ 0 ), with θ 0 minimising the distance d a ( g , f θ ) from the true g to the parametric mo del. Here k is a certain extra factor which ma y b e estimated consisten tly from the data. This leads to the robust confidence curv e cc( ψ , D n ) = Γ 1 ( D n ( ψ ) / b k ) (again with D n denoting the dataset), in generalisation of (3.4). This mac hinery works also for m ultidimensional data. Figure 7.1 relates to an illustration of this, where w e hav e studied the dataset Animals in R, with ( x 0 , y 0 ) CDS AND RELA TED THEMES 17 equal to a v erage b o dyw eigh t (in kg) and a v erage brain w eigh t (in g) for n = 28 sp ecies of land animals. On the log-and-log scale of ( x, y ) = (log x 0 , log y 0 ), intriguingly , the p oin ts nearly form a linear regression structure; the devian ts, from this p ersp ec- tiv e, are the big-brained h umans, and the big-bo died small-brained Brac hiosaurus, T riceratops, and Diplo do cus (left panel). Our c hosen fo cus, for this illustration, is the correlation co efficient ρ . The estimate is 0.779, based on all 28 sp ecies, but a m uc h higher 0.960 if w e remov e the three small-brained just mentioned. W e fit the five-parametric binormal mo del to the data, first using maxim um likelihoo d analysis, then the BHHJ metho d with a = 0 . 105; this v alue makes data pairs an a v erage distance a w a y from the centre, as measured b y the Mahalanobis distance, b e do wn w eigh ted 10% (and pairs fu rther a w a y from the cen tre will b e down weigh ted more). This v alue also ensures go o d robustness. The t w o confidence curves are displa y ed in the right panel; the maxim um lik eliho o d v ersion p oin ts to b ρ = 0 . 779 whereas the BHHJ metho d has b ρ a = 0 . 819. The robust 90% confidence interv al is [0 . 441 , 0 . 955]. Imp ortantly , these tw o confidence curves do not assume that the binormal mo del holds. In this particular application the robust BHHJ metho d leads to a somewhat broad confidence curv e, since the metho d attempts to fit a somewhat non-homogeneous dataset to a single binormal density . F or larger v alues of a , the BHHJ estimation metho d will indirectly down weigh t the three outliers more fully , and the correlati on estimate will come closer to 0.960. 8. Ba yes versus CDs The Holy Grail of statistics Brad Efron alludes to is to enjoy the Ba yesian omelet without breaking the Bay esian eggs (Efron, 2010) . It w as the non-existence of a non- informativ e prior whic h led Fisher to fiducial distributions. That a CD is ‘p osterior’ without an y prior is its main selling p oints. Ba y es’ form ula is of course true, and the Ba yesian posterior is the correct updat- ing of a trust worth y prior. But problems arise when there is no trust in the chosen prior, or when there are more than one legitimate priors. With muc h data the CD will tend to b e close to the Ba y esian p osterior, by v arious Bernsh te ˘ ın-v on Mises t yp e theorems (see e.g. Hjort et al. (2010, In tro duction)). This migh t also happ en in some cases with mo derate and small data, particularly when a Jeffreys prior is used. A case of the latter is seen in Lewis (2017, this issue), where he dev elops b oth a By esian p osterior and a CD for the climate sensitivity . They are seen to be indistinguishable. A marginal p osterior distribution migh t b e misleading, as illustrated b y the so called length problem: With indep enden t Y i ∼ N( µ i , 1) for i = 1 , . . . , m , the marginal p osterior for ψ = ∥ µ ∥ = ( P m j =1 µ 2 j ) 1 / 2 based on a flat (Jeffreys) prior for 18 CDS AND RELA TED THEMES the m mean parameters is biased in the freque n tist sense that its cred ibilit y in terv als will not ha ve correct cov erage probabilities (Sc h w eder & Hjort, 2016, Section 9.4). The distribution is actually shifted to the right relativ e to ψ and more so the larger m is. This is also a problem for the marginal of Fisher’s joint fiducial distribution, whic h is not a CD. A similar bias inherent in Bay es setups is noted for ch ange-p oin t assessmen ts in higher dimensions, in Cunen et al. (2017a, this issue). P oten tial bias seems not to b e a concern for most Bay esians. When y our prior is to b e up dated from new data, y ou get the posterior y ou get, and p erformance in rep eated applications is seen as irrelev an t. F requen tly the mo del is complex and the mo del parameter of substan tial dimensions, how ever, as in the length problem. As a more realistic example consider the parameter θ 1 of in terest to Sims (2012) in his Nob el Memorial Prize in Economic Sciences acceptance lecture, where it is also argued that θ 1 ≥ 0 on a priori grounds. The model is a linear sim ultaneous equations mo del for macro economic data. The c hosen prior for co efficients, including θ 1 , is flat. Since the unrestricted maximum lik eliho o d b θ 1 is negat iv e the p osterior is shifted to the right of the CD for θ 1 . The latter has actually a poin t mass of 0 . 90 at zero (when the restriction is θ 1 ≥ 0), while Sims’s p osterior has all its mass on the p ositiv e v alues; see Sc h w eder & Hjort (2016, Section 14.4). Ba y esian metho ds are very often used. It is thus a bit o dd that p erformance in repeated applications is mostly neglected. Bias and other frequen tist properties are ho w ev er of concern to some Bay esians. The in v ariance of the posterior based on Jeffreys priors, to transformations of the mo del parameter, will, as noted abov e, mak e the p osterior nearly or exactly a CD. In cases with a parameter ψ of in terest, of lo w er dimension than the model parameter, the ob jective Bay esian uses a reference prior (Berger & Bernardo, 1992; Berger & Sun, 2008) tailored to ψ . This is parallel to confidence inference where new calculations are needed for each ψ . The p osterior based on a reference prior aims at havin g correct cov erage probabilities for its credi- bilit y regions in rep eated applications. The CD has the same aim – it is actually its defining prop ert y . The realised p osterior and also the CD are understo o d as epis- temic probabilit y distributions for ψ (Sch weder, 2017, this issue). T o b e a CD might actually b e the gold standard for an epistemic probabi lit y distribution for a param - eter of interest , at least for the ob jective Ba y esian; cf. V eronese & Melilli (2017, this issue) and also Gr ¨ un w ald (2017, this issue). F raser (2011) actually suggests that Ba y es posterior distributions are just quick and dirty confidence distributions. W e note that CDs ma y be constructed not only for parameters of mo dels, but also for not-y et-seen random v ariables, as in prediction contexts. There are again similarities with Ba y esian approac hes; see Sc h w eder & Hjort (2016, Ch. 12) and Shen et al. (2017, this issue). CDS AND RELA TED THEMES 19 An imp ortan t virtue of the Ba yesian approach is its coherence. Ordinary prob- abilit y calculus applies to p osterior distributions. F or CDs some probabilit y cal- culations yield new CDs, while others do not. When the prior has b een set up, the challenge is to calculate the w ell-defined p osterior, sa y b y Mark o v Chain Mon te Carlo. The tec hnical virtuosit y of curren t days Bay esians is really impressiv e, and has led to sensible analyses of complex data in many areas. The machin ery for confidence inference is b y far less developed. Significant applications in science are still rather few (but see Cunen et al. (2017b), where the main findings were commu - nicated to the Scientific Committee of the In ternational Whaling Commission via confidence curv es). Soft w are for CDs needs further dev elopmen t in go o d pack ages in order for the dissemination to gain momentum. Rob ert (2013) poin ts ou t that a CD is in es sence just a represen tation of a nested family of confidence regions, and as suc h not particularly nov el, per se. The emphasis on CDs as distributions on par with Bay esian p osteriors migh t ho w ev er be a rather no v el insigh t, distrib utions that “provi de simple and interpretable summaries of what can reasonably b e learned from data (and an assumed mo del)” (Cox, 2013). There is also scop e for nov el and streadily more impressive uses of CDs for data fusion, when information sources are more diverse than in the typical meta-analysis setups; see Xie & Sing h (2013); Liu et al. (2015); Cunen & Hjort (2016). 9. The present collection of p apers Articles app earing in the presen t Sp ecial Issue hav e b een ment ioned ab ov e, in the relev ant contexts. Here we offer just a few more comments to help readers na vigate through these cont ributions and to see connections b et w een them. Eac h of the con tributions Hannig et al. (2017), Lindqvist & T araldsen (2017), T araldsen & Lindqvist (2017) deal with fiducial and generalised fiducial inference questions, also with relev ance for the eternal comparison with Bay esian construc- tions. Articles De Blasi & Sch weder (2017), V eronese & Melilli (2017) are partly concerned with fine-tuning mec hanisms for the constructions of CDs, with further connections to so-called ob jectiv e Ba yes. Severa l con tributions ar e in v olv ed with the imp ortan t topic of com bining information across diverse sources, sometimes called data fusion: Hannig et al. (2017), Gr ¨ un w ald (2017), Cunen et al. (2017a), Lewis (2017). The latter paper is also a well-arg ued con tribution to the alwa ys hot topic of climate researc h, where there typically are v ery differen t sources of information. One of the c hallenges, w orked with b y Lewis, is that o f com bining summaries reac hed b y Ba y esian and frequen tist p ersp ectiv es; see also Liu et al. (2015) and Cunen & Hjort (2016). 20 CDS AND RELA TED THEMES When constructing CDs, and more generally machineries aspiring to deliver p osteriors without priors, one is often close to the more fundamental issues and ideas of ho w probabilit y can or should b e defined and interpreted, cf. again the half- eternal half-disagreemen ts b et w een Ba y esians and frequen tists. This is also touched on in th e essa y Sc hw eder (2017), somewha t indi rectly in Hanni g et al. (2017), Martin (2017), and b y Gr ¨ un w ald (2017). In certain application areas it migh t b e natural to in terpret confidence in the language of epistemic probabilities, as argued by Sch w eder (2017); see in this connection also Helland (2018). The Shen et al. (2017) and Cunen et al. (2017a) articles are o ccupied with re- sp ectiv ely prediction issues, e.g. for time series mo dels, and with estimating and assessing cha nge-p oin ts and regime-shifts, in settings with discrete data. Applica- tions in the latter paper in v olv e finding when Author B to ok o v er for Author A, in the wor ld’s first ever no v el (from 1460), and searching for a regime-shift in a complex fisheries mo del. That pap er also con tains no v el goo dness-of-fit tests for c hec king whether a probability distribution has remained constant ov er a stretch of time. 10. Concluding remarks W e started out discussing the Holy Grail of parametric inference (Efron, 2010), that of reaching well-defined p osteriors for in terest parameters without putting up priors. W e argue that the CDs are the answ er, or part of the answ er. In particular, in classes of clear-cu t situations, in exponential class t yp e mo dels where the broad optimalit y theory of Sc hw eder & Hjort (2016, Chs. 5, 7, 8) applies, the optimal CD pro vides what a rational statistician ough t to believe ab out the unkno wn parameter, giv en the model and the data. There are of course man y remaining issues and obstacles for our profession to w ork wi th and p erhaps slo wly sort out, through the statistical s ym biotic mac hineries of goo d theory and solid practice. Let us men tion some of these. The serious study of CDs and indeed related themes often enough touc hes the fundamen tal issues of what probabilit y is, or ough t to be. This has of course been discussed inside and outside academics since around 1665 (see the engaging accoun t b y Hacki ng (1975)), and p erhaps also the mo dern statisticians and data scientists need to accept that there are severa l v alid notions, living if not alwa ys comfort- ably side-by-side: The clear aleatory probabilit y; the sub jective used by strands of Ba y esians; the epistemic; and yet further cousins and hyb rids, lik e Dempster–Shafer b elief functions (Dempster, 2008; Martin, 2017). There is still a need for a b etter axiomatic theory for epistemic probabilit y , and its connections to likelihoo d theory and related issues. CDS AND RELA TED THEMES 21 On the tec hnical side there is scop e for imp ortant w ork along the lines of further fine-tuning of appro ximate CDs to deliver more accurate co v erage, whic h in the language of CDs, and of this article, ma y b e described as calibrating the CD suc h that C ( ψ ( θ 0 ) , Y ) has a distribution close to the unifom, where ψ = ψ ( θ ) is the fo cus parameter and ψ 0 = ψ ( θ 0 ) is the implied true fo cus v alue. The basics of a list of relev an t techniques is in Sc h w eder & Hjort (2016, Chs. 7-8), but there is more to do, also in situations with m ultimo dal log-lik eliho o ds, with growing dimension p compared to sample size n , etc. A class of alternativ es to the profiling in v olv ed in (3.4) is via the operation of in tegrating out other parameters, whic h ma y w ork w ell also from the frequentist viewp oint (Berger et al., 1999). Sev eral of the issues that bothered Fisher’s con temporaries, when they hesitated to em brace his fiducial inference ideas in the 1930ies and 1940ies, ha v e to do with the usual probabilit y machin ery not b eing applicable in general. The distribution H ( | µ | ) = C ( | µ | ) − C ( −| µ | ), for example, is usually not a CD for | µ | when C is a CD for µ ; see Sch weder & Hjort (2013) for this and similar examples. Sch weder & Hjort (2016, Ch. 6) refer to v arious attempts to figure out when a distribution obtained b y ordinary probabilit y calculus from a CD is itself a CD. These theories are far from complete. It is p erhaps more fruitful to study when go o d appro ximate CDs can be obtained b y ordinary calculus than to try to develop a calculus for fiducial distributions and CDs. An interesting researc h direction is that of matc hing go o d CDs, in particular those kno wn to b e optimal, with corresponding priors, i.e. for so-called ob jective Ba y es. This is also touc hed on in V eronese & Melilli (2017, this issue). There are situations, e.g. those with bounded parameter spaces, where optimal CDs apparen tly ha v e no matching prior. An instance of this is our disagreemen t with what Sims (2012) claimed in his Bay esian-fla v oured Nobel Memorial Prize acceptance sp eec h; see Sc h weder & Hjort (2016, Ch. 14.4). An imp ortant ob jection from the Ba y esian camp is that CDs are usually not w ell- defined when the mo del has b een arriv ed at via a preliminary mo del selection step. F urther decisions are usually needed to guide the calculations. Rob ert (2013) calls this ‘ad hock ery’. But is it more ad ho ck ery than ch o osing the prior in the absence of solid prior information? Also, progress can b e expected regarding working out go o d refinemen ts for CDs after mo del selection, using the mac hinery dev eloped in Hjort & Claesk ens (2003) and Hjort (2014) for frequen tist model av eraging. W e ha v e seen how p-v alues often can be seen as special comp onen ts of a bigger CD picture, and these connections can b e w orked out more fully , both for enhanced in terpretation and for b etter assessments of w ell-understo o d hypotheses; cf. the still 22 CDS AND RELA TED THEMES ongoing debate on the uses and many misuses of p-v alues (W asserstein & Lazar, 2016). The CDs and confidence curves should find more use in the contemporary w orld of Big Data, Data Science and Machine Learning, also for con v eying summary in- formation ab out the most p ertinent issues, based on often complex and massiv e bac kground data. Instrumental here is also the task of com bining and fusing to- gether information across v ery divers e sources, where what we describe ab ov e as the I I-CC-FF paradigm ough t to b e harnessed furth er. There is already a b o dy of literature and results on the p erformance and opti- malit y of classes of CDs, cf. again Sch weder & Hjort (2016, Ch. 5). Asp ects of this theory ough t to b e extended from CDs to confidence curves, as there are natural cases where the cc( ψ , y ) is the more fundamen tal notion of confidence; cf. the Fieller problem, situations with m ultimo dal log-lik elihoo ds, etc. There is similarly a need for more w ork a nd better in sigh ts for con fidence curv es in high er dim ensions. Finally w e p oint to the correlated worlds of CDs, inferent ial mo dels and generalised fiducial inference, where there is a need to sort out better when the approaches agree, and where they migh t not. A ckno wledgements As guest editors we are first of all grateful for the high-qualit y and patience- demanding efforts of all the authors, also during the required rounds of revisions and cross-referencing. W e are also indebted to the Norwegian Researc h Council for its funding of the F o cuStat pro ject (F o cus Driv en Statistical Inference With Complex Data) at the Departmen t of Mathematics, Univ ersity of Oslo; this w as also instrumen tal for the group b eing able to host a series of international workshop s in Oslo, including Infer enc e With Confidenc e in May 2015. Thanks are in particular due to C´ eline Cunen, whose efforts in connection with the full pro cess of handling and sharp ening the contribu tions to the present Sp ecial Issue w ere crucially helpful, along with the help and insights from a select group of conscienti ous referees. W e finally ac knowledge with gratitude the active help of Holger Dette and the other editors of the JSPI in creating a high-quali t y sp ecial issue. References Barndorff-Nielsen, O. E. & Co x, D. R. (1994). Infer enc e and Asymptotics . London: Champmann & Hall. Basu, A. , Harris, I. R. , Hjor t, N. L. & Jones, M. C. (1998). Robust and efficien t estimation b y minimising a densith y p ow er divergence. Biometrika 85 , 549–559. CDS AND RELA TED THEMES 23 Ber ger, J. O. & Bernardo, J. M. (1992). On the developmen t of reference priors [with discussion and a rejoinder]. In Bayesian Statistics 4 , J. M. Bernardo, J. O. Berger, A. P . Da wid & A. F. M. Smith, eds. Oxford: Oxford Univ ersit y Press, pp. 35–60. Ber ger, J. O. , Liseo, B. & W olper t, R. L. (1999). In tegrated lik eliho o d metho ds for eliminati ng n uisance parameters. Statistic al Scienc e 14 , 1–26. Ber ger, J. O. & Sun, D. (2008). Ob jectiv e priors for the biv ariate normal model. A nnals of Statistics 36 , 963–982. Brazzale, A. R. & Da vison, A. C. (2008). Accurate parametric inference for small samples. Statistic al Scienc e 23 , 465–484. Brazzale, A. R. , D a vison, A. C. & Reid, N. (2007). Applie d Asymptotics: Case Studies in Smal l-Sample Statistics . Cam bridge: Cambridge Universit y Press. Co x, D. R. (2013). Discussion of M. Xie and K. Singh’s pap er, ‘Confid ence distribu- tions, the frequen tist estimator of a parameter: a review’. International Statistic al R eview 81 , 40–41. Cunen, C. , Hermansen, G. & Hjor t, N. L. (2017a). Confidence distrib utions for c hange-p oin ts and regime shifts. Journal of Statistic al Planning and Infer enc e xx , xx–xx. Cunen, C. & Hjor t, N. L. (2016). Combining information across div erse sources: The I I-CC-FF paradigm. In Pr o c e e dings fr om the Joint Statistic al Me eting, Chic ago 2016 . American Statistical Asso ciation, pp. 138–153. Cunen, C. , W alløe, L. & Hjor t, N. L. (2017b). Decline in energy storage in An tarctic Mink e whales during the JARP A p erio d: Assessment via the F o- cused Information Criterion (FIC). R ep orts of the Scientific Committe e of the International Whaling Commision SC/67A/EM/04 . De Blasi, P. & Schweder, T. (2017). Confidence distributions from likelihoo ds b y median bias correction. Journal of Statistic al Planning and Infer enc e xx , xx– xx. Dempster, A. P. (2008). The Dempster-Shafer calculus for statisticians. Interna- tional Journal of Appr oximate R e asoning 48 , 365–377. Efr on, B. (1998). R.A. Fisher i n the 21 st cen tury [with discussion and a rejoinder]. Statistic al Scienc e 13 , 95–122. Efr on, B. (2010). The future of indirect evidence. Statistic al Scienc e 25 , 145–15 7. Efr on, B. & Hastie, T. (2016). Computer A ge Statistic al Infer enc e . Cambridge: Cam bridge Univ ersity Press. Fisher, R. A. (1930). Inv erse probabilit y . Pr o c e e dings of the Cambridge Philo- sophic al So ciety 26 , 528–535. Fisher, R. A. (1932). Inv erse probability and the use of Lik elihoo d. Pr o c e e dings of the Cambridge Philosophic al So ciety 28 , 257–261. Fisher, R. A. (1933). The concepts of in verse probability and fiducial probability referring to unkno wn parameters. Pr o c e e dings of the R oyal So ciety, Series A 139 , 343–348. 24 CDS AND RELA TED THEMES Fisher, R. A. (1935). The fiducial argumen t in statistical inference. Annals of Eugenics 6 , 391–398. Fraser, D. A. S. (2011). Is Ba y es p osterior just quick and dirt y confidence? [with discussion and a rejoinder]. Statistial Scienc e 26 , 249–316. Gr ¨ unw ald, P. (2017). Safe probabi lit y . Journal of Statistic al Planning and Infer- enc e xx , xx–xx. Ha cking, I. (1975). The Emer genc e of Pr ob ability . Cam bridge: Cam bridge Uni- v ersit y Press. Hald, A. (1998). A History of Mathematic al Statistics fr om 1750 to 1930 . New Y ork: Wiley . Hald, A. (2006). A History of Par ametric Statistic al Infer enc e fr om Bernoul li to Fisher, 1713 to 1935 . Sources and Studies in the History of Mathematics and Ph ysical Sciences. Berlin: Springer. Hannig, J. , Feng, Q. , Iyer, H. , W ang, C. M. & Liu, X. (2017). F usion learning for in ter-laboratory comparisons. Journal of Statistic al Planning and Infer enc e xx , xx–xx. Hannig, J. , Iyer, H. , Lai, C. S. & Lee, T. C. M. (2016). Generalized fidu- cial inference: A review and new results. Journal of the Americ an Statistic al Asso ciation 111 , 1346–1361. Helland, I. (2018). Epistemic Pr o c esses . Berlin: Springer-V erlag. Hjor t, N. L. (2014). Discussion of Efron’s ‘Estimation and accuracy after mo del selection’. Journal of the Americ an Statistic al Asso ciation 110 , 1017–1020. Hjor t, N. L. & Claeskens, G. (2003). F requentist mo del a v erage estimators [with discussion]. Journal of the Americ an Statistic al Asso ciation 98 , 879–899. Hjor t, N. L. , Holmes, C. , M ¨ uller, P. & W alker, S. G. (2010). Bayesian Nonp ar ametrics . Cambridge Universit y Press. Jones, M. C. , Hjor t, N. L. , Harris, I. R. & Basu, A. (2001). A comparison of related densit y-based minim um div ergence estimators. Biometrika 88 , 865–873. Kim, J. & Pollard, D. (1990). Cub e ro ot asymptotics. Annals of Statistics 18 , 191–219. Lehmann, E. & R omano, J. P. (2005). T esting Statistic al Hyp otheses [3r d e d.] . New Y ork: Wiley . Lehmann, E. L. (1959). T esting Statistic al Hyp otheses . New Y ork: Wiley . Lewis, N. H. (2017). Com bining indep enden t bay esian p osteriors into a confi- dence distribution, with application to estimating climate sensitivit y . Journal of Statistic al Planning and Infer enc e xx , xx–xx. Lindqvist, B. H. & T araldsen, G. (2017). On the prop er treatm en t of improp er distributions. Journal of Statistic al Planning and Infer enc e xx , xx–xx. Liu, D. , Liu, R. Y. & Xie, M. (2014). Exact meta-analysis approac h for discrete data and its application to 2 × 2 tables with rare even ts. Journal of the A meric an Statistic al Asso ciation 109 , 1450–1465. CDS AND RELA TED THEMES 25 Liu, D. , Liu, R. Y. & Xie , M. (2015). Multiv ariate meta-analysis o f heterogeneous studies using only summary statistics: efficiency and robustness. Journal of the A meric an Statistic al Asso ciation 110 , 326–340 . Mar tin, R. (2017). On an inferen tial mo del construction using generalized asso ci- ations. Journal of Statistic al Planning and Infer enc e xx , xx–xx. Mar tin, R. & Liu, C. (2015). Infer ential Mo dels: R e asoning with Unc ertainty . T oron to: CR C Press. Normand, S.-L. T. (1999). T utorial in biostatistics meta-analysis: F ormulating, ev aluating, com bining, and rep orting. Statistics in Me dicine 18 , 321–359. R ober t, C. (2013). Discussion of M. Xie and K. Singh’s pap er, ‘Confidence dis- tributions, the frequen tist estimator of a parameter: a review’. International Statistic al R eview 81 , 52–56. Schweder, T. (2017). Confidence is epistemic probabilit y for empirical science. Journal of Statistic al Planning and Infer enc e xx , xx–xx. Schweder, T. & Hjor t, N. L. (1996). Bay esian syn thesis or likelihoo d syn thesis – what do es Borel’s parado x sa y? R ep orts of the International Whaling Commission 46 , 475–479. Schweder, T. & Hjor t, N. L. (1997). Indirect and direct likelihoo ds and their syn thesis – with an app endix on minke whale dynamics. T ec h. rep., Departmen t of Mathematics, Universit y of Oslo. Schweder, T. & Hjor t, N. L. (2002). Confidence and lik eliho o d. Sc andinavian Journal of Statistics 29 , 309–322. Schweder, T. & Hjor t, N. L. (2003). F requentist analogues of priors and p os- teriors. In Ec onometrics and the Philosophy of Ec onomics: The ory-Data Con- fr ontation in Ec onomics , B. Stigu m, ed. Princeton Univ ersity Press, pp. 285–217. Schweder, T. & Hjor t, N. L. (2013). Discussion of M. Xie and K. Singh’s paper, ‘Confidence distributions, the frequent ist estimator of a parameter: a review’. International Statistic al R eview 81 , 56–68. Schweder, T. & Hjor t, N. L. (2016). Confidenc e, Likeliho o d, Pr ob ability: Statis- tic al Infer enc e with Confidenc e Distributions . Cam bridge: Cambr idge Universit y Press. Shen, J. , Liu, R. & Xie, M.-g. (2017). Prediction with confidence: A general framew ork for prediction. Journal of Statistic al Planning and Infer enc e xx , xx–xx. Sims, C. A. (2012). Statistical mo deling of monetary policy and its effects [Nob el Memorial Prize in Economic Sciences Lecture]. A meric an Ec onomic R eview 102 , 1187–1205. Singh, K. , Xie, M. & Stra wderman, W. E. (2005). Com bining information from indep enden t sources through confidence distributions. Annals of Statistics 33 , 159–183. Student (1908). The probable error of a mean. Biometrika 6 , 1–25. T araldsen, G. & Lindqvist, B. H. (2017). Conditional fiducial mo dels. Journal of Statistic al Planning and Infer enc e xx , xx–xx. 26 CDS AND RELA TED THEMES Ver onese, P. & Melilli, E. (2017). Fiducial, confidence and ob jective bay esian p osterior distributions for a m ultidimensional parameter. Journal of Statistic al Planning and Infer enc e xx , xx–xx. W asserstein, R. W. & Lazar, N. A. (2016). The ASA’s statemen t on p-v alue: con text, process, and purp ose. A meric an Statistician 70 , 129–133. Xie, M. & Singh, K. (2013). Confidence distribution, the frequenti st distribution estimator o f a parameter: a review [with d iscussion and a r ejoinder]. International Statistic al R eview 81 , 3–39.
Original Paper
Loading high-quality paper...
Comments & Academic Discussion
Loading comments...
Leave a Comment