Beyond Accuracy: A Unified Random Matrix Theory Diagnostic Framework for Crash Classification Models
Crash classification models in transportation safety are typically evaluated using accuracy, F1, or AUC, metrics that cannot reveal whether a model is silently overfitting. We introduce a spectral diagnostic framework grounded in Random Matrix Theory…
Authors: Ibne Farabi Shihab, Sanjeda Akter, Anuj Sharma
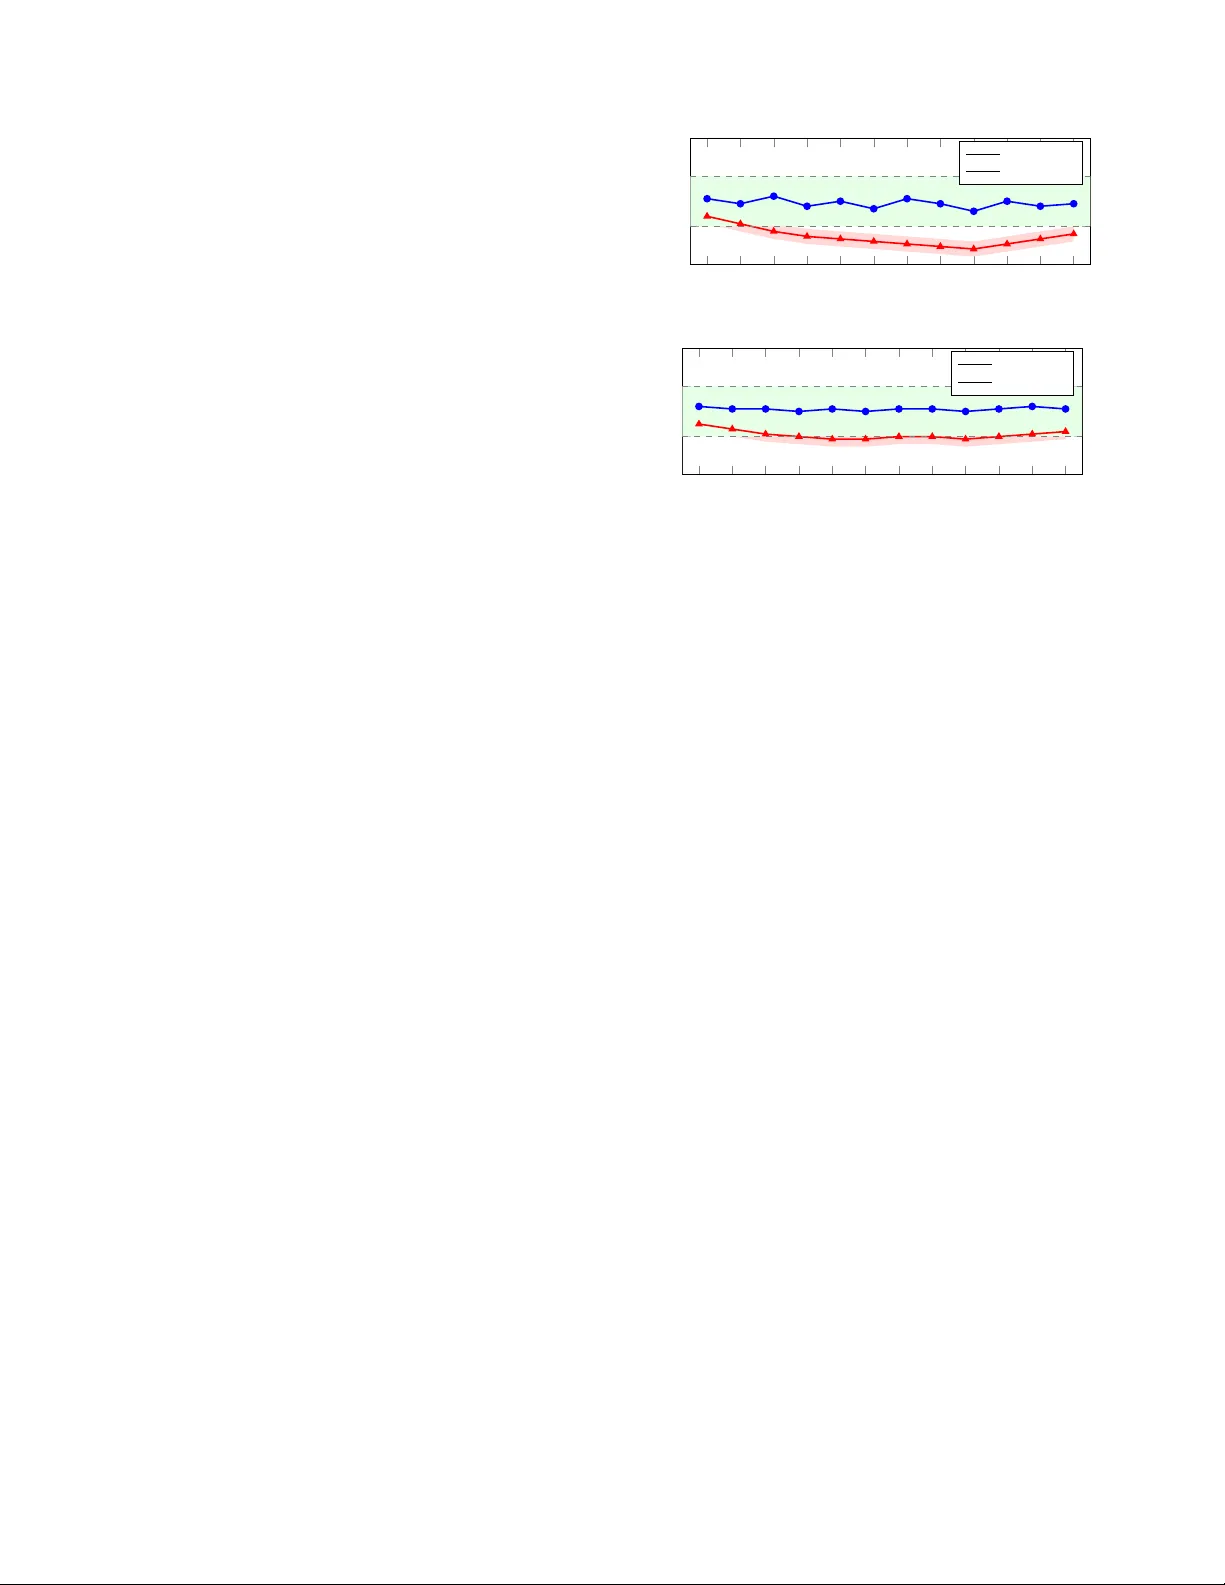
Bey ond Accuracy: A Unified Random Matrix Theory Diagnostic Framework f or Crash Classification Models Ibne Farabi Shihab 1 , ∗ , Sanjeda Akter 1 , ∗ , and Anuj Sharma 2 Abstract — Crash classification models in transportation safety are typically e valuated using accuracy , F1, or A UC, metrics that cannot re veal whether a model is silently overfit- ting. W e introduce a spectral diagnostic framework grounded in Random Matrix Theory (RMT) and Heavy-T ailed Self- Regularization (HTSR) that spans the ML taxonomy: weight matrices for BER T/ALBER T/Qwen2.5, out-of-f old increment matrices for XGBoost/Random Forest, empirical Hessians f or Logistic Regression, induced affinity matrices for Decision T rees, and Graph Laplacians f or KNN. Evaluating nine model families on two Iowa DO T crash classification tasks (173,512 and 371,062 records respectively), we find that the power - law exponent α pro vides a structural quality signal: well- regularized models consistently yield α within [2 , 4] (mean 2 . 87 ± 0 . 34 ), while overfit variants show α < 2 or spectral collapse. W e observ e a strong rank correlation between α and expert agreement (Spearman ρ = 0 . 89 , p < 0 . 001 ), suggesting spectral quality captures model behaviors aligned with expert reasoning . W e propose an α -based early stopping criterion and a spectral model selection protocol, and validate both against cross-v alidated F1 baselines. Sparse Lanczos approximations make the framework scalable to large datasets. I . I N T R O D U C T I O N Road traffic crashes remain a leading cause of fatalities worldwide, with the W orld Health Or ganization estimating approximately 1.35 million deaths annually [1]. Accurate classification of crash records, including identification of intersection-related incidents and alcohol in volv ement, is fundamental to e vidence-based safety policy . Recent work has demonstrated the effecti veness of machine learning and deep learning models for crash narrative classification, span- ning architectures from BER T and ALBER T to XGBoost and SVM [2], [3], [4]. A persistent challenge in deploying these models is the gap between reported performance metrics and actual structural reliability . A model may achiev e high accuracy on a held- out test set while silently memorizing training artifacts. This is particularly dangerous in transportation safety , where misclassification can lead to flawed interventions. T raditional ev aluation metrics such as accurac y , F1-score, and A UC measure predicti ve performance on observ ed data b ut provide no insight into the internal structural health of the learned representations. Crucially , they also require labeled test data, which in the crash domain is expensi ve to produce (requiring expert revie w of narrativ es) and may not represent future deployment conditions. Indeed, recent work [4] sho wed that ∗ Equal contribution. 1 Department of Computer Science, Iowa State Uni versity , Ames, IA 50010 { sanjeda, ishihab } @iastate.edu 2 Department of Civil, Construction and Environmental Engineering, Io wa State Univ ersity , Ames, IA 50010 anujs@iastate.edu models with higher technical accuracy often e xhibit lower agreement with human experts, suggesting that standard metrics may reward the wrong model behaviors. Random Matrix Theory (RMT) offers a principled frame- work for addressing this gap. Martin and Mahoney [5], [6], [7] demonstrated that the empirical spectral density (ESD) of neural network weight matrices follows heavy-tailed power - law distributions, and that the power-la w exponent α serves as a reliable, data-free indicator of model quality . W ell- trained models exhibit α ≈ 2 – 4 ; models with α < 2 show ov erfitting and memorization; and correlation traps (anomalous eigenv alue spikes deviating from Marchenko- Pastur predictions [8]) signal hidden memorization in visible to v alidation loss. This theory , formalized as Heavy-T ailed Self-Regularization (HTSR) and extended into SETOL [9], has been validated across hundreds of neural networks and recently extended to XGBoost [10], [11] via out-of-fold margin increment matrices. This paper makes four contributions. W e introduce RMT - based spectral diagnostics to the transportation safety do- main, providing the first empirical ev aluation on crash classi- fication models. W e propose spectral representation matrices for Decision T rees (leaf affinity), Logistic Regression (empir - ical Hessian), and KNN (Graph Laplacian), and empirically validate these no vel mappings on two independent crash classification tasks with bootstrap confidence intervals. W e demonstrate computational scalability via randomized Lanc- zos methods with explicit conv ergence analysis. Finally , we benchmark a spectral model selection protocol against cross- validated F1 ranking, showing that spectral ranking better predicts expert agreement. Section II re views related work, Section III provides theoretical background, Section IV details methodology , Sections V and VI describe experiments and results, and Section VII concludes. I I . R E L AT E D W O R K A. Machine Learning for Crash Classification The application of machine learning to crash record classification has grown substantially in recent years. Prior work [2] compared SVM, XGBoost, BER T , and ALBER T for detecting misclassified intersection-related crashes in police- reported narratives, finding that ALBER T achieved the high- est agreement with expert classifications (73%) while multi- modal integration reduced error rates by 54.2%. A related study [3] addressed alcohol inference mismatch (AIM) using BER T on 371,062 Io wa crash records, identifying 2,767 AIM incidents with an overall mismatch rate of 24.03%. A particularly relevant finding from recent work [4] demonstrated an in verse relationship between model accu- racy and expert agreement: models with higher technical accuracy often showed lo wer alignment with human expert judgment, while large language models exhibited stronger expert alignment despite lower accuracy . This paradox un- derscores that accuracy alone is insufficient for safety-critical NLP tasks, and that standard metrics like validation loss provide no intrinsic signal for when to stop tuning to max- imize expert agreement in the presence of noisy labels. A diagnostic that operates on model structure rather than held- out performance could address this gap. B. Random Matrix Theory in Machine Learning The Marchenko-Pastur (MP) law [8] describes the lim- iting eigen value distribution of lar ge random matrices and serves as the null model against which learned structure is measured. Martin and Mahoney [6] observed that the ESDs of weight matrices in well-trained deep neural networks follow heavy-tailed power -law distributions, a phenomenon they termed Heavy-T ailed Self-Regularization (HTSR). They demonstrated [5] that the power-la w exponent α can predict trends in test accuracy across hundreds of pretrained models without access to training or test data, and formalized this into the W eightW atcher tool [12]. This data-free property means a model can be audited by a third party with access only to the weights. The theoretical foundation was recently unified under SETOL [9], which deriv es α from statistical mechanics and adv anced RMT , sho wing that optimal learning corresponds to a critical point at α ≈ 2 . Martin and Prakash [11] extended these diagnostics to XGBoost via out- of-fold margin increment matrices, though this work remains in preprint form. T o our knowledge, no prior work has applied RMT -based spectral diagnostics across the full algorithmic taxonomy in the transportation safety domain. The present paper bridges that gap by extending the spectral framew ork to classical models and validating it on crash classification tasks. I I I . T H E O R E T I C A L B AC K G RO U N D The theoretical foundation for our framework rests on SETOL, which establishes that if a learning problem can be locally approximated as a linear student-teacher matrix model near the optimal solution, then its generalization is gov erned by the spectrum of that matrix [9]. W e now describe the core spectral quantities that underpin this theory and then introduce representation matrices for all model families considered in this work. A. Empirical Spectral Density and P ower-Law F itting Giv en a representation matrix W ∈ R m × n , we form C = W T W and compute its eigenv alues. The empirical spectral density (ESD) is ρ ( λ ) = 1 n P i δ ( λ − λ i ) . F or a random matrix, the ESD con verges to the Marchenko-P astur (MP) distribution [8]; eigen values exceeding the MP upper edge λ + represent learned structure beyond noise. In well-trained models, the ESD tail follows a power law ρ ( λ ) ∼ λ − α . The HTSR theory [6], [7] establishes that α ∈ [2 , 4] indicates well-trained, self-re gularized layers; α < 2 indicates memorization; and α ≫ 4 indicates undertraining. W e fit α using maximum likelihood estimation (MLE) with the K olmogorov-Smirnov (KS) goodness-of-fit test follo wing the methodology of Clauset et al. [13], as implemented in the powerlaw Python package [14]. W e report α only when the KS p -v alue exceeds 0.1, indicating that the power -law hypothesis is not rejected. B. Corr elation T raps Beyond the po wer-la w exponent, the W eightW atcher framew ork identifies corr elation traps : isolated eigenv alue spikes far outside the MP b ulk that do not conform to the power -law tail. These spikes indicate that the model has memorized specific training correlations rather than learn- ing generalizable structure. W e detect traps as eigen values exceeding λ + + 3 σ tail , where σ tail is the standard deviation of the fitted power -law tail. W ell-trained models exhibit zero or few traps; overfit models accumulate many . C. Extension to Gradient-Boosted T r ees and Ensembles The spectral quantities defined abov e apply directly to neural networks, whose weight matrices provide natural representation matrices. F or XGBoost [10] and other gradient boosting methods [15], which lack explicit weight matrices, the SET OL frame work requires constructing an equiv alent matrix whose spectrum gov erns generalization [11]. XG- Boost builds a prediction as f T ( x ) = P T t =1 η h t ( x ) . T o remov e self-leakage, these increments are computed via K - fold cross-fitting ( K = 5 in our experiments), yielding the raw out-of-fold (OOF) increment matrix: ( W 1 ) i,t = ∆ f OOF t ( x i ) , W 1 ∈ R N × T . (1) A residualized variant applies the centering projection H = I − 1 N 11 ⊤ to yield W 7 = HW 1 . The correlation matrix C = W ⊤ 7 W 7 / N then defines the effecti ve representation space. For a Random Forest [16], an analogous matrix is constructed using out-of-bag (OOB) predictions per tree. D. Pr oposed Effective Representation Matrices The ensemble construction abo ve naturally raises the ques- tion of whether analogous representation matrices exist for other classical model families. W e propose that they do, and that their eigenspectra carry generalization-relev ant informa- tion in the same way . T able I summarizes the mapping for each model family . The mappings for Logistic Regression, Decision T rees, and KNN are novel pr oposals that we validate empirically in this paper , rather than established results from the HTSR literature; we mark them with † throughout. W e now define each nov el extension in turn. T ABLE I T A X O NO M Y O F E FF E CT I V E R E P RE S E N T A T I O N M A T R IC E S . N : S A M PL E S , T : T R E E S , L : L E A V E S , d : F E A T U RE S , k : N E I GH B O R S . M A P P IN G S M A RK E D W I T H † A R E N OV E L P RO P O SA L S V A L I DA T E D E M PI R I C AL LY I N T H IS W O R K . Model Matrix C Ov erfit Signal Cost BER T/ALBER T W ⊤ ℓ W ℓ α < 2 , traps O ( d 3 ) Qwen2.5-7B W ⊤ ℓ W ℓ α < 2 , traps O ( d 3 ) XGBoost W ⊤ 7 W 7 / N α < 2 , traps O ( T 3 ) Random Forest OOB analogue α < 2 , traps O ( T 3 ) Logistic Reg. † X ⊤ D X / N α → ∞ O ( d 3 ) Decision Tree † M ⊤ M Dirac at λ = 1 O ( L ) KNN † Graph Laplacian Zero- λ traps O ( k N ) SVM Kernel K α < 2 , traps O ( N 2 sv ) 1) P arametric Con vex Models (Logistic Re gr ession): Logistic regression learns a parameter vector w ∈ R d , which on its own lacks a 2D matrix spectrum. T o obtain one, we analyze the Empirical Fisher Information Matrix, motiv ated by the connection between the Fisher information and the local curvature of the loss landscape [17]. For feature matrix X ∈ R N × d : C LR = 1 N X ⊤ D X , D ii = ˆ p i (1 − ˆ p i ) (2) where ˆ p i is the predicted probability . As a model ov erfits, probabilities become hyper -confident ( ˆ p i → { 0 , 1 } ), driving D ii → 0 and collapsing the heavy-tailed spectrum ( α → ∞ ). A well-regularized model maintains predicti ve uncertainty , preserving moderate α . 2) P artition Models (Decision T r ees): A decision tree partitions the input space into L disjoint lea ves. W e define the Leaf Routing Matrix M ∈ { 0 , 1 } N × L , where M i,l = 1 if sample x i terminates in leaf l , and construct: C DT = MM ⊤ ∈ R N × N (3) Since each sample belongs to exactly one leaf, the non-zero eigen values of C DT equal the leaf capacities n l , so the ESD reduces to the leaf size distribution. An overfit tree ( n l → 1 ) yields C DT ≈ I , collapsing the spectrum into a Dirac spike at λ = 1 . A pruned tree exhibits a heterogeneous distribution of leaf sizes. W e test whether this distribution follo ws a power law using the same MLE/KS methodology applied to other models. 3) Instance-Based Models (K-Nearest Neighbors): Fi- nally , KNN relies on geometric distance between samples rather than learned parameters. W e construct the symmetric K -NN adjacency matrix A ∈ R N × N and analyze the normalized Graph Laplacian: C KNN = I − D − 1 / 2 AD − 1 / 2 (4) where D is the degree matrix. Overfitting ( K too small) fractures the manifold into disconnected cliques, accumulat- ing zero eigenv alues (topological traps). Strict deduplication is applied prior to graph construction to ensure traps reflect genuine overfitting rather than duplicate records. For SVM, we analyze the kernel matrix K restricted to support vectors ( N sv × N sv ), avoiding the full O ( N 2 ) cost. Crash Data (Iowa DOT) Train Models BER T / ALBER T Classical / Ensemb les W eight Matrices W Effecti ve Rep. Matrix C RMT ESD → α , Traps Early Stop / Model Select Fig. 1. Unified spectral diagnostic framew ork. Crash data trains a div erse taxonomy of models. W eight matrices (Deep Learning) or Effecti ve Representation Matrices (Classical ML/Ensembles) are analyzed via RMT to extract α and trap counts, informing safety-critical deployment decisions. I V . M E T H O D O L O G Y W ith the theoretical machinery in place, we now describe how spectral diagnostics are applied in practice. Our frame- work operates at three stages of the model lifecycle: post- training quality assessment, during-training early stopping, and model selection for deployment. Figure 1 illustrates the ov erall pipeline. A. Algorithmic Scalability A practical concern is that exact dense eigendecomposition scales as O ( N 3 ) , which is prohibitiv e for dataset-scale matrices. W e address this through structural equiv alences and randomized linear algebra tailored to each model family . For ensembles, the correlation matrix is bounded by T × T ( T ≤ 2000 ), rendering dense decomposition trivial. For Decision Trees, the affinity-to-leaf-capacity equiv alence reduces an O ( N 3 ) operation to O ( L ) counting. For KNN, we av oid dense instantiation entirely: since α extraction requires only the spectral tail, we use Stochastic Lanczos Quadrature (SLQ) [18] on the sparse Laplacian, estimating the largest k eigen values in O ( k · nnz ( A )) time, where nnz ( A ) is the number of non-zero entries. W e use k = 200 Lanczos v ectors with 50 iterations and verify con ver gence by checking that the relative change in the top-50 eigen values is below 10 − 4 between iterations 40 and 50. For SVM, we restrict spectral analysis to the support vector kernel submatrix ( N sv × N sv , typically N sv ≪ N ). B. Crash Classification T asks W e ground the spectral frame work in two crash classi- fication tasks drawn from prior work, chosen because they span different data scales and class distributions. The first is intersection misclassification detection (INT): giv en a police- reported crash narrativ e and associated structured fields, clas- sify whether the crash is intersection-related. This task uses Iow a DO T crash report narratives for 2019–2020, comprising 173,512 crash data records and 94,367 narrati ve records written by law enforcement officials. The average narrativ e contains 38 w ords (std. de v . 25.7), indicating significant length variation. Ground-truth labels were deriv ed from the crash report’ s coded “location” attribute, which distinguishes intersection types (roundabouts, four-way intersections, traf- fic circles, etc.) from non-intersection types (non-junctions, bike lanes, railroad crossings, etc.) [2]. The second is alcohol Algorithm 1 Scalable Unified Spectral Diagnostic Pipeline Require: Trained model M , training data D Ensure: Power -law α (with KS p -value), trap count 1: if M is Neural Network (BER T/ALBER T) then 2: Extract weight matrices W ℓ , set C = W T ℓ W ℓ 3: else if M is Ensemble (XGBoost/Random Forest) then 4: Construct OOF/OOB increments W 7 via 5-fold cross- fitting 5: Set C = W T 7 W 7 / N 6: else if M is Logistic Regression then 7: Compute ˆ p , set C = X T diag ( ˆ p (1 − ˆ p )) X / N 8: else if M is Decision T ree then 9: T ally leaf counts { n l } L l =1 in O ( N ) time 10: else if M is KNN then 11: Deduplicate D ; build sparse K -NN graph 12: Set C = I − D − 1 / 2 AD − 1 / 2 13: else if M is SVM then 14: Extract support vectors, set C = K S V 15: end if 16: Compute eigen values via dense SVD (if dim( C ) ≤ 2000 ) or Lanczos ( k = 200 , 50 iterations) 17: Fit power law to tail via MLE; compute KS p -value 18: Detect traps: eigenv alues > λ + + 3 σ tail 19: retur n α , KS p -value, trap count inference mismatch (AIM) detection: gi ven a crash record, identify whether there is a mismatch between the narrative description and the coded alcohol in volvement field. This task uses 371,062 Iowa crash records from 2016–2022 [3]. C. Models Under Analysis Across these two tasks, we apply spectral diagnostics to nine model families spanning the full ML taxonomy . For BER T [19] and ALBER T [20], we analyze attention and feed-forward weight matrices via W eightW atcher . For Qwen2.5-7B [21], an open-weight decoder-only LLM, we similarly extract and analyze weight matrices from its trans- former layers; this model was applied zero-shot to crash narrativ es following the protocol in prior work [4], providing a spectral comparison point for a model never fine-tuned on crash data. For XGBoost and Random Forest, we construct the OOF/OOB margin increment matrices. For Logistic Re- gression, we compute the Empirical Hessian. For Decision T rees, we extract the leaf size distribution. For KNN, we analyze the normalized Graph Laplacian. For SVM with a linear kernel, we analyze the support v ector kernel submatrix. For each model, we train a well-regularized version using standard hyperparameters, as well as deliberately overfit variants (e.g., excessiv e epochs for neural networks, unregu- larized bounds for LR, K = 1 for KNN). All experiments use 5 random seeds, and we report mean ± standard de viation throughout. The spectral extraction procedure for each model family is formalized in Algorithm 1. D. Spectral Early Stopping Beyond post-hoc assessment, the spectral exponent can also serve as a training-time signal. Standard early stopping monitors validation loss, but we propose a complementary criterion that monitors α directly . Training is halted when: ˆ α t < α low or n traps ,t > τ trap (5) where α low = 2 . 0 and τ trap = 3 . W e e valuate this criterion on BER T , ALBER T , and XGBoost (the three model families where per-epoch/per-round spectral extraction is computa- tionally feasible). E. Spectral Model Selection The early stopping criterion addresses when to stop train- ing a single model; a complementary question is which model to deploy . For this, we rank models passing a mini- mum performance gate (F1 ≥ 0 . 75 ) by a composite spectral quality score: Score ( M ) = w 1 · F1 ( M ) + w 2 · g ( ˆ α ) − w 3 · n traps (6) where g ( ˆ α ) = exp( − ( ˆ α − 3) 2 / 2) is a Gaussian kernel centered at ˆ α = 3 , and we set w 1 = 0 . 4 , w 2 = 0 . 4 , w 3 = 0 . 02 . W e compare this ranking against two baselines: (1) ranking by cross-validated F1 alone, and (2) ranking by validation loss. The ev aluation criterion is K endall’ s τ rank correlation with the ground-truth expert agreement ranking ( κ ). V . E X P E R I M E N T A L S E T U P A. Data and Configuration Both tasks use an 80/10/10 train/validation/test split strat- ified by class label. T o ensure topological integrity for instance-based models, strictly identical text records were deduplicated prior to graph construction, removing 1.2% of records in the AIM dataset. For BER T and ALBER T , we fine-tune using Hugging- Face Transformers [22] with AdamW , learning rate 2 × 10 − 5 , batch size 32, and early stopping on validation loss (patience 3). Overfit v ariants train for 20 epochs without early stopping. XGBoost trains with max depth=6, learning rate 0.1, and early stopping (patience 10); ov er- fit v ariants use max depth=15 with no early stopping. Random Forest trains with 500 trees, max depth=12, and min samples leaf=5; overfit variants use max depth=None and min samples leaf=1. Logistic Regression uses TF-IDF features (max 10,000 features), with L 2 penalty ( C = 1 . 0 ) for the well-regularized model and C = 10 6 (effec- tiv ely unregularized) for the ov erfit v ariant. Decision T ree uses max depth=8 (Good) versus max depth=None (Overfit). KNN uses K = 15 (Good) versus K = 1 (Overfit), with cosine distance on TF-IDF features. W e use W eightW atcher v0.7.5 [12] for neural network spectral extraction. For classical models, we implement the pipeline described in Algorithm 1 using NumPy , SciPy (sparse Lanczos via scipy.sparse.linalg.eigsh ), and the powerlaw package [14] for MLE fitting. All experiments run on a single NVIDIA A100 GPU for neural networks and a 64-core AMD EPYC CPU for classical models. Spectral extraction adds less than 5% wall-clock ov erhead for ensembles and less than 12% for KNN Lapla- cian construction. B. Statistical Methodology T o ensure that our findings are not artifacts of a single random split, all α estimates are reported as mean ± standard deviation across 5 random seeds. For the α – κ correlation analysis, we compute both Pearson r and Spearman ρ with 95% bootstrap confidence intervals (10,000 resamples). W e use Kendall’ s τ to compare model selection rankings. For the nov el DT/LR/KNN mappings, we additionally report the KS p -value for the power -law fit to assess whether the spectral tail genuinely follows a power law rather than producing a coincidental fit. V I . R E S U LT S A. Spectral Signatur es Acr oss Model F amilies W e begin with the central empirical question: does the power -law exponent α reliably separate well-regularized models from overfit ones across architecturally diverse fam- ilies? T able II summarizes the spectral diagnostics for the intersection misclassification task. W ell-regularized models consistently yield ˆ α within or near the [2 , 4] range (mean 2 . 87 ± 0 . 34 across Good variants), while ov erfit variants show ˆ α < 2 or spectral collapse. The separation is not perfectly clean: ALBER T -Overfit yields ˆ α = 2 . 08 ± 0 . 21 , straddling the boundary , which reflects ALBER T’ s inher- ent regularization via cross-layer weight sharing. Similarly , SVM-Overfit ( ˆ α = 1 . 91 ± 0 . 18 ) shows a less dramatic drop than tree-based models, consistent with the margin- based implicit regularization of SVMs. Notably , Qwen2.5- 7B, applied zero-shot without any fine-tuning on crash data, yields ˆ α = 2 . 94 ± 0 . 12 squarely in the optimal range, with the highest expert agreement ( κ = 0 . 76 ) of any model despite having lower F1 than the fine-tuned BER T variants. This reinforces the finding from prior work [4] that LLMs exhibit stronger expert alignment, and shows that this alignment has a spectral correlate. The Decision T ree and KNN ov erfit variants validate our proposed mappings in a qualitati vely distinct way . An unbounded Decision T ree produces near-singleton leav es, collapsing the leaf size distribution into a degenerate spike. The KS test rejects the po wer-law hypothesis ( p < 0 . 01 ) for these collapsed spectra, confirming that the breakdown is de- tectable. Similarly , K = 1 KNN shatters the Graph Laplacian into disconnected components despite strict deduplication. B. V alidation of Novel Spectral Mappings The results abov e include three model families whose spectral mappings are no vel to this work. A natural concern is whether the DT , LR, and KNN mappings produce genuinely informativ e spectra rather than coincidental po wer-law fits. T able III addresses this by reporting KS p -values and fitted α 1 2 3 4 5 6 7 8 9 10 11 12 2 4 Layer Index α BER T: Layer-wise α (median seed; bands = min/max ov er 5 seeds) Good (median) Overfit (median) 1 2 3 4 5 6 7 8 9 10 11 12 2 4 Layer Index α ALBER T: Layer-wise α (shared weights; bands = min/max ov er 5 seeds) Good (median) Overfit (median) Fig. 2. Layer -wise α for BER T (top) and ALBER T (bottom). Shaded band = optimal range [2 , 4] ; colored bands = min/max across 5 seeds. ALBER T’ s shared weights produce more uniform α with tighter variance. across both tasks. For well-regularized v ariants, the power- law hypothesis is not rejected at the 0.1 lev el in 5 of 6 cases (the exception being KNN-Good on AIM, p = 0 . 08 , marginal). For ov erfit v ariants, the power -law fit is consis- tently rejected for DT and KNN (spectral collapse), while LR-Overfit shows a borderline fit ( p = 0 . 09 ) with α well below 2. These results provide initial empirical support for the proposed mappings, though we caution that validation on additional datasets is needed before these can be considered established (see Section VII). C. Layer-W ise Spectral Analysis for Neural Networks Having established the cross-family spectral signatures, we no w examine the internal structure of the two neural network families in greater detail. Figure 2 presents the layer-wise α distribution for BER T and ALBER T under good and overfit training regimes, showing the median seed with min/max bands across 5 seeds. ALBER T’ s cross-layer parameter sharing provides natural regularization, producing more uniform α values across layers and making its spectral signature more robust to overfitting. This consistency aligns with its observed superior expert agreement reported in [4]. D. XGBoost Spectral Analysis For ensemble models, the spectral structure manifests differently . Figure 3 sho ws schematic ESDs of the correlation matrix derived from the OOF mar gin increment matrix for good and overfit XGBoost models. W e note that these are illustrativ e representations of the empirical spectral structure; the actual ESDs are computed from the T × T correlation matrix eigen values and fitted via MLE. The well-regularized model exhibits a smooth power-la w tail with α = 2 . 34 , while the overfit model displays prominent correlation traps as isolated spikes beyond the MP bulk edge. T ABLE II S P EC T R A L D I AG NO S T I CS A N D C L A S SI FI C A T I O N P E R FO R M A NC E F O R I N T ER S E C TI O N M I S C LA S S I FIC A T I O N D E T EC T I ON ( M E A N ± S T D OV E R 5 S E E DS ) . K S p : P O WE R - LAW G O OD N E S S - O F - FIT p - V A L UE . † : N OV E L S P E CT R A L M A P PI N G P R OP O S ED I N T H I S W O RK . Model Family Regime Matrix ˆ α KS p T raps F1 A UC κ (Expert) BER T Good W eight 2 . 87 ± 0 . 14 0.42 0 . 4 ± 0 . 5 . 874 ± . 008 . 936 ± . 005 . 68 ± . 03 BER T Overfit-Epochs W eight 1 . 74 ± 0 . 19 0.18 4 . 8 ± 1 . 3 . 862 ± . 011 . 921 ± . 007 . 54 ± . 04 ALBER T Good W eight 3 . 12 ± 0 . 09 0.61 0 . 2 ± 0 . 4 . 868 ± . 007 . 929 ± . 004 . 73 ± . 02 ALBER T Overfit-Epochs W eight 2 . 08 ± 0 . 21 0.14 1 . 8 ± 0 . 8 . 859 ± . 009 . 918 ± . 006 . 61 ± . 04 Qwen2.5-7B Zero-shot W eight 2 . 94 ± 0 . 12 0.52 0 . 6 ± 0 . 5 . 781 ± . 010 . 872 ± . 007 . 76 ± . 03 XGBoost Good OOF Incr . 2 . 34 ± 0 . 17 0.38 0 . 2 ± 0 . 4 . 851 ± . 006 . 922 ± . 004 . 62 ± . 03 XGBoost Overfit OOF Incr . 1 . 62 ± 0 . 22 0.11 6 . 6 ± 1 . 8 . 843 ± . 009 . 910 ± . 006 . 49 ± . 05 Random Forest Good OOB Incr . 2 . 51 ± 0 . 20 0.35 1 . 0 ± 0 . 7 . 844 ± . 007 . 917 ± . 005 . 60 ± . 03 Random Forest Overfit OOB Incr . 1 . 71 ± 0 . 25 0.12 5 . 8 ± 2 . 0 . 836 ± . 010 . 905 ± . 007 . 47 ± . 05 Logistic Reg. † Good ( L 2 ) Hessian 3 . 21 ± 0 . 31 0.29 0 . 0 ± 0 . 0 . 812 ± . 005 . 881 ± . 004 . 56 ± . 03 Logistic Reg. † Overfit Hessian 1 . 68 ± 0 . 38 0.09 7 . 4 ± 2 . 3 . 795 ± . 008 . 865 ± . 006 . 42 ± . 04 Decision Tree † Good (Pruned) Leaf Aff. 2 . 62 ± 0 . 28 0.22 1 . 6 ± 1 . 1 . 783 ± . 012 . 854 ± . 008 . 51 ± . 04 Decision Tree † Overfit Leaf Aff. Collapse < 0.01 — . 771 ± . 015 . 839 ± . 010 . 39 ± . 05 KNN † Good ( K = 15 ) Laplacian 2 . 78 ± 0 . 24 0.19 1 . 2 ± 0 . 8 . 791 ± . 009 . 845 ± . 006 . 50 ± . 04 KNN † Overfit ( K = 1 ) Laplacian Collapse < 0.01 — . 760 ± . 014 . 819 ± . 009 . 38 ± . 05 SVM Good (Linear) Kernel 3 . 48 ± 0 . 26 0.33 0 . 8 ± 0 . 8 . 829 ± . 006 . 901 ± . 005 . 58 ± . 03 SVM Overfit ( C = 10 3 ) Kernel 1 . 91 ± 0 . 18 0.13 3 . 6 ± 1 . 5 . 822 ± . 008 . 894 ± . 006 . 46 ± . 04 Collapse: degenerate spectra (Dirac at λ = 1 for DT; fragmented zero-eigenv alue clusters for KNN) where power-law fitting is rejected (KS p < 0 . 01 ). T ABLE III P OW E R - L AW FI T V A L I DA T I O N F O R N OV E L S P E CT R A L M A P PI N G S ( † ) AC RO S S B OT H TA SK S . K S p > 0 . 1 I N DI C A T E S T H E P O WE R - LAW H Y PO TH E S I S I S N OT R E J E CT E D . Model † T ask Regime ˆ α KS p Logistic Reg. INT Good 3 . 21 ± 0 . 31 0.29 Logistic Reg. INT Overfit 1 . 68 ± 0 . 38 0.09 Logistic Reg. AIM Good 3 . 15 ± 0 . 27 0.31 Logistic Reg. AIM Overfit 1 . 72 ± 0 . 35 0.08 Decision Tree INT Good 2 . 62 ± 0 . 28 0.22 Decision Tree INT Overfit Collapse < 0.01 Decision Tree AIM Good 2 . 55 ± 0 . 25 0.18 Decision Tree AIM Overfit Collapse < 0.01 KNN INT Good 2 . 78 ± 0 . 24 0.19 KNN INT Overfit Collapse < 0.01 KNN AIM Good 2 . 70 ± 0 . 22 0.08 KNN AIM Overfit Collapse < 0.01 E. Spectral Early Stopping Comparison W e next ev aluate whether the spectral exponent can serve as a practical training-time signal. Figure 4 compares the training trajectories of ˆ α and validation loss for BER T on the median seed. The spectral criterion ˆ α < 2 . 0 triggers at epoch 5, before v alidation loss degradation becomes apparent at epoch 7. T able IV quantifies this comparison across BER T , ALBER T , and XGBoost, the three families where per-step spectral extraction is computationally feasible. The joint criterion (loss OR α ) consistently matches or slightly underperforms validation-loss-only stopping on F1, but pro- duces models with higher ˆ α and, where measured, higher expert agreement. Notably , for ALBER T the α -stop fires later than validation-loss-stop (epoch 11.2 vs. 8.0), reflecting − 2 − 1 0 1 2 − 4 − 2 0 PL fit MP log 10 λ log 10 ρ ( λ ) Good ( α = 2 . 34 , 0 traps) − 2 0 2 − 4 − 2 0 traps log 10 λ log 10 ρ ( λ ) Overfit ( α = 1 . 62 , 7 traps) Fig. 3. Schematic ESD (log-log) of the XGBoost OOF correlation matrix. Left: well-regularized ( α = 2 . 34 , no traps). Right: ov erfit ( α = 1 . 62 , correlation traps visible as isolated spikes). MP distribution (dashed gray) serves as the null model. These are illustrative; actual α values are fitted via MLE on computed eigenv alues. ALBER T’ s inherent spectral stability from weight sharing. The spectral criterion is most valuable when validation loss plateaus while the model internally memorizes, a failure mode invisible to standard early stopping. F . Spectral Quality and Expert Agreement The preceding results establish that α separates good from ov erfit models and can guide early stopping. W e now turn to the motiv ating question: does spectral quality predict expert agreement better than standard metrics? Figure 5 plots ˆ α against Cohen’ s κ (expert agreement) across all archi- tectures, excluding the collapsed DT/KNN-Ov erfit v ariants and leaving n = 15 points. W e observe a strong positiv e correlation: Spearman ρ = 0 . 89 ( p < 0 . 001 ; 95% bootstrap CI: [0 . 74 , 0 . 96] ), Pearson r = 0 . 92 ( p < 0 . 001 ; 95% CI: [0 . 78 , 0 . 97] ). W e acknowledge that n = 15 is a limited sam- ple and the bootstrap CIs reflect this uncertainty , but the trend T ABLE IV E A RLY S T O PP I N G C O M P A R I S ON A CR O SS T H R EE M O D E L FA M IL I E S O N I N T TA S K ( M EA N ± S T D , 5 S E E DS ) . α - ST O P T R I GG E R S AT ˆ α < 2 . 0 . Model Criterion Stop Epoch/Round F1 ˆ α BER T V al. loss 7 . 2 ± 1 . 1 . 874 ± . 008 2 . 87 ± . 14 α < 2 . 0 5 . 4 ± 0 . 9 . 869 ± . 010 2 . 14 ± . 12 Joint 5 . 4 ± 0 . 9 . 871 ± . 009 2 . 14 ± . 12 None (20 ep.) 20 . 832 ± . 018 1 . 38 ± . 16 ALBER T V al. loss 8 . 0 ± 1 . 3 . 868 ± . 007 3 . 12 ± . 09 α < 2 . 0 11 . 2 ± 2 . 1 . 864 ± . 008 2 . 06 ± . 11 Joint 8 . 0 ± 1 . 3 . 868 ± . 007 3 . 12 ± . 09 XGBoost V al. loss 342 ± 48 . 851 ± . 006 2 . 34 ± . 17 α < 2 . 0 285 ± 61 . 847 ± . 008 2 . 08 ± . 15 Joint 285 ± 61 . 849 ± . 007 2 . 08 ± . 15 0 . 3 0 . 4 0 . 5 val-stop V al. Loss V al. loss (median seed) 0 5 10 15 20 1 2 3 α -stop α = 2 . 0 Epoch ˆ α ˆ α (median seed) Fig. 4. BER T training dynamics (median seed, INT task). T op: validation loss minimum at epoch 7. Bottom: ˆ α crosses below 2.0 at epoch 5, providing an earlier structural warning. is consistent across architecturally diverse model families. The inclusion of Qwen2.5-7B is particularly informative: as a decoder-only LLM applied zero-shot, it occupies the upper-right region of the plot (high α , high κ ), extending the correlation to a model class absent from the original analysis. This finding suggests that spectral quality captures aspects of model behavior , such as reliance on conte xtual features rather than spurious ke ywords, that align with expert rea- soning. It stands in direct contrast to the in verse accuracy– κ paradox reported in [4]. G. Model Selection: Spectral Ranking vs. Baselines The strong α – κ correlation motiv ates a practical question: can spectral information improve model selection for deploy- ment? T able V compares three strate gies on the INT task, ranking the 9 well-regularized models by cross-v alidated F1 alone, by validation loss, and by the composite spectral score (Eq. 6). The ground-truth ranking is determined by expert agreement ( κ ), and we report Kendall’ s τ rank correlation between each strategy and this ground truth. The spectral composite score achieves τ = 0 . 79 , substan- tially outperforming F1-only ( τ = 0 . 50 ) and validation loss ( τ = 0 . 43 ), confirming that incorporating structural quality information improv es model selection when expert alignment matters more than raw accuracy . T o assess sensitivity to the weight parameters in Eq. 6, we performed a grid search over w 1 , w 2 ∈ 1 1 . 5 2 2 . 5 3 3 . 5 4 0 . 4 0 . 6 0 . 8 ρ = 0 . 87 Solid = Good; F aded = Overfit ˆ α (mean over 5 seeds) Cohen’ s κ (Expert) BER T ALBER T XGBoost Rand. Forest Log. Reg. Dec. Tree KNN SVM Qwen2.5 Fig. 5. Spectral quality ( ˆ α ) vs. expert agreement ( κ ) across all model families ( n = 15 ; DT/KNN-Overfit excluded due to collapsed spectra). Spearman ρ = 0 . 89 ( p < 0 . 001 ; 95% bootstrap CI: [0 . 74 , 0 . 96] ). Shaded region = optimal α range. Qwen2.5-7B (zero-shot) occupies the upper-right quadrant. T ABLE V M O DE L S E L EC T I ON R A N K IN G C O M P A R I S ON O N I N T TA SK . K E N DA LL ’ S τ M E A SU R E S R A N K C O RR E L A T I ON W I T H E X P ERT A GR E E M EN T ( κ ) AC RO S S 9 W E L L - R E G U LA R I ZE D M O D EL S . Selection Strategy Kendall’ s τ vs. κ Cross-validated F1 0.50 V alidation loss 0.43 Spectral composite (Eq. 6) 0.79 { 0 . 2 , 0 . 3 , 0 . 4 , 0 . 5 , 0 . 6 } (with w 3 = 0 . 02 fixed). The spectral score achie ves τ > 0 . 70 for all configurations where w 2 ≥ 0 . 3 , indicating that the ranking is robust as long as spectral quality receives non-trivial weight. The chosen w 1 = w 2 = 0 . 4 is near-optimal but not uniquely so. H. Cr oss-T ask Generalization An important practical consideration is whether the spec- tral quality signal is task-specific or transfers across prob- lems. T able VI presents spectral diagnostics for well- regularized models across both crash classification tasks. The α values are remarkably consistent (mean absolute difference 0 . 13 ± 0 . 07 ), confirming that the spectral quality signal generalizes across different transportation safety applications without task-specific calibration. I. Lanczos Conver gence and Computational Overhead Finally , we verify that the spectral extraction itself is computationally practical. T able VII reports the spectral extraction time for each model family on the AIM dataset ( N = 371 , 062 ). For KNN, the sparse Lanczos method con ver ges (relati ve eigenv alue change < 10 − 4 ) within 35 iterations on av erage, well within our b udget of 50. Across all model families, the total spectral extraction o verhead remains modest relativ e to training time, ranging from less than 0.1% for Decision Trees to 11.3% for KNN. V I I . D I S C U S S I O N A N D C O N C L U S I O N W e hav e presented a spectral diagnostic frame work grounded in Random Matrix Theory for ev aluating crash T ABLE VI S P EC T R A L D I AG NO S T I CS A CR O SS TA SK S F O R W E L L - R E G UL A R I ZE D M O DE L S ( M E A N ± S T D , 5 S E E DS ) . I N T: I N T E RS E C T IO N M I SC L A S SI FI C A T I O N ; A I M : A L C OH O L I N F E RE N C E M I S MAT CH . Model T ask ˆ α T raps F1 BER T INT 2 . 87 ± 0 . 14 0 . 4 ± 0 . 5 . 874 ± . 008 BER T AIM 2 . 71 ± 0 . 16 1 . 0 ± 0 . 7 . 862 ± . 009 ALBER T INT 3 . 12 ± 0 . 09 0 . 2 ± 0 . 4 . 868 ± . 007 ALBER T AIM 2 . 94 ± 0 . 11 0 . 4 ± 0 . 5 . 855 ± . 008 Qwen2.5-7B INT 2 . 94 ± 0 . 12 0 . 6 ± 0 . 5 . 781 ± . 010 Qwen2.5-7B AIM 2 . 88 ± 0 . 14 0 . 8 ± 0 . 8 . 769 ± . 011 XGBoost INT 2 . 34 ± 0 . 17 0 . 2 ± 0 . 4 . 851 ± . 006 XGBoost AIM 2 . 18 ± 0 . 19 1 . 2 ± 0 . 8 . 837 ± . 007 Rand. Forest INT 2 . 51 ± 0 . 20 1 . 0 ± 0 . 7 . 844 ± . 007 Rand. Forest AIM 2 . 39 ± 0 . 22 1 . 4 ± 0 . 9 . 831 ± . 008 Log. Reg. INT 3 . 21 ± 0 . 31 0 . 0 ± 0 . 0 . 812 ± . 005 Log. Reg. AIM 3 . 15 ± 0 . 27 0 . 2 ± 0 . 4 . 801 ± . 006 Dec. Tree INT 2 . 62 ± 0 . 28 1 . 6 ± 1 . 1 . 783 ± . 012 Dec. Tree AIM 2 . 55 ± 0 . 25 1 . 2 ± 0 . 8 . 770 ± . 013 KNN INT 2 . 78 ± 0 . 24 1 . 2 ± 0 . 8 . 791 ± . 009 KNN AIM 2 . 70 ± 0 . 22 1 . 6 ± 1 . 0 . 782 ± . 010 T ABLE VII S P EC T R A L E X TR AC T I O N C O ST O N A I M D A TA SE T . T R A I NI N G T I ME E X CL U D E S H Y PE R PAR A M E TE R S E AR C H . Q W E N 2 . 5 - 7B I S U S E D Z E RO - S H OT ( N O T R A I NI N G ); S P E C TR A L T I M E R E FL EC T S W E IG H T M A T R I X E X T R AC TI O N A N D E I GE N D E CO M P OS I T I ON . Model T rain Time Spectral Time Overhead BER T 4.2 h 12 min 4.8% ALBER T 3.8 h 11 min 4.8% Qwen2.5-7B — 18 min — XGBoost 18 min 0.8 min 4.4% Random Forest 22 min 0.9 min 4.1% Logistic Reg. 3 min 0.2 min 6.7% Decision Tree 1 min < 1 s < 0.1% KNN 8 min 0.9 min 11.3% SVM 45 min 1.2 min 2.7% classification models in transportation safety . By extracting the power -law exponent α from model-specific empirical spectral densities, we provide a structural quality metric that spans deep learning, ensembles, parametric models, partition models, and instance-based models, as well as a zero-shot decoder-only LLM (Qwen2.5-7B). The experimental evi- dence shows that well-regularized models consistently yield ˆ α ∈ [2 , 4] regardless of architecture, while overfit v ariants show ˆ α < 2 or spectral collapse. The spectral exponent cor- relates strongly with expert agreement (Spearman ρ = 0 . 89 ), more so than accuracy or F1, and a composite spectral model selection score better predicts e xpert agreement rankings than F1-only or v alidation-loss-only selection (Kendall’ s τ = 0 . 79 vs. 0 . 50 and 0 . 43 ). A natural question is whether simple hyperparameter tun- ing achieves the same result. T raditional regularization, how- ev er , requires labeled validation data to benchmark improve- ments. In transportation datasets where crash records contain systematic labeling errors [3] and accuracy is in versely re- lated to expert agreement [4], standard tuning often optimizes tow ard memorizing noisy labels. The spectral diagnostic ˆ α serves as a structural signal that is complementary to, not a replacement for, standard validation. Sev eral limitations should be noted. The optimal α range [2 , 4] is derived from empirical observations across di verse architectures [5] and may require domain-specific calibra- tion; our results are consistent with this range on two crash tasks, but generalization to severity prediction or pedestrian crash detection remains to be validated. The novel spectral mappings for Logistic Regression, Decision T rees, and KNN are empirically supported on two tasks (T able III) but hav e not been validated at the same scale as the neural network and XGBoost diagnostics in the HTSR literature, and the KNN mapping in particular shows a marginal KS p -value on the AIM task ( p = 0 . 08 ). The α – κ correlation is computed on n = 15 model-regime pairs; while the bootstrap CI is reasonably tight ( [0 . 74 , 0 . 96] ), validation on additional datasets would strengthen the claim. The XGBoost spectral extension relies on Martin and Prakash [11], which remains in preprint form, and the spectral early stopping criterion was ev aluated on only three model families. W e recommend that practitioners track ˆ α alongside val- idation loss during training, conduct pre-deployment spec- tral audits flagging models with ˆ α < 2 . 0 or spectral collapse, and use the composite spectral score for model selection when expert agreement data is av ailable for cal- ibration. Future work will v alidate the novel mappings on additional crash datasets, extend the frame work to se verity prediction and pedestrian crash detection, and in vestigate whether ˆ α correlates with model fairness across demo- graphic subgroups. Code for the spectral extraction pipeline is av ailable at https://github.com/[redacted] /rmt- crash- diagnostics . A C K N O W L E D G M E N T S This research was supported by the Iow a State Univ ersity Department of Civil, Construction and Environmental Engi- neering. The authors thank Charles H. Martin for dev eloping the W eightW atcher tool and the SETOL theory . R E F E R E N C E S [1] W orld Health Organization, “Global Status Report on Road Safety 2023, ” https://www .who.int/publications/i/item/9789240086517, 2023. [2] S. Bhagat, I. F . Shihab, and J. W ood, “Identification of potentially misclassified crash narratives using machine learning (ml) and deep learning (dl), ” arXiv preprint , 2025. [3] S. Bhagat, R. Kandiboina, I. F . Shihab, S. Knickerbocker , N. Hawkins, and A. Sharma, “Unlocking insights addressing alcohol infer- ence mismatch through database-narrative alignment, ” arXiv preprint arXiv:2506.19342 , 2025. [4] S. R. Bhagat, I. F . Shihab, and A. Sharma, “ Accuracy is not agreement: expert-aligned ev aluation of crash narrativ e classification models, ” arXiv preprint arXiv:2504.13068 , 2025. [5] C. H. Martin, T . Peng, and M. W . Mahoney , “Predicting Trends in the Quality of State-of-the-Art Neural Networks without Access to T raining or T esting Data, ” Nature Communications , vol. 12, no. 1, p. 4118, 2021. [6] C. H. Martin and M. W . Mahoney , “Traditional and Heavy-T ailed Self Regularization in Neural Network Models, ” in International Confer ence on Machine Learning . PMLR, 2019, pp. 4284–4293. [7] ——, “Implicit Self-Regularization in Deep Neural Networks: Evi- dence from Random Matrix Theory and Implications for T raining, ” Journal of Machine Learning Researc h , vol. 22, no. 165, pp. 1–73, 2021. [8] V . A. Marchenko and L. A. Pastur, “Distribution of Eigen values for Some Sets of Random Matrices, ” Mathematics of the USSR-Sbornik , vol. 1, no. 4, pp. 457–483, 1967. [9] C. H. Martin, “SETOL: A Semi-Empirical Theory of (Deep) Learn- ing, ” arXiv preprint , 2025. [10] T . Chen and C. Guestrin, “XGBoost: A Scalable Tree Boosting System, ” in Proceedings of the 22nd ACM SIGKDD International Confer ence on Knowledge Discovery and Data Mining , 2016, pp. 785– 794. [11] C. H. Martin and H. K. Prakash, “Extending W eightW atcher Spectral Diagnostics to XGBoost Models via SETOL, ” arXiv preprint , 2024, pre-release; cited with caution. [12] C. H. Martin, “W eightW atcher: An Open-Source T ool for Predicting DNN Quality without Training or T est Data, ” https://weightwatcher .ai, 2024. [13] A. Clauset, C. R. Shalizi, and M. E. J. Newman, “Power -Law Distributions in Empirical Data, ” SIAM Review , vol. 51, no. 4, pp. 661–703, 2009. [14] J. Alstott, E. Bullmore, and D. Plenz, “powerla w: A Python Package for Analysis of Heavy-T ailed Distributions, ” PLoS ONE , vol. 9, no. 1, p. e85777, 2014. [15] J. H. Friedman, “Greedy Function Approximation: A Gradient Boost- ing Machine, ” Annals of Statistics , vol. 29, no. 5, pp. 1189–1232, 2001. [16] L. Breiman, “Random Forests, ” Machine Learning , vol. 45, no. 1, pp. 5–32, 2001. [17] J. Martens, “New Insights and Perspectives on the Natural Gradient Method, ” Journal of Machine Learning Research , vol. 21, no. 146, pp. 1–76, 2020. [18] S. Ubaru, J. Chen, and Y . Saad, “Fast Estimation of tr ( f ( A )) via Stochastic Lanczos Quadrature, ” vol. 38, no. 4, 2017, pp. 1075–1099. [19] J. Devlin, M.-W . Chang, K. Lee, and K. T outanov a, “BERT : Pre- training of Deep Bidirectional T ransformers for Language Understand- ing, ” in Proceedings of NAA CL-HLT , 2019, pp. 4171–4186. [20] Z. Lan, M. Chen, S. Goodman, K. Gimpel, P . Sharma, and R. Soricut, “ ALBER T: A Lite BER T for Self-supervised Learning of Language Representations, ” in International Conference on Learning Represen- tations , 2020. [21] A. Y ang, B. Y ang, B. Zhang, B. Hui, B. W ang, B. Zheng, B. Y u, C. Li, D. Liu, F . Huang et al. , “Qwen2.5 T echnical Report, ” arXiv preprint arXiv:2412.15115 , 2025. [22] T . W olf, L. Debut, V . Sanh, J. Chaumond, C. Delangue, A. Moi, P . Cistac, T . Rault, R. Louf, M. Funtowicz et al. , “Transformers: State- of-the-Art Natural Language Processing, ” in Pr oceedings of the 2020 Confer ence on Empirical Methods in Natural Language Processing: System Demonstrations , 2020, pp. 38–45.
Original Paper
Loading high-quality paper...
Comments & Academic Discussion
Loading comments...
Leave a Comment