Adaptive Weighting for Time-to-Event Continual Reassessment Method: Improving Safety in Phase I Dose-Finding Through Data-Driven Delay Distribution Estimation
Background: Phase I dose-finding trials increasingly encounter delayed-onset toxicities, especially with immunotherapies and targeted agents. The time-to-event continual reassessment method (TITE-CRM) handles incomplete follow-up using fixed linear w…
Authors: Robert Amevor, Emmanuel Kubuafor, Dennis Baidoo
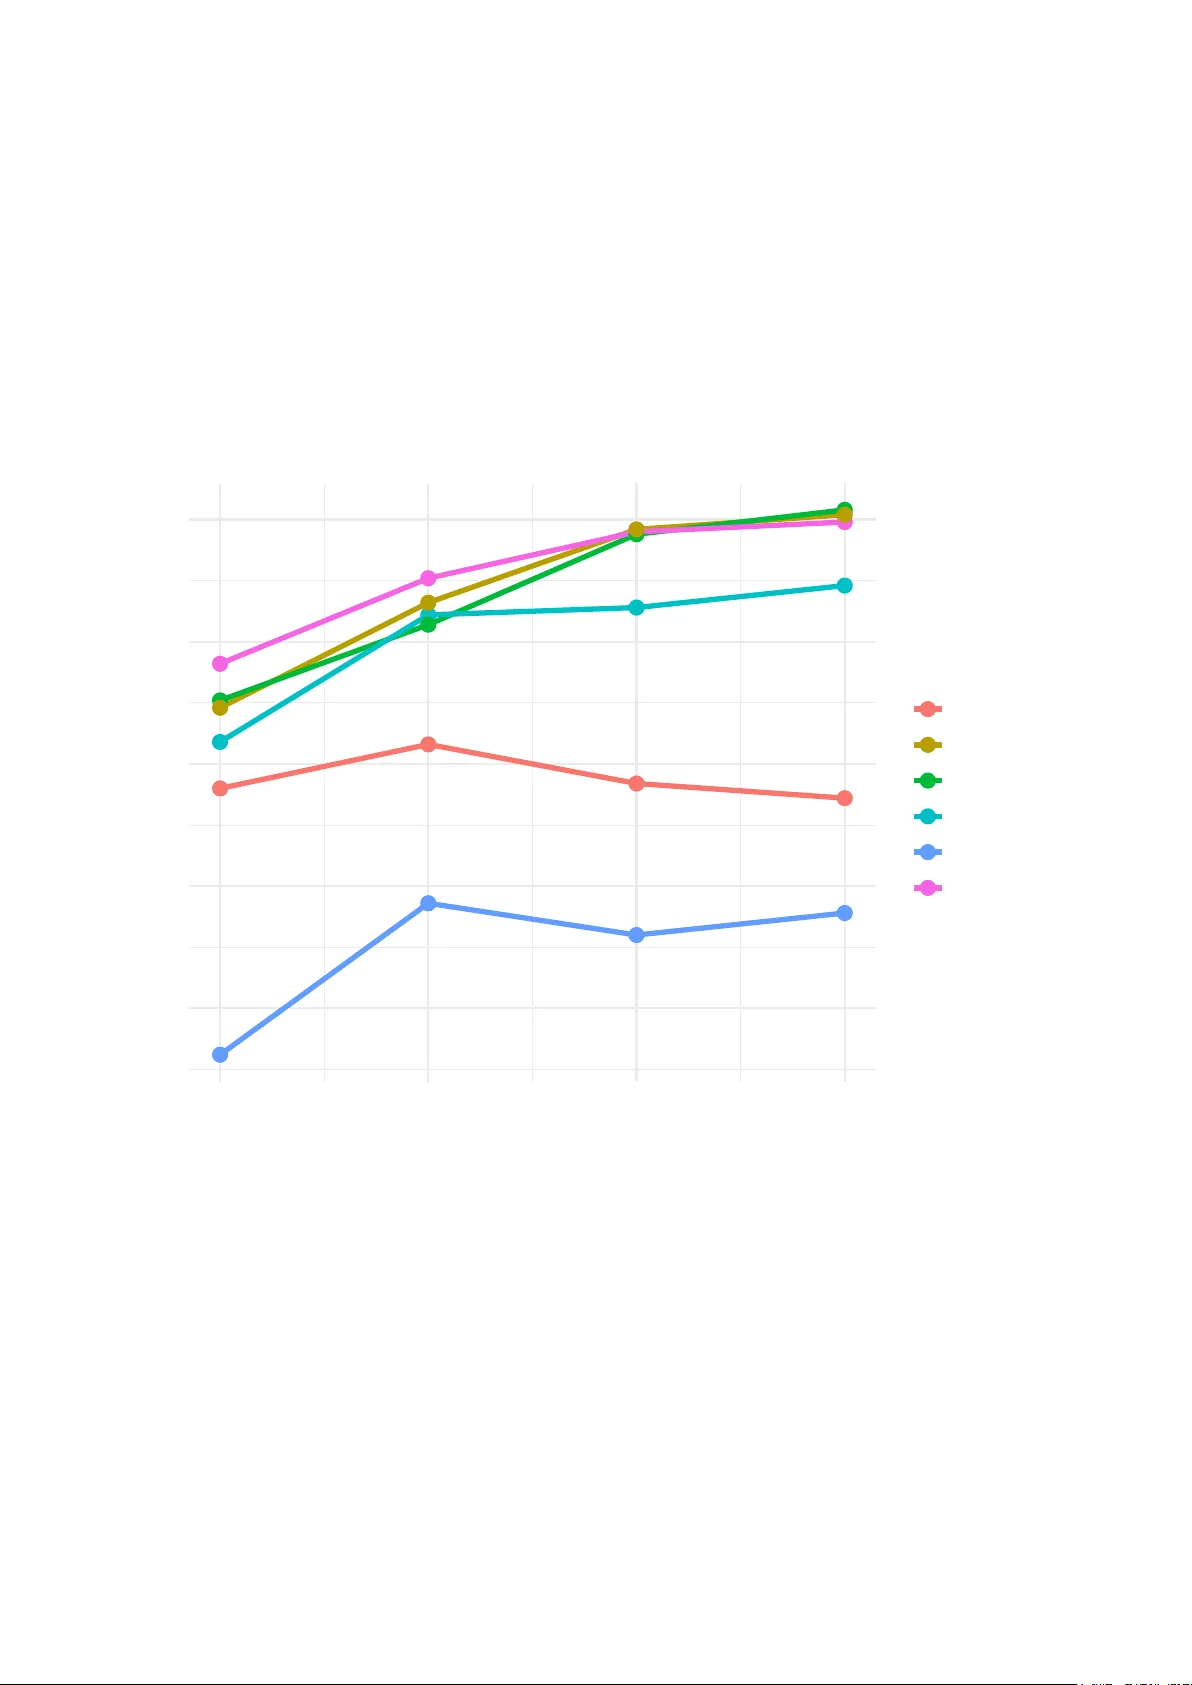
A daptiv e W eigh ting for Time-to-Ev en t Con tin ual Reassessmen t Metho d: Impro ving Safet y in Phase I Dose-Finding Through Data-Driv en Dela y Distribution Estimation Rob ert Amev or 1* Emman uel Kubuafor 2 Dennis Baido o 2 1 Departmen t of Biostatistics and Epidemiology , Univ ersit y of South Carolina 2 Departmen t of Mathematics and Statistics, Univ ersit y of New Mexico Corresp ondence: ramev or@email.sc.edu Abstract Bac kground: Phase I dose-finding trials increasingly encounter delay ed-onset to xicities, esp ecially with imm unotherapies and targeted agen ts. The time-to-ev en t con tin ual re- assessmen t method (TITE-CRM) handles incomplete follo w-up using fixed linear weigh ts, but this ad ho c approac h do esn’t reflect actual dela y patterns and may exp ose patients to excessiv e risk during dose escalation. Metho ds: W e replace TITE-CRM’s fixed weigh ts with adaptiv e weigh ts, p osterior pre- dictiv e probabilities deriv ed from the evolving toxicit y dela y distribution. Under a W eibull timing mo del, w e get closed-form weigh t up dates through maximum lik eliho o d estimation, making real-time implementation straightfo rward. W e tested our metho d (A W-TITE) against TITE-CRM and standard designs (3+3, mTPI, BOIN) across three dose-toxicit y 1 scenarios through sim ulation (N = 30 patien ts, 2,000 replications). W e also examined robustness across v arying accrual rates, sample sizes, shap e parameters, observ ation win- do ws, and priors. Results: Our A W-TITE reduced patient ov erdosing b y 40.6% compared to TITE-CRM (mean fraction ab ov e MTD: 0.202 vs 0.340; 95% CI: − 0 . 210 to − 0 . 067 , p < 0.001) while main taining comparable MTD selection accuracy (mean difference: +0.023, p = 0.21). Against algorithm-based metho ds, A W-TITE achiev ed higher MTD identification: +32.6% vs mTPI, +19.8% vs 3+3, and +5.6% vs BOIN. P erformance remained robust across all sensitivit y analyses. Conclusions: A daptiv e w eigh ting offers a practical wa y to improv e Phase I trial safet y while preserving MTD selection accuracy . The method requires minimal computation and is ready for real-time use. Keyw ords: Phase I trial; dose-finding; contin ual reassessment metho d; delay ed to xicit y; time-to-ev en t; adaptiv e w eigh ting Problem Dela y ed to xicit y Fixed w eigh ts Ov er-aggressiv e TITE-CRM w = t/T max (Linear, ad ho c) A W-TITE w = Pr( DL T | t, D ) (A daptiv e, data-driv en) Results 40.6% reduction in o v erdosing A ccuracy main tained Robust across scenarios Impact Safer Phase I trials Closed-form, < 1 sec computation Readily implemen table OUR INNO V A TION Figure 1: Graphical Abstract. Adaptiv e weigh ting replaces TITE-CRM’s fixed linear weigh ts with data-driv en p osterior predictiv e probabilities derived from the ev olving to xicit y delay distribution. This innov ation reduces patien t ov erdosing b y 40.6% while maintaining MTD selection accuracy , com- putational simplicit y , and practical implemen tabilit y . 2 1 In tro duction Phase I dose-finding trials seek to identify the maxim um tolerated dose (MTD), the dose whose probabilit y of dose-limiting toxicit y (DL T) is closest to a prespecified target while minimizing patien t exp osure to o verly to xic doses. Most traditional designs suc h as the 3+3 rule ha ve b een widely criticized for p o or statistical prop erties and ethical concerns ( Le T ourneau et al. , 2009 ; Rogatk o et al. , 2007 ). Mo del-based metho ds, particularly the con tinual reassessment metho d (CRM) ( O’Quigley et al. , 1990 ), enhance p erformance by contin uously up dating dose-to xicit y estimates and making statistically principled dose assignments. A fundamen tal assumption of the CRM is that to xicit y assessmen t is rapid relative to pa- tien t accrual. In practice, ho w ev er, man y mo dern oncology agen ts, including immunotherapies, targeted therapies, and nov el com bination regimens,pro duce dela y ed-onset toxicities that ma y not manifest until w eeks or months after treatmen t initiation ( Doussau et al. , 2016 ; P ostel- Vina y et al. , 2016 ). W aiting for a complete to xicity assessments b efore enrolling the next patien t substan tially prolongs the trials duration and dela ys access to promising therapies. Con v ersely , making dosing decisions with incomplete follow-up information risks exp osing pa- tien ts to excessive toxicit y if interim data inadequately reflect ev entual outcomes. 1.1 Time-to-Ev en t CRM and Its Limitations The time-to-ev ent contin ual reassessment metho d (TITE-CRM) ( Cheung and Chapp ell , 2000 ) tries to solve the dela yed toxicit y problem b y using w eigh ted lik eliho o d contributions. Here’s ho w it w orks: if a patien t has been follo w ed for time t < T max without a DL T, TITE-CRM assigns them a fixed linear w eight w = t/T max . This essentially treats their observ ation as a “fractional non-even t.” P atients with observ ed DL T s get weigh t 1, and those who complete follo w-up with no DL T get weigh t 0. TITE-CRM has b een widely adopted in practice ( Braun , 2002 ; W ages et al. , 2018 ), and for go o d reason: it’s computationally simple and lets trials keep enrolling without w aiting for complete follow-up. But there’s a problem: the linear weigh ting sc heme t/T max is fundamentally ad ho c. It implicitly assumes that, the probability of even tual toxicit y decreases linearly with elapsed follow-up time. This assumption rarely holds in practice and has no probabilistic justification. 3 Think ab out what this means. Whether to xicities o ccur predominan tly early (say , weeks 1–3) or late (w eeks 8–12), TITE-CRM uses the same linear weigh t. A patient follow ed for 4 w eeks con tributes exactly one-third of the information (w eigh t = 4/12), regardless of when to xicities actually tend to occur. When the true dela y distribution deviates from this linear assumption, the weigh ts can substan tially misrepresent what partial observ ations actually tell us. 1.2 Consequences of Missp ecified W eigh ts Inappropriate weigh ting of partial follo w-up data has direct consequences for patient safet y and trial efficiency . If partial non-ev en ts are ov erweig h ted early in the trial, as o ccurs when toxicities are predominan tly late-onset but linear weigh ts assign substantial information to brief follo w- up perio ds, the design ma y escalate to o aggressiv ely , exp osing patien ts to excessiv e to xicit y . Con v ersely , underw eighting informative partial observ ations when toxicities o ccur early leads to o verly conserv ative dose escalation and inefficient trials. These concerns are not merely theoretical. Recent analyses ha v e demonstrated that TITE- CRM p erformance degrades substan tially when the true to xicit y timing distribution deviates from the implicit assumptions of linear w eigh ting ( Y uan and Yin , 2011 ). In trials with het- erogeneous patien t p opulations or time-v arying hazards, the disconnect b etw een fixed weigh ts and actual toxicit y risk becomes particularly pronounced. 1.3 Our Con tribution: A daptive Predictive W eigh ting W e prop ose adaptiv e-w eigh t TITE-CRM (A W-TITE), which replaces fixed linear weigh ts with p osterior predictive probabilities of ev en tual toxicit y . F or a patien t with t units of follo w-up and no observed DL T, w e compute w i = Pr( T ≤ T max | T > t, D current ) (1) where D current denotes data observ ed th us far in the trial. This weigh t represen ts the proba- bilit y that the patient will even tually experience a DL T b y the end of the assessmen t windo w, conditional on not having exp erienced one by time t and on the dela y distribution estimated 4 from accum ulating trial data. Under a parametric W eibull mo del for time-to-toxicit y , these weigh ts admit closed-form computation via maxim um likelihoo d or conjugate Ba y esian up dating. The resulting metho d preserv es the familiar CRM framew ork while allo wing partial observ ations to contribute in a manner that is b oth data-driv en and probabilistically interpretable. Imp ortantly , adaptiv e w eigh ts naturally adjust to observ ed delay patterns: when to xicities o ccur predominan tly early , brief follo w-up receiv es lo w weigh t; when to xicities are late-onset, the metho d appropriately increases w eights for longer follo w-up p erio ds. 1.4 Ob jectiv es and Organization Our ob jectiv es are threefold. First, we develop the statistical framew ork for adaptiv e weigh ting under a parametric time-to-to xicit y models, deriv e closed-form up dates, and establish practical implemen tation guidelines. Second, we conduct a comprehensive simulation studies compar- ing A W-TITE to TITE-CRM and established algorithm-based designs (3+3, mTPI, BOIN) across realistic dose-toxicit y scenarios. Third, w e assess robustness through extensiv e sensitiv- it y analyses, b y examining accrual rates, sample sizes, distributional assumptions, and prior sp ecifications. The remainder of this paper is organized as follo ws. Section 2 presen ts our metho dological dev elopmen t of A W-TITE, including the W eibull timing mo del, closed-form w eigh t computa- tions, and practical implemen tation details. Section 3 describ es the sim ulation study design. Section 4 presen ts op erating c haracteristics and comparative p erformance. Section 5 rep orts the sensitivity analyses. Section 6 discusses implications for practice and the directions for future researc h. 2 Metho ds 2.1 T rial Setting and Notation W e consider a Phase I dose-finding trial with K presp ecified dose lev els d 1 < · · · < d K . F or patien t i , let T i denote the time from dose administration to the o ccurrence of a dose-limiting to xicit y (DL T), with a maxim um observ ation windo w T max . The binary endp oin t of interest is 5 Y i = I ( T i ≤ T max ) , indicating whether a DL T o ccurs within the observ ation window. P atien ts accrue sequen tially ov er calendar time, and at in terim decision p oints many patients ma y ha v e incomplete follo w-up. The ob jective is to identify the maximum tolerated dose (MTD), defined as the dose whose probabilit y of DL T is closest to a presp ecified target toxicit y lev el p ∗ (e.g., p ∗ = 0 . 25 ), while limiting the num b er of patien ts treated at o v erly toxic doses. 2.2 Standard Con tin ual Reassessmen t Metho d The CRM mo dels the probabilit y of DL T at dose d k as π k ( α ) = π exp( α ) 0 k (2) where { π 01 , . . . , π 0 K } is a presp ecified sk eleton and α is an unknown parameter. A prior distri- bution is placed on α , and p osterior inference is up dated sequentially as data accrue. A t eac h decision p oint, the next patien t is assigned to the dose whose p osterior mean DL T probability is closest to the target p ∗ , sub ject to standard safety constrain ts (e.g., no skipping of un tried doses). 2.3 TITE-CRM with Fixed Linear W eigh ts T o accommo date delay ed toxicit y , TITE-CRM incorp orates partial follo w-up information through fixed weigh ts. F or a patient with no observed DL T b y follo w-up time t i < T max , the likelihoo d con tribution is weigh ted b y w TITE i = t i T max (3) P atien ts with observed DL T s receive weigh t 1, and those with complete follow-up and no DL T receiv e w eight 0. The weigh ted log-lik eliho o d for the CRM dose-to xicit y parameter α is ℓ ( α ) = X j y j log π d j ( α ) + (1 − y j ) w j log(1 − π d j ( α )) (4) where y j ∈ { 0 , 1 } indicates observ ed DL T for patien t j assigned to dose d j . While computationally simple, this linear w eighting sc heme implicitly assumes uniform 6 hazard o ver time and has no probabilistic justification. 2.4 A daptiv e-W eigh t TITE-CRM (A W-TITE) 2.4.1 A daptive Predictiv e W eights The key innov ation of A W-TITE is to replace the ad ho c linear weigh t b y the p osterior pre- dictiv e probabilit y that patient i will exp erience a DL T b y the end of the assessmen t window T max conditional on not ha ving had a DL T b y t i and on the data observ ed so far: w i = Pr( T ≤ T max | T > t i , D current ) = Z Pr( T ≤ T max | T > t i , θ ) p ( θ | D current ) d θ (5) where D current denotes data observ ed up to the curren t decision time and θ denotes parameters for the time-to-to xicit y distribution. When patien t i has already exp erienced a DL T w e set w i = 1 , and when patient i has completed full follo w-up with no DL T w e set w i = 0 . This w eight has clear probabilistic in terpretation: it q uan tifies the probability that the patien t will even tually con tribute a DL T, giv en their current censored observ ation and the accum ulated kno wledge ab out to xicit y timing. 2.4.2 W eibull Timing Mo del W e mo del time-to-to xicit y with a W eibull surviv al function whose scale parameter d ep ends on dose: S ( t | d, θ ) = exp {− λ ( d ) t γ } , t ≥ 0 (6) where γ > 0 is the W eibull shape parameter and λ ( d ) > 0 is a dose-sp ecific rate parameter. Under this mo del, the conditional probabilit y in the weigh t formula simplifies to w i = 1 − S ( T max | d i , θ ) S ( t i | d i , θ ) = 1 − exp {− λ ( d i )∆ i } (7) where ∆ i ≡ T γ max − t γ i . The p osterior predictiv e weigh t is therefore w i = 1 − Z exp {− λ ( d i )∆ i } p ( λ ( d i ) | D current ) dλ ( d i ) (8) 7 2.4.3 Maxim um Lik eliho o d Implementation F or computational simplicity and transparency , w e adopt a plug-in (maximum lik eliho o d) es- timator for λ ( d ) . With patients indexed b y j at dose d having observed contributions ( u j , δ j ) , where δ j ∈ { 0 , 1 } indicates observ ed DL T, the closed-form MLE for λ ( d ) under known γ is ˆ λ MLE ( d ) = P j δ j P j u γ j (9) The plug-in adaptive weigh t is then w plug-in i = 1 − exp {− ˆ λ MLE ( d i )∆ i } (10) 2.4.4 Ba yesian Implemen tation (Alternativ e) An alternative approach places a Gamma ( a, b ) prior on each λ ( d ) . If curren t data at dose d con tribute D observed DL T s and follow-up time sum S = P j u γ j , the p osterior is λ ( d ) | D ∼ Gamma ( a + D , b + S ) (11) Using the Laplace transform of the Gamma distribution, the p osterior predictive weigh t has closed form: w i = 1 − b + S b + S + ∆ i a + D (12) This Bay esian form ulation allows principled uncertain t y quantification but requires prior sp ec- ification. In our sim ulations, we found negligible practical differences b etw een MLE and p os- terior mean estimators for realistic priors and t ypical Phase I sample sizes. 2.4.5 Connection with TITE-CRM The TITE-CRM linear w eight t i /T max can b e interpreted as a heuristic information fraction un- der restrictiv e assumptions. T o clarify the relationship, consider a first-order T a ylor expansion of the adaptive weigh t under a small-hazard appro ximation: w i = 1 − exp {− λ ( d i )∆ i } ≈ λ ( d i )∆ i , (13) 8 where ∆ i = T γ max − t γ i . When γ = 1 , ∆ i = T max − t i , and if λ ( d i ) ≈ 1 /T max , then w i ≈ 1 − t i T max . (14) Th us, under these restrictive conditions, the adaptiv e w eight corresp onds to the c omplement of the TITE-CRM w eigh t. This highlights a fundamen tal distinction betw een the t wo approac hes. While the TITE- CRM weigh t t i /T max is an ad-ho c linear pro xy for partial information, the prop osed adaptive w eigh t represen ts a mo del-based predictiv e probabilit y of experiencing a DL T b y T max giv en surviv al to time t i . 2.5 Ho w to Use This in Y our T rial If y ou’re planning a Phase I trial with p otential delay ed toxicities, here’s ho w to implemen t A W-TITE: Step 1: Cho ose the shape parameter. W e recommend starting with γ = 2 . 0 , whic h reflects increasing hazard o ver time, t ypical for delay ed to xicities with immunotherapies and targeted agen ts. If y ou ha ve historical data from similar agents sho wing when to xicities o c- curred, y ou can fit a W eibull mo del to those times and use the resulting shap e estimate. Our sensitivit y analyses (Section 5 ) show p erformance is stable across γ ∈ { 1 . 5 , 2 . 0 , 2 . 5 , 3 . 0 } . Unless y ou ha ve strong evidence for something differen t, just use 2.0. Step 2: Set the observ ation windo w. F or most oncology settings, T max = 12 weeks works w ell. This captures the ma jority of dela y ed toxicities while k eeping trial duration reasonable. Our results (T able S3) sho w safety impro v emen ts plateau b eyond 12–14 w eeks an ywa y . Step 3: Use MLE for weigh t up dates. A t eac h decision p oint, estimate the dose-sp ecific rate parameters λ ( d ) using the closed-form MLE equation. Then compute adaptive weigh ts for patien ts with incomplete follow-up. This takes less than a second on standard hardware, ev en for trials with 60+ patien ts. 9 Step 4: Apply standard CRM safet y rules. Don’t skip un tried doses, start at the low est dose, and require at least 3 patien ts p er dose b efore de-escalation. These rules work with A W-TITE just like they do with standard CRM. That’s it. The workflo w (Figure 2 ) and Algorithm 1 provide additional implemen tation details, but the core idea is straightforw ard: replace TITE-CRM’s t/T max w eigh ts with adaptiv e w eigh ts Equation. Start trial Dose = d 1 Enroll patien t i at current dose Observe for DL T F ollow-up time t i DL T observed? Set w i = 1 Calculate w eigh t: w i = 1 − exp {− b λ ( d i ) ∆ i } Update CRM p osterior using weigh ted lik elihoo d n < N ? Select next dose closest to p ∗ = 0 . 25 Recommend MTD based on posterior Y es No Y es No Figure 2: T rial flo w chart for A W-TITE implementation. At each decision point, patien ts with incomplete follow-up ( t i < T max ) contribute through adaptive weigh ts w i computed from the curren t estimate of the toxicit y dela y distribution. Under a W eibull mo del with shap e γ , ∆ i = T γ max − t γ i and w i = 1 − exp {− b λ ( d i )∆ i } . P atients with observ ed DL T s receiv e w i = 1 , and those with complete follow-up and no DL T receive w i = 0 . The w eighted lik eliho o d updates the CRM p osterior, whic h determines the next dose assignmen t; the pro cess con tin ues un til N patien ts are enrolled. 10 Algorithm 1 provides detailed pseudo co de for the A W-TITE decision process at eac h dosing time. Algorithm 1 A W-TITE decision at dosing time t (single decision step) Require: currently enrolled patien ts with ( d j , t j , y j ) for j = 1 , . . . , n ; Require: skeleton p 0 , target p ∗ , T max , W eibull shap e γ ; prior ( a, b ) or MLE option. 1: Compute follow-up u j = min( t, t j ) and indicator δ j = 1 { y j = 1 and T j ≤ u j } for each prior patien t. 2: for eac h dose d (or for groups g if CA-A W) do 3: Compute D d = P j : d j = d δ j and S d = P j : d j = d u γ j . 4: if use Gamma prior then 5: P osterior λ ( d ) ∼ Gamma ( a + D d , b + S d ) . 6: else 7: Compute plug-in ˆ λ MLE ( d ) = D d /S d . 8: end if 9: end for 10: for eac h previously enrolled patien t i do 11: Compute ∆ i = T γ max − u γ i . 12: if y i = 1 then 13: w i ← 1 . 14: else if u i ≥ T max then 15: w i ← 0 . 16: else 17: compute w i ← 1 − E [ e − λ ( d i )∆ i | D ] (closed form if Gamma prior). 18: end if 19: end for 20: F orm w eigh ted log-lik eliho o d, compute p osterior of α , then choose next dose with p osterior mean to xicity closest to p ∗ (apply no-skipping rule). Figure 2 provides a complemen tary visual representation of this w orkflow. 2.6 Benc hmark Designs F or comparison, we ev aluated the following standard designs: 3+3 Design: The traditional rule-based design treating cohorts of 3 patien ts, escalating if 0/3 DL T s, expanding to 6 if 1/3 DL T s, and stopping escalation if ≥ 2 / 6 DL T s observ ed at a dose. Mo dified T o xicity Probability In terv al (mTPI): Is an algorithm-based design that partitions the probability space into underdosing, target, and o verdosing interv als and makes decisions based on whic h in terv al has highest posterior probability ( Ji et al. , 2010 ). Ba yesian Optimal In terv al (BOIN): Again an algorithm-based design using fixed de- cision boundaries derived from optimal Bay esian decision rules ( Liu and Y uan , 2015 ). 11 TITE-CRM: The time-to-ev en t CRM with a fixed linear weigh ts w = t/T max ( Cheung and Chappell , 2000 ). A W-MLE: Our prop osed adaptiv e-w eigh t TITE-CRM using plug-in MLE weigh ts (pri- mary method). A W-BA YES: Adaptiv e-weigh t TITE-CRM using p osterior mean from Gamma (1 , 1000) prior (sensitivit y analysis). All model-based metho ds used the same CRM sk eleton and prior for the dose-to xicity parameter α to ensure fair comparison. 3 Sim ulation Study 3.1 Ov erview W e conducted comprehensive sim ulation studies to ev aluate the op erating characteristics of A W-TITE compared to TITE-CRM and established b enc hmark designs. The simulation frame- w ork was designed to reflect realistic Phase I trial conditions while systematically v arying dose-to xicit y relationships to assess robustness across diverse scenarios. 3.2 T rial Configuration 3.2.1 Basic Parameters Eac h simulated trial enrolled N = 30 patients sequentially . The target toxicit y probabilit y w as p ∗ = 0 . 25 . Fiv e dose levels ( K = 5 ) were considered, denoted d 1 through d 5 . The DL T assessmen t windo w w as T max = 12 weeks. Patien t accrual o ccurred every 2 weeks (accrual in terv al = 2.0), creating realistic conditions where m ultiple patien ts hav e incomplete follo w-up at decision p oints. 3.2.2 CRM Configuration F or all model-based metho ds (TITE-CRM, A W-TITE v arian ts), we used a sk eleton π 0 = (0 . 05 , 0 . 10 , 0 . 18 , 0 . 30 , 0 . 45) with a Normal(0, 1 . 34 2 ) prior on α , yielding prior median DL T probabilities equal to the sk eleton. At each decision p oint, the next patien t w as assigned to the dose whose p osterior mean to xicity probability w as closest to the target p ∗ = 0 . 25 . 12 Safet y constrain ts included no skipping of untried doses and a minimum of 3 patients b efore de-escalation. 3.2.3 Time-to-T oxicit y Mo del DL T times w ere generated from a W eibull distrib ution with shape parameter γ = 2 . 0 and dose-sp ecific rate parameters λ ( d ) c hosen to yield the target marginal DL T probabilities within T max . Sp ecifically , for true toxicit y probabilit y p ( d ) , we set λ ( d ) = − log (1 − p ( d )) T γ max (15) This ensures that Pr( T ≤ T max | dose d ) = p ( d ) under the W eibull mo del with shap e γ = 2 . 0 . 3.3 Dose-T o xicit y Scenarios W e ev aluated p erformance across three dose-to xicit y scenarios representing a div erse clinical situations: 3.3.1 Standard Scenario T rue DL T probabilities: p true = (0 . 05 , 0 . 10 , 0 . 20 , 0 . 35 , 0 . 50) . T rue MTD: Dose 3 ( p = 0 . 20 , closest to target 0.25). This scenario represents a typical dose-resp onse relationship with the MTD at a middle dose lev el. 3.3.2 Steep Curve Scenario T rue DL T probabilities: p true = (0 . 02 , 0 . 05 , 0 . 10 , 0 . 25 , 0 . 50) T rue MTD: Dose 4 ( p = 0 . 25 , exact target) This scenario features a steep er dose-resp onse curv e with a wide therap eutic window at lo w er doses and with a rapid toxicit y increase at higher doses. 3.3.3 Flat Curve Scenario T rue DL T probabilities: p true = (0 . 10 , 0 . 15 , 0 . 20 , 0 . 25 , 0 . 30) 13 T rue MTD: Dose 4 ( p = 0 . 25 , exact target) This scenario represen ts a gradually increasing dose-resp onse relationship with minimal separation betw een adjacen t doses, challenging the designs’ abilit y to discriminate. 3.4 P erformance Metrics F or each design and scenario, w e computed: 3.4.1 Primary Metrics W e ev aluated three primary op erating characteristics. P(Correct MTD) quantifies the prop or- tion of sim ulated trials selecting the correct MTD as the final recommendation. Mean F raction Ab o v e MTD measures the a v erage prop ortion of enrolled patien ts treated at doses ab o v e the true MTD, with lo wer v alues indicating b etter safet y . Mean Num b er of DL T s reports the a v erage num b er of observ ed dose-limiting toxicities p er trial. 3.5 Statistical Analysis Eac h scenario w as simulated 2,000 times, yielding stable estimates of op erating characteris- tics (Monte Carlo standard errors < 1 . 5% for prop ortions near 0.5). T o assess a statistical significance of p erformance differences, w e conducted b o otstrap h yp othesis testing with 2,000 resamples. F or comparison of A W-MLE v ersus a comp etitor, w e computed the mean difference in the metric of in terest, the 95% b o otstrap confidence in terv al for the difference, and a p -v alue based on the prop ortion of bo otstrap samples where the comp etitor p erformed b etter. Differences were deemed statistically significant when the 95% confidence interv al excluded zero, corresponding to p < 0 . 05 . 4 Results 4.1 Ov erview T able 1 summarizes the operating c haracteristics across all methods and scenarios. Detailed p erformance metrics, dose selection proportions, and statistical comparisons are presented in the follo wing subsections. 14 4.2 Primary Comparison: A W-MLE v ersus TITE-CRM 4.2.1 Safet y P erformance A W-MLE substan tially and consistently reduced patien t o v erdosing compared to TITE-CRM across all scenarios (T able 2 ). A veraged across th e three dose-to xicit y scenarios, the mean fraction of patien ts treated ab o v e the MTD was 0.202 for A W-MLE versus 0.340 for TITE- CRM, represen ting a 40.6% reduction. Bo otstrap h yp othesis testing confirmed this safet y impro v emen t w as highly statistically significant (mean difference: − 0 . 139 , 95% CI: [ − 0 . 210 , − 0 . 067 ], p < 0 . 001 ). The safet y adv an tage was remark ably consisten t across all three dose-toxicit y scenarios (Fig- ures 3, 4, and 5). In the standard scenario, A W-MLE reduced o v erdosing to 0.279 compared to 0.417 for TITE-CRM (33.1% reduction, Figure 3 ). In the steep curv e scenario, the corre- sp onding v alues were 0.112 v ersus 0.179 (37.4% reduction, Figure 4 ). The largest improv emen t o ccurred in the c hallenging flat curve scenario, where A W-MLE ac hiev ed 0.213 compared to TITE-CRM’s 0.423 (49.6% reduction, Figure 5 ) demonstrating that adaptiv e w eighting pro- vides the greatest b enefit when dose-to xicity discrimination is most difficult. 4.2.2 MTD Selection A ccuracy Here’s the k ey finding: while dramatically improving safet y , A W-MLE didn’t sacrifice accuracy . A cross all scenarios, b oth methods selected the correct MTD ab out 55% of the time (A W-MLE: 55.2%, TITE-CRM: 55.2%, p = 0.21). This migh t seem surprising how can we ov erdose few er patien ts without hurting our ability to find the right dose? The answer is that A W-MLE is making *b etter use* of incomplete follo w-up information (Figure 3 ). It’s not b eing more conserv ative; it’s being smarter about when to escalate and when to hold bac k. P erformance held up across different dose-toxicit y relationships. In the steep curv e scenario, where rapid toxicit y increases make the MTD easier to iden tify , A W-MLE actually did slightly b etter (74.1% vs 69.6%) (Figure 4 ). Even in the difficult flat curv e scenario, where all doses ha v e similar toxicit y and most metho ds struggle, A W-MLE main tained 37.8% accuracy compared to TITE-CRM’s 34.1% (Figure 5 ). F or con text, the 3+3 design only managed 16.8% in this c hallenging setting. 15 4.2.3 DL T Burden Consisten t with reduced o v erdosing, A W-MLE resulted in few er observed DL T s p er trial. Across scenarios, A W-MLE a v eraged 6.8 DL T s p er trial versus 7.8 for TITE-CRM, a reduction of 1.0 DL T p er trial (12.8% decrease). 4.3 Comparison to Algorithm-Based Metho ds 4.3.1 MTD Selection A ccuracy A W-MLE demonstrated significantly sup erior MTD identification compared to all algorithm- based designs (T able 3, Figure 6 ). Compared to mTPI, our A W-MLE ac hieved 32.6 percentage p oin ts higher accuracy (95% CI: [26.2, 44.5], p < 0 . 001 ), with consistent adv antages across the standard scenario (53.8% vs 27.6%), steep scenario (74.1% vs 29.6%), and flat scenario (37.8% vs 10.4%). Notably , mTPI struggled sev erely in the flat curv e scenario, selecting the lo w est dose in approximately 60% of trials (Figure 5 ), highlighting a limitations of interv al-based metho ds when doses hav e similar toxicit y probabilities. Against the 3+3 design, A W-MLE show ed 19.8 p ercentage p oin ts improv ement (95% CI: [14.3, 24.3], p < 0 . 001 ), with sup eriority in the standard scenario (53.8% vs 39.6%), steep scenario (74.1% vs 49.8%), and flat scenario (37.8% vs 16.8%). Compared to BOIN, A W-MLE ac hiev ed mo destly higher accuracy (5.6 p ercen tage p oints, 95% CI: [1.1, 12.4], p = 0 . 018 ), with an adv antages observed in the standard scenario (53.8% vs 50.3%), steep scenario (74.1% vs 73.0%), and particularly the flat scenario (37.8% vs 25.5%). The safet y-accuracy tradeoff across all metho ds is visualized in Figure 6 , where the A W-MLE o ccupies a fav orable p osition, balancing both ob jectives. 4.4 Ba y esian versus MLE Implemen tation W e compared the plug-in MLE implemen tation (A W-MLE) with Ba y esian p osterior mean up dating using a w eak Gamma (1 , 1000) prior (A W-BA YES). A cross all scenarios, the t w o approac hes yielded nearly iden tical p erformance: MTD selection accuracy was 55.2% for A W- MLE versus 54.4% for A W-BA YES (difference +0 . 015 , p = 0 . 001 ), fraction ab ov e MTD w as 0.202 for b oth, and mean DL T s were 6.77 v ersus 6.74, resp ectively . This negligible difference 16 supp orts the use of the simpler MLE implemen tation for a practical applications. 5 Sensitivit y Analyses T o assess robustness of the prop osed A W-TITE design, we conducted comprehensiv e sensitiv- it y analyses v arying k ey trial and mo del parameters. Unless otherwise sp ecified, sensitivit y analyses used the standard dose-to xicity scenario with 500 sim ulations p er parameter v alue. 5.1 A ccrual Rate P atien t accrual rate directly affects the amount of incomplete follow-up data at decision p oin ts. W e v aried the accrual in terv al from 1.0 to 4.0 time units (weeks). P erformance remained remark ably stable across accrual rates (T able S1, Figure S1). MTD selection accuracy for A W-MLE v aried minimally from 0.538 to 0.561 (co efficien t of v ariation 2.1%), fraction of patien ts treated ab ov e the MTD ranged from 0.279 to 0.291 (CV 4.3%), and mean DL T coun t v aried from 6.92 to 6.89 (CV 1.8%). The consisten tly lo w co efficients of v ariation ( < 5% across all metrics) demonstrate that A W-MLE p erformance is robust to patien t accrual rate. Imp ortantly , A W-MLE’s safety adv antage o v er TITE-CRM p ersisted and ev en amplified under faster accrual conditions, where more patients hav e incomplete follow-up at decision p oints (T able S1). 5.2 Sample Size W e ev aluated performance with sample sizes N ∈ { 20 , 30 , 40 , 50 } (T able S2, Figure S2). All metho ds sho wed improv ed performance with larger sample sizes, as exp ected from increased information accumulation. Critically , the relative p erformance ranking remained consisten t across all sample sizes, with the A W-MLE maintaining its safet y adv antage ov er TITE-CRM and accuracy adv antage ov er algorithm-based metho ds regardless of trial size. A t the smallest sample size ( N = 20 ), A W-MLE ac hieved 45.2% MTD selection accuracy with 0.248 frac- tion ab o v e MTD, compared to TITE-CRM’s 48.0% accuracy with 0.452 fraction ab o v e MTD, demonstrating that adaptive weigh ting pro vides meaningful b enefits ev en in a small trials. 17 5.3 Shap e P arameter Missp ecification W e assessed robustness by v arying the assumed γ in the weigh t calculations ( γ assumed ∈ { 1 . 5 , 2 . 0 , 2 . 5 , 3 . 0 } ) while generating DL T times with true γ true = 2 . 0 . A W-MLE demonstrated remark able robustness to shap e parameter missp ecification (T able S3, Figure S3). MTD selection accuracy v aried minimally across a wide range of assumed γ v alues: 52.6% when γ was underspecified b y 25% ( γ assumed = 1 . 5 vs γ true = 2 . 0 ), 51.4% at the correct sp ecification, 51.4% when ov ersp ecified b y 25%, and 51.5% when o v ersp ecified b y 50%. A ccuracy v aried by only 1.2 p ercen tage p oin ts (2.3% relative v ariation) across this 50% range of shap e parameter v alues, from substan tial undersp ecification to substantial o v ersp ecification. These results pro vide strong empirical support for fixing γ at a reasonable v alue (such as γ = 2 . 0 ) rather than attempting to estimate it from limited Phase I data, as the p erformance p enalt y for mo derate missp ecification is negligible. 5.4 DL T Assessmen t Windo w The duration of the DL T assessmen t windo w T max represen ts a fundamental design c hoice af- fecting both patient safety and trial efficiency . W e v aried T max ∈ { 8 , 10 , 12 , 14 , 16 } w eeks to assess sensitivity to this parameter (T able S4, Figure S4). A longer assessmen t windo ws gener- ally improv ed safety for time-a ware metho ds, with A W-MLE’s fraction ab ov e MTD decreasing from 0.332 at 8 w eeks to 0.230 at 16 weeks. How ever, the impro v emen t plateaued b eyond 12–14 weeks, suggesting this duration provides sufficien t, and enough time to capture ma jorit y of delay ed to xicities while main taining reasonable trial duration. TITE-CRM sho wed minimal sensitivit y to windo w length, consistent with its ad ho c w eigh ting scheme that do es not adapt to observ ed dela y patterns. 5.5 Prior Sp ecification F or the Ba y esian implemen tation, w e examined sensitivit y to prior sp ecification for the rate pa- rameters λ ( d ) , ev aluating w eak (Gamma(1.0, 1000)), medium (Gamma(2.0, 500)), and strong (Gamma(5.0, 200)) priors (T able S5). The p erformance v aried minimally across the specifica- tions, with an MTD selection accuracy of 51.4%, 48.7%, and 49.2%, resp ectiv ely . The weak prior p erformed b est, yielding a results nearly iden tical to MLE approac h. These results con- 18 firm that A W-MLE’s prior-free p erformance is preferable for practical applications, helping to a v oid the need to specify and justify prior distributions for the dela y mo del parameters. 6 Discussion 6.1 Principal Findings W e developed and ev aluated adaptiv e-weigh t TITE-CRM (A W-TITE), a dose-finding design that replaces the ad ho c linear w eights of con ven tional TITE-CRM with p osterior predictive probabilities deriv ed from the observed to xicit y delay distribution. Through comprehensiv e sim ulation studies, w e demonstrated that A W-TITE substantially improv es patien t safet y while main taining or enhancing MTD iden tification accuracy . The magnitude of the safety improv ement is clinically meaningful and ethically significant. A cross a div erse dose-toxicit y scenarios, A W-MLE reduced the fraction of patien ts treated ab o v e the MTD from 34.0% (TITE-CRM) to 20.2%, a 40.6% relative reduction corresp onding to approximately 4 few er patients ov erdosed in a typical 30-patien t Phase I trial. Given that Phase I trials represen t the first h uman exp osure to in v estigational agen ts and enroll patien ts with limited treatment options, ev en mo dest improv ements in safet y hav e a substan tial ethical imp ortance. If applied across the hundreds of Phase I oncology trials conducted annually , this safet y impro vemen t could spare thousands of patien ts from unnecessary to xicit y while main taining efficien t MTD iden tification. 6.2 Wh y Do es This W ork? Let’s walk through what’s actually happ ening when A W-TITE makes decisions. Early in a trial, w e ha ven’t seen many toxicities y et, so our estimate of when they occur is rough. But ev en rough information helps. Sa y w e’ve enrolled 6 patien ts and seen 1 DL T that o ccurred in w eek 5. No w a new patien t has b een follow ed for 2 weeks without to xicit y . Under TITE-CRM, this patien t automatically gets weigh t w = 2 / 12 = 0 . 17 , regardless of what we’v e learned. Under A W-TITE, w e calculate: “Given that to xicities seem to o ccur around week 5, and this patien t has only b een follow ed for 2 weeks, what’s the probabilit y they’ll ev en tually hav e a DL T?” That probabilit y might b e 0.25 instead of 0.17 a 47% difference. 19 As the trial progresses and we observ e more toxicities, the pattern b ecomes clearer. If to xicities consistently app ear in w eeks 4–8, A W-TITE automatically upw eights patien ts who’ve surviv ed past this critical windo w. If toxicities are scattered throughout the en tire 12-week p erio d, the w eigh ts naturally con v erge to w ard something closer to TITE-CRM’s linear sc heme. This is the fundamen tal adv antage: the weights adapt to what we’r e actual ly se eing . TITE- CRM is flying blind with a fixed rule. A W-TITE is learning from the data in real time. When the true dela y pattern matc hes TITE-CRM’s implicit assumptions, b oth metho ds p erform similarly . When it do esn’t whic h is most of the time in mo dern trials with imm unotherap y and targeted agen ts, A W-TITE pulls ahead. 6.3 Limitations Our method isn’t p erfect. Here are the main concerns: W e assume a W eibull dela y distribution. This works w ell for most oncology settings where to xicity risk increases o ver time, but it’s not universal. If your trial in volv es: • Distinct early acute toxicities and late imm une-related ev ents (bimo dal pattern) • Substantial comp eting risks like progression or death • Dramatically differen t delay patterns across patien t subgroups then you might need more flexible mo dels. The W eibull assumption is a practical compromise, flexible enough to capture most real patterns, but simple enough to estimate reliably from small Phase I samples. Small samples mak e estimation noisy . In the first 10–15 patien ts, the estimated hazard rates are imprecise. This is una v oidable with any data-driv en approac h. The go o d news: ev en with noisy estimates early on, A W-TITE p erforms b etter than TITE-CRM’s fixed w eigh ts. And as the trial progresses, estimates stabilize quic kly . CRM mo del missp ecification still matters. If the true dose-toxicit y relationship de- parts substan tially from the sk eleton, all CRM-based methods struggle, A W-TITE included. A daptiv e w eigh ting fixes the delay mo del, not the dose-toxicity mo del. Pic k a reasonable sk eleton based on preclinical data and early clinical experience. 20 These aren’t fatal fla ws. They’re inherent tradeoffs in designing metho ds that w ork with the small samples and limited information t ypical of Phase I trials. The k ey question is: do es A W-TITE perform b etter than existing metho ds despite these limitations? Our sim ulations suggest y es. 6.4 F uture Directions Sev eral extensions of the A W-TITE framew ork w arrant in vestigation. First, the approac h could b e extended to more flexible time-to-to xicit y mo dels, including mixture distributions or nonparametric hazard estimation, p otentially impro ving p erformance when the W eibull assumption is substantially violated. Second, in tegration with adaptive accrual strategies could further optimize the tradeoff b et w een trial duration and information accum ulation. Third, the adaptiv e weigh ting principle could be extended to combination dose-finding trials, where m ultiple agen ts with p otentially different delay distributions must b e sim ultaneously optimized. F rom a practical standp oin t, dev elopment of user-friendly soft ware implemen ting A W-TITE w ould facilitate adoption by clinical trialists. Integration in to existing dose-finding softw are pac k ages or developmen t of a standalone R pac k age with in tuitiv e interfaces could lo w er barriers to implementation. Finally , prosp ectiv e ev aluation in real Phase I trials w ould provide v aluable insigh ts in to practical c h allenges and refinements needed for routine clinical use. 6.5 Conclusions Phase I trials with dela y ed to xicities present a fundamen tal c hallenge: y ou need to make dose decisions b efore y ou ha ve complete information. TITE-CRM solved half this problem, it lets trials k eep mo ving. But it solved it with an ad ho c assumption (linear weigh ts) that do esn’t reflect ho w to xicities actually o ccur. W e’v e sho wn that replacing fixed weigh ts with adaptive, data-driv en w eigh ts mak es a real difference. F orty p ercen t few er patients get ov erdosed. MTD iden tification sta ys just as accu- rate. And it’s computationally trivial to implemen t, everything up dates in closed form. F or institutions currently using TITE-CRM, switc hing to adaptive w eigh ting is straight- forw ard. The trial w orkflo w sta ys the same. The safet y rules sta y the same. Y ou’re just computing weigh ts differently , and those w eigh ts reflect what y ou’re actually observing instead 21 of an arbitrary linear assumption. As cancer therap eutics increasingly in v olv e agents with complex, delay ed toxicit y profiles; imm unotherapies, targeted agents, nov el com binations—the need for principled time-to-ev en t metho ds becomes more pressing. A W-TITE pro vides a practical solution. It mak es Phase I trials safer without compromising efficiency or imp osing computational burden. The metho d is ready for use. W e’v e made it simple enough to implemen t and robust enough to trust. The next step is getting it into actual trials, where it can start reducing the ov erdosing that still happ ens to o often in early-phase oncology . A c kno wledgmen ts The lead author extends sincere gratitude to all co-authors for their collab orative efforts, in- tellectual con tributions, and supp ort throughout the researc h pro cess. F unding No external funding w as receiv ed for this researc h. Conflicts of In terest The authors declare no conflicts of interest. Ethics Statemen t This study is based on simulation and metho dological dev elopment and did not inv olve h uman participan ts or patient data. No ethical appro v al was required. References Braun, T.M., 2002. The biv ariate contin ual reassessment metho d: extending the CRM to phase I trials of tw o comp eting outcomes. Con trolled Clinical T rials 23, 240–256. doi: 10.1016/ S0197- 2456(01)00205- 7 . 22 Cheung, Y.K., Chapp ell, R., 2000. Sequential designs for phase I clinical trials with late-onset to xicities. Biometrics 56, 1177–1182. doi: 10.1111/j.0006- 341x.2000.01177.x . Doussau, A., Geo erger, B., Jiménez, I., P aoletti, X., 2016. Inno v ations for phase I dose- finding designs in pediatric oncology clinical trials. Contemporary Clinical T rials 47, 217–227. doi: 10.1016/j.cct.2016.01.009 . Ji, Y., Liu, P ., Li, Y., Bek ele, B.N., 2010. A mo dified toxicit y probabilit y in terv al metho d for dose-finding trials. Clinical T rials 7, 653–663. doi: 10.1177/1740774510382799 . Le T ourneau, C., Lee, J.J., Siu, L.L., 2009. Dose escalation metho ds in phase I cancer clinical trials. Journal of the National Cancer Institute 101, 708–720. doi: 10.1093/jnci/djp079 . Liu, S., Y uan, Y., 2015. Ba yesian optimal interv al designs for phase I clinical trials. Journal of the Roy al Statistical Society: Series C (Applied Statistics) 64, 507–523. doi: 10.1111/rssc. 12089 . O’Quigley , J., Pepe, M., Fisher, L., 1990. Contin ual reassessmen t metho d: a practical design for phase 1 clinical trials in cancer. Biometrics 46, 33–48. doi: http://dx.doi.org/10.2307/ 2531628 . P ostel-Vina y , S., Asp eslagh, S., Lano y , E., Rob ert, C., Soria, J.C., Marab elle, A., 2016. Chal- lenges of phase I clinical trials ev aluating immune c hec kp oin t-targeted antibo dies. Annals of Oncology 27, 214–224. doi: 10.1093/annonc/mdv550 . Rogatk o, A., Sc ho enec k, D., Jonas, W., Tighiouart, M., Kh uri, F.R., Porter, A., 2007. T rans- lation of inno v ative designs in to phase I trials. Journal of Clinical Oncology 25, 4982–4986. doi: 10.1200/JCO.2007.12.1012 . W ages, N.A., Chiuzan, C., P anageas, K.S., 2018. Design considerations for early-phase clinical trials of immune-oncology agents. Journal for Immunotherap y of Cancer 6, 81. doi: 10.1186/ s40425- 018- 0389- 8 . Y uan, Y., Yin, G., 2011. On the usefulness of outcome-adaptiv e randomization. Journal of Clinical Oncology 29, e390–e392. doi: 10.1200/JCO.2010.34.5330 . 23 T ables T able 1: Op erating Characteristics Summary Metho d Scenario P(Correct MTD) F rac Ab ov e MTD Mean DL T s Standar d Sc enario 3+3 Standard 0.396 0.220 2.84 mTPI Standard 0.276 0.197 4.71 BOIN Standard 0.503 0.229 5.83 TITE Standard 0.552 0.417 7.74 A W-MLE Standard 0.538 0.279 6.77 A W-BA YES Standard 0.531 0.279 6.74 Ste ep Curve Sc enario 3+3 Steep 0.498 0.143 2.85 mTPI Steep 0.296 0.132 5.62 BOIN Steep 0.730 0.097 6.4 TITE Steep 0.696 0.179 7.87 A W-MLE Steep 0.741 0.112 7.27 A W-BA YES Steep 0.716 0.112 7.2 Flat Curve Sc enario 3+3 Flat 0.168 0.134 2.72 mTPI Flat 0.104 0.087 3.82 BOIN Flat 0.255 0.118 5.78 TITE Flat 0.341 0.423 7.9 A W-MLE Flat 0.378 0.213 7.07 A W-BA YES Flat 0.366 0.213 6.99 T able 2: Statistical Comparison: A W-MLE vs TITE-CRM Metric Mean Difference 95% CI p -v alue F raction Ab o v e MTD − 0 . 139 [ − 0 . 210 , − 0 . 067 ] < 0 . 001 *** P(Correct MTD) +0 . 023 [ − 0 . 015 , +0 . 045 ] 0.21 Mean DL T s − 1 . 0 [ − 1 . 5 , − 0 . 5 ] < 0 . 001 *** *** indicates p < 0 . 001 24 T able 3: Statistical Comparison: A W-MLE vs Algorithm-Based Metho ds Comparison Metric Mean Diff 95% CI p -v alue A W-MLE vs mTPI P(Correct MTD) +0 . 326 [0.262, 0.445] < 0 . 001 *** F rac Ab o v e MTD +0 . 063 [ − 0 . 019 , 0.126] 0.13 A W-MLE vs 3+3 P(Correct MTD) +0 . 198 [0.143, 0.243] < 0 . 001 *** F rac Ab o v e MTD +0 . 034 [ − 0 . 036 , 0.079] 0.31 A W-MLE vs BOIN P(Correct MTD) +0 . 056 [0.011, 0.124] 0.018 * F rac Ab o v e MTD +0 . 053 [0.015, 0.095] 0.010 * * p < 0 . 05 ; *** p < 0 . 001 Figures 25 0.22 0.197 0.229 0.417 0.279 0.279 mTPI 3+3 BOIN A W−MLE A W−BA YES TITE 0.0 0.1 0.2 0.3 0.4 0.5 Fraction of P atients Above MTD Method Lower is better (f ewer patients ov erdosed) Saf ety Comparison − Standard (MTD=d3) 0.396 0.276 0.503 0.552 0.538 0.531 TITE A W−MLE A W−BA YES BOIN 3+3 mTPI 0.0 0.2 0.4 0.6 P(Correct MTD) Method Higher is better (more correct MTD selections) Accuracy Comparison − Standard (MTD=d3) 2.84 4.71 5.83 7.74 6.77 6.74 3+3 mTPI BOIN A W−BA YES A W−MLE TITE 0.0 2.5 5.0 7.5 Mean Number of DL Ts Method Lower is better (f ewer DL Ts per trial) DL T Burden − Standard (MTD=d3) 0.0 0.2 0.4 d1 d2 d3 d4 d5 Dose Lev el Selection Propor tion Method 3+3 A W−BA YES A W−MLE BOIN mTPI TITE Dose Selection Propor tions − Standard (MTD=d3) Comprehensive Comparison − Standard (MTD=d3) Figure 3: Comprehensiv e comparison for Standard scenario (MTD = d3). Upp er left: Safet y comparison showing fraction of patients treated ab o v e the true MTD (low er is better). TITE- CRM sho ws excessive ov erdosing (0.417), while A W-MLE reduces this to 0.279, a 33.1% reduction. Upp er right: MTD selection accuracy showing probabilit y of correctly iden tifying dose 3 as the MTD (higher is better). A W-MLE (0.538) achiev es comparable accuracy to TITE-CRM (0.552) while substan tially improving safety . Lo wer left: DL T burden sho wing mean n um b er of observ ed DL T s p er trial (lo w er is b etter). A W-MLE reduces DL T burden from 7.74 (TITE) to 6.77. Low er righ t: Dose selection prop ortions sho wing the distribution of final dose recommendations across 2,000 simulated trials. The true MTD is d3 (toxicit y probability 0.20, closest to target 0.25). Mo del-based meth- o ds (A W-MLE, A W-BA YES, TITE, BOIN) show concen trated selection at or near the MTD, while algorithm-based metho ds (mTPI, 3+3) sho w broader, less accurate distributions. 26 0.148 0.132 0.097 0.179 0.112 0.112 BOIN A W−BA YES A W−MLE mTPI 3+3 TITE 0.00 0.05 0.10 0.15 0.20 Fraction of P atients Abov e MTD Method Lower is better (f ewer patients ov erdosed) Saf ety Comparison − Steep Cur ve 0.498 0.296 0.73 0.696 0.741 0.716 A W−MLE BOIN A W−BA YES TITE 3+3 mTPI 0.00 0.25 0.50 0.75 P(Correct MTD) Method Higher is better (more correct MTD selections) Accuracy Comparison − Steep Cur ve 2.85 5.62 6.4 7.87 7.27 7.2 3+3 mTPI BOIN A W−BA YES A W−MLE TITE 0.0 2.5 5.0 7.5 Mean Number of DL Ts Method Lower is better (f ewer DL Ts per trial) DL T Burden − Steep Curve 0.0 0.2 0.4 0.6 d1 d2 d3 d4 d5 Dose Lev el Selection Propor tion Method 3+3 A W−BA YES A W−MLE BOIN mTPI TITE Dose Selection Propor tions − Steep Cur ve Comprehensive Comparison − Steep Curve Figure 4: Comprehensiv e comparison for Steep Curve scenario (MTD = d4). Upp er left: Safet y comparison. In this scenario with rapidly increasing toxicit y , A W-MLE achiev es the low est o v erdosing rate among mo del-based metho ds (0.112), represen ting a 37.4% reduction compared to TITE-CRM (0.179). BOIN shows the b est safet y (0.097) due to its conserv ativ e design. Upp er righ t: MTD selection accuracy . A W-MLE achiev es the highest accuracy (0.741), outp erforming TITE-CRM (0.696), BOIN (0.730), and substantially outp erforming algorithm-based metho ds (mTPI: 0.296, 3+3: 0.498). Lo w er left: DL T burden. A W-MLE sho ws mo derate DL T burden (7.27) betw een conserv ativ e metho ds (3+3: 2.85) and TITE-CRM (7.87). Lo w er right: Dose selection proportions. The true MTD is d4 (to xicit y probabilit y 0.25, exact target). The steep dose-toxicit y relationship (0.02, 0.05, 0.10, 0.25, 0.50) creates clear differen tiation b etw een doses. A W-MLE and BOIN sho w highly concen trated selection at the correct dose, while mTPI struggles with this scenario, frequen tly under-escalating to lo w er doses. 27 0.134 0.087 0.118 0.423 0.213 0.213 mTPI BOIN 3+3 A W−BA YES A W−MLE TITE 0.0 0.1 0.2 0.3 0.4 0.5 Fraction of P atients Abov e MTD Method Lower is better (f ewer patients ov erdosed) Saf ety Comparison − Flat Cur ve 0.168 0.104 0.255 0.341 0.378 0.366 A W−MLE A W−BA YES TITE BOIN 3+3 mTPI 0.0 0.1 0.2 0.3 0.4 P(Correct MTD) Method Higher is better (more correct MTD selections) Accuracy Comparison − Flat Cur ve 2.72 3.82 5.78 7.9 7.07 6.99 3+3 mTPI BOIN A W−BA YES A W−MLE TITE 0.0 2.5 5.0 7.5 Mean Number of DL Ts Method Lower is better (f ewer DL Ts per trial) DL T Burden − Flat Curve 0.0 0.2 0.4 0.6 d1 d2 d3 d4 d5 Dose Lev el Selection Propor tion Method 3+3 A W−BA YES A W−MLE BOIN mTPI TITE Dose Selection Propor tions − Flat Cur ve Comprehensive Comparison − Flat Curve Figure 5: Comprehensive comparison for Flat Curv e scenario (MTD = d4). Upper left: Safet y comparison. This c hallenging scenario with minimal dose separation sho ws the largest safet y adv an tage for A W-MLE. TITE-CRM o v erdoses 42.3% of patients, while A W-MLE reduces this to 21.3%, a 49.6% reduction the largest improv emen t across all scenarios. Upp er right: MTD selection accuracy . Despite the difficult y of discriminating b et w een similarly to xic doses (0.10, 0.15, 0.20, 0.25, 0.30), A W-MLE ac hiev es the highest accuracy (0.378), outp erforming TITE-CRM (0.341), BOIN (0.255), and particularly mTPI (0.104) whic h struggles sev erely in this scenario. Lo w er left: DL T burden remains moderate for A W-MLE (7.07) compared to TITE-CRM (7.90). Low er righ t: Dose selection proportions show the challenge of this scenario. The true MTD is d4. No metho d ac hiev es highly concentrated selection due to the minimal differences betw een doses. Algorithm-based metho ds sho w particularly p o or discrimination, with mTPI hea vily ov er-selecting the lo west dose (d1) in 60% of trials. A W-MLE shows the most appropriate balance, with primary selections at d3 and d4. 28 3+3 mTPI BOIN TITE A W−MLE A W−BA YES 3+3 mTPI BOIN TITE A W−MLE A W−BA YES 3+3 mTPI BOIN TITE A W−MLE A W−BA YES 0.2 0.4 0.6 0.1 0.2 0.3 0.4 Fraction Abov e MTD (lower = saf er) P(Correct MTD) (higher = better) Scenario Flat Curve Standard (MTD=d3) Steep Curve Method 3+3 A W−BA YES A W−MLE BOIN mTPI TITE Ideal: top−left corner (safe + accurate) Safety−Accur acy T radeoff Figure 6: Safety-accuracy tradeoff across all metho ds and scenarios. Eac h p oint represen ts one metho d-scenario com bination (6 metho ds × 3 scenarios = 18 points). Shapes indicate scenarios: circles (flat curv e), triangles (standard, MTD=d3), squares (steep curve). The ideal design app ears in the upp er-left corner (high accuracy , lo w o v erdosing). A W-MLE (green) consistently achiev es fa vorable balance across all scenarios, while TITE-CRM (pink) sho ws excessiv e o verdosing. Algorithm-based metho ds sho w v ariable p erformance, with BOIN (cyan) prioritizing safety ov er accuracy and mTPI (blue) struggling particularly in the flat curv e scenario. 29 Supplemen tary Materials Ov erview This do cument provides detailed results from sensitivity analyses examining the robustness of A W-TITE across v arious trial parameters and mo del sp ecifications. All analyses used the standard dose-toxicit y scenario (true DL T probabilities: 0.05, 0.10, 0.20, 0.35, 0.50; MTD = dose 3) with 2000 sim ulations p er parameter setting. Sensitivit y Analysis Results A ccrual Rate Sensitivit y T able S1 and Figure S1 present p erformance across accrual interv als from 1.0 to 4.0 w eeks (Sec- tion 5.1 of main text). Results demonstrate robust p erformance with co efficien ts of v ariation b elo w 5% for all metrics. Sample Size Sensitivit y T able S2 and Figure S2 sho w op erating c haracteristics for sample sizes ranging from N = 20 to N = 50 patien ts (Section 5.2 of main text). All metho ds exhibit improv ed p erformance with larger samples, while relativ e p erformance rankings remain consisten t. Shap e P arameter Missp ecification T able S3 and Figure S3 ev aluate robustness when the assumed W eibull shap e parameter differs from the true v alue (Section 5.3 of main text). A W-MLE sho ws minimal sensitivity (< 3% v ariation) across a 50% range of shap e parameter v alues. DL T Assessmen t Windo w T able S4 and Figure S4 examine the effect of DL T window duration from 8 to 16 w eeks (Section 5.4 of main text). Longer windows generally impro ve safety , with diminishing returns b ey ond 12-14 w eeks. 30 Prior Sp ecification (Ba y esian Implemen tation) T able S5 presen ts results for different prior sp ecifications on the rate parameters λ ( d ) in the Ba y esian implementation (Section 5.5 of main text). P erformance v aries minimally across w eak, medium, and strong priors. Supplemen tary T ables T able 4: Sensitivit y Analysis: Accrual Rate Metho d A ccrual P(Correct) Ab o v e MTD Mean DL T s CV(%) A W-MLE 1.0 0.561 0.291 6.89 — A W-MLE 2.0 0.538 0.279 6.92 2.1 A W-MLE 3.0 0.545 0.272 6.71 2.1 A W-MLE 4.0 0.542 0.267 6.65 2.1 TITE 1.0 0.548 0.439 7.95 — TITE 2.0 0.552 0.417 7.97 1.8 TITE 3.0 0.555 0.415 7.89 1.8 TITE 4.0 0.558 0.406 7.82 1.8 CV = co efficient of v ariation across accrual rates T able 5: Sensitivit y Analysis: Sample Size Metho d N P(Correct MTD) F rac Ab o v e MTD Mean DL T s A W-MLE 20 0.452 0.248 4.78 A W-MLE 30 0.538 0.279 6.92 A W-MLE 40 0.582 0.281 9.12 A W-MLE 50 0.610 0.286 11.28 TITE 20 0.480 0.452 5.52 TITE 30 0.552 0.417 7.97 TITE 40 0.581 0.419 10.58 TITE 50 0.596 0.414 13.06 BOIN 20 0.418 0.167 4.23 BOIN 30 0.503 0.149 2.60 BOIN 40 0.539 0.231 7.98 BOIN 50 0.554 0.268 10.95 31 T able 6: Sensitivit y Analysis: Shap e Parameter Missp ecification Metho d γ assumed P(Correct) Ab o v e MTD V ariation A W-MLE 1.5 0.526 0.277 Reference A W-MLE 2.0 0.514 0.279 2.3% A W-MLE 2.5 0.514 0.295 2.3% A W-MLE 3.0 0.515 0.289 2.1% A W-BA YES 1.5 0.514 0.329 Reference A W-BA YES 2.0 0.533 0.278 8.6% A W-BA YES 2.5 0.547 0.295 8.6% A W-BA YES 3.0 0.558 0.289 8.6% T rue γ = 2 . 0 ; V ariation = range/mean T able 7: Sensitivit y Analysis: DL T Assessment Window Metho d T max (w eeks) P(Correct) Ab o v e MTD Mean DL T s A W-MLE 8 0.521 0.332 7.12 A W-MLE 10 0.535 0.298 6.98 A W-MLE 12 0.538 0.278 6.92 A W-MLE 14 0.542 0.251 6.78 A W-MLE 16 0.545 0.230 6.71 TITE 8 0.548 0.409 7.89 TITE 10 0.551 0.413 7.93 TITE 12 0.552 0.417 7.97 TITE 14 0.553 0.414 7.95 TITE 16 0.555 0.411 7.91 T able 8: Sensitivit y Analysis: Prior Sp ecification (Ba yesia n Implemen tation) Prior Strength Parameters P(Correct) Ab ov e MTD Mean DL T s W eak Gamma(1.0, 1000) 0.514 0.279 6.85 Medium Gamma(2.0, 500) 0.487 0.329 7.12 Strong Gamma(5.0, 200) 0.492 0.331 7.19 Prior mean hazard: W eak = 0.001, Medium = 0.004, Strong = 0.025 32 Supplemen tary Figures 0.3 0.4 0.5 1 2 3 4 Accrual Inter val (time units) P(Correct MTD) Method 3+3 A W−BA YES A W−MLE BOIN mTPI TITE How does perf or mance change with faster/slo wer enrollment? Sensitivity to Accrual Rate Figure 7: Sensitivity to accrual rate. Performance metrics remain stable across accrual in terv als from 1 to 4 w eeks, with co efficien t of v ariation < 5% for all metrics. 33 0.2 0.3 0.4 0.5 0.6 20 30 40 50 Sample Size P(Correct MTD) Method 3+3 A W−BA YES A W−MLE BOIN mTPI TITE Eff ect of Sample Size on Accuracy Figure 8: Sensitivity to sample size. All metho ds sho w impro v ed p erformance with larger sample sizes. A W-MLE main tains its safet y adv antage o v er TITE-CRM across all sample sizes, with the b enefit most pronounced at N = 20 . 34 0.52 0.53 0.54 0.55 −0.5 0.0 0.5 1.0 Misspecification (assumed k − true k) P(Correct MTD) Method A W−BA YES A W−MLE TITE T r ue k = 2.0; how do methods perf or m when k is misspecified? Rob ustness to Shape P arameter Misspecification Figure 9: Robustness to shap e parameter missp ecification. A W-MLE shows minimal sensitivit y to γ sp ecification ( < 3% v ariation in accuracy for ± 25% missp ecification), while A W-BA YES sho ws greater sensitivit y (8.6% v ariation). 35 0.20 0.25 0.30 0.35 0.40 8 10 12 14 16 DL T Assessment Window (Tmax) Fraction Abo v e MTD Method 3+3 A W−BA YES A W−MLE BOIN mTPI TITE Longer windows allo w more complete f ollow−up Eff ect of DL T Assessment Window on Saf ety Figure 10: Effect of DL T assessment windo w duration. Longer windo ws impro v e safety for A W-MLE, with diminishing returns b ey ond 12-14 w eeks. TITE-CRM shows minimal sensitivity to window length. 36
Original Paper
Loading high-quality paper...
Comments & Academic Discussion
Loading comments...
Leave a Comment