Oscillation frequencies and mode lifetimes in alpha Centauri A
We analyse our recently-published velocity measurements of alpha Cen A (Butler et al. 2004). After adjusting the weights on a night-by-night basis in order to optimize the window function to minimize sidelobes, we extract 42 oscillation frequencies with l=0 to 3 and measure the large and small frequency separations. We give fitted relations to these frequencies that can be compared with theoretical models and conclude that the observed scatter about these fits is due to the finite lifetimes of the oscillation modes. We estimate the mode lifetimes to be 1-2 d, substantially shorter than in the Sun.
💡 Research Summary
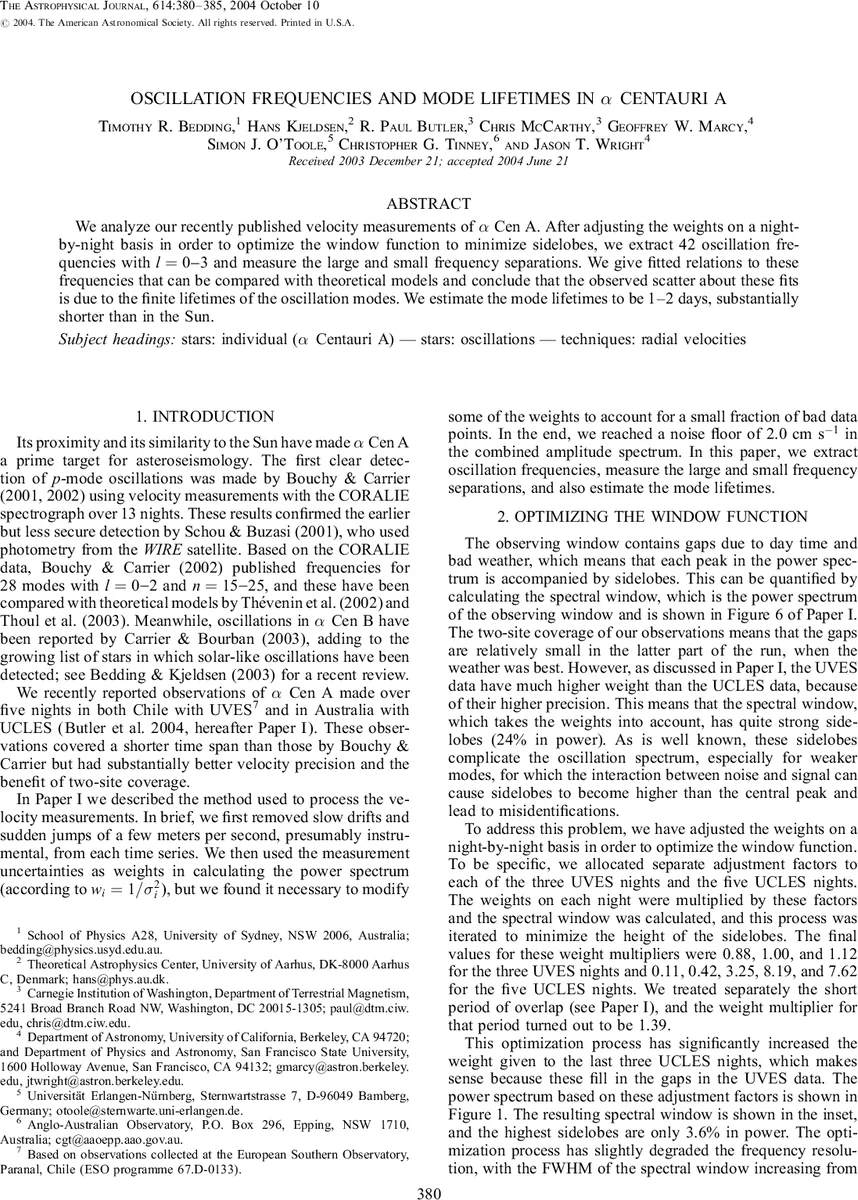
The paper presents a detailed asteroseismic analysis of α Centauri A, using high‑precision radial‑velocity measurements obtained over eight nights with two spectrographs: UVES at the European Southern Observatory (Chile) and UCLES at the Anglo‑Australian Telescope (Australia). The authors first address a key limitation of ground‑based time‑series data – the presence of spectral‑window side‑lobes caused by daily gaps and weather interruptions – by adjusting the nightly weights of the data points. Separate multiplicative factors were applied to each of the three UVES nights and the five UCLES nights (plus an overlap period), iteratively minimizing the side‑lobe power from an initial 24 % down to 3.6 % of the central peak. This optimization slightly degraded the frequency resolution (FWHM increased from 3.85 to 4.1 µHz) and raised the high‑frequency noise floor from 2.0 to 2.9 cm s⁻¹, but the resulting power spectrum displayed much cleaner oscillation peaks.
Using an iterative sine‑wave fitting procedure, the authors extracted 42 significant frequencies, assigning angular degrees l = 0, 1, 2, 3 based on their positions in an echelle diagram (folded with a large separation of ~106 µHz). The amplitudes of these modes range from ~6 to 40 cm s⁻¹. Small separations Δν₀₂, Δν₁₃, and Δν₀₁ were measured as functions of frequency and fitted with straight lines:
- Δν₀₂ = 5.46 µHz + 0.0060 · (ν/2400 µHz)
- Δν₁₃ = 10.99 µHz + 0.0012 · (ν/2400 µHz)
- Δν₀₁ = 2.41 µHz + 0.0029 · (ν/2400 µHz)
These relations capture the observed frequency dependence of the small separations, confirming earlier findings that the small separations vary across the observed range. The large separation Δν (≈105 µHz) shows a modest increase with frequency, producing the curvature seen in the echelle diagram.
When the measured frequencies are compared to the fitted relations (equations 4–7), a noticeable scatter remains, especially at higher frequencies (>3000 µHz). The authors interpret this scatter as a manifestation of finite mode lifetimes. In a perfectly coherent (infinite‑lifetime) oscillation, the peak positions would be reproducible to ~0.4 µHz. The observed scatter, however, is significantly larger, implying that each mode is damped on a timescale comparable to the length of the observations.
To quantify the lifetimes, the authors performed Monte‑Carlo simulations that mimic the actual window function and weighting scheme. They generated synthetic time series for a single stochastically excited, damped oscillator using the method of Stello et al. (2004), varying the damping time (mode lifetime) and creating 100 realizations for each assumed lifetime. By measuring the distribution of peak frequencies in these simulations and matching the observed scatter, they inferred mode lifetimes of 1–2 days for α Cen A. This is substantially shorter than the solar p‑mode lifetimes of 3–4 days, suggesting a more vigorous convective envelope or different damping mechanisms in α Cen A.
The paper also compares its results with the earlier single‑site CORALIE data of Bouchy & Carrier (2002), which reported 28 modes (l = 0, 2) in the same frequency range. After accounting for the small‑separation corrections, the two data sets agree very well, especially for l = 1 modes, validating the robustness of the two‑site approach despite the shorter total time span.
In summary, the study demonstrates that:
- Night‑by‑night weight optimization can dramatically improve the spectral window, reducing side‑lobes and facilitating reliable mode identification.
- α Cen A exhibits a clear set of solar‑like p‑modes with measurable large and small separations, providing stringent constraints for stellar interior models.
- The observed frequency scatter is best explained by finite mode lifetimes of 1–2 days, shorter than the Sun’s, indicating differences in the damping processes.
- The derived empirical relations (equations 4–7) for the mode frequencies should be used for model comparisons rather than the raw measured frequencies, as they correct for the systematic shifts introduced by the finite lifetimes.
These findings enrich our understanding of solar‑type oscillations in a star that is the closest solar analogue, and they illustrate the importance of careful window‑function handling and realistic treatment of stochastic excitation when interpreting ground‑based asteroseismic data.
Comments & Academic Discussion
Loading comments...
Leave a Comment