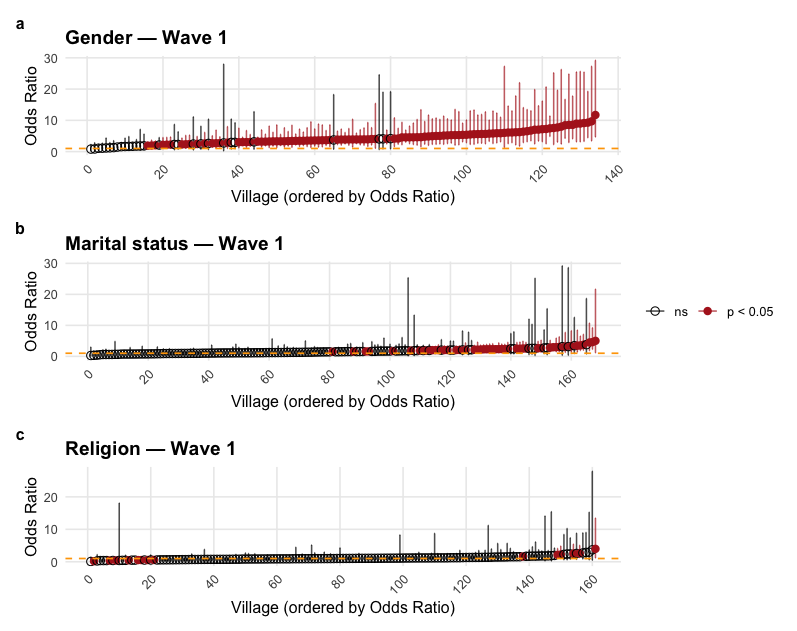
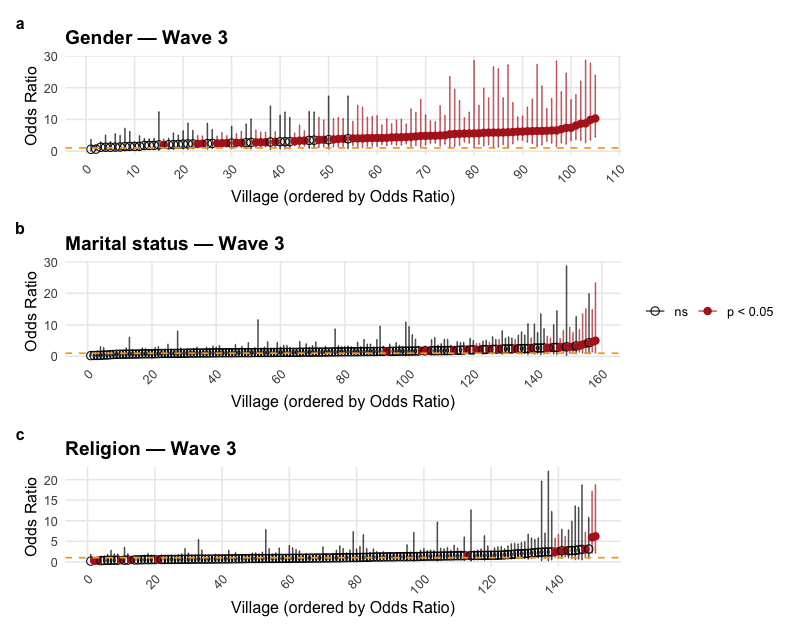
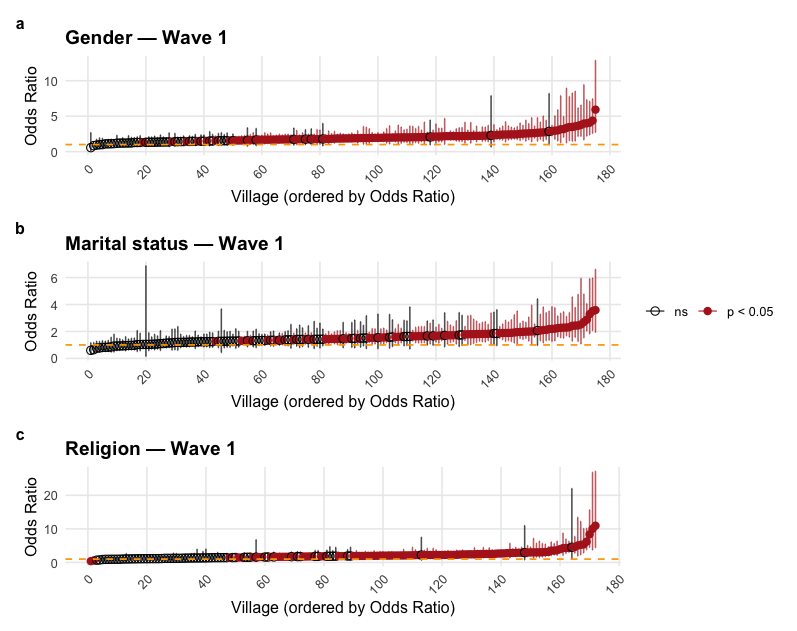
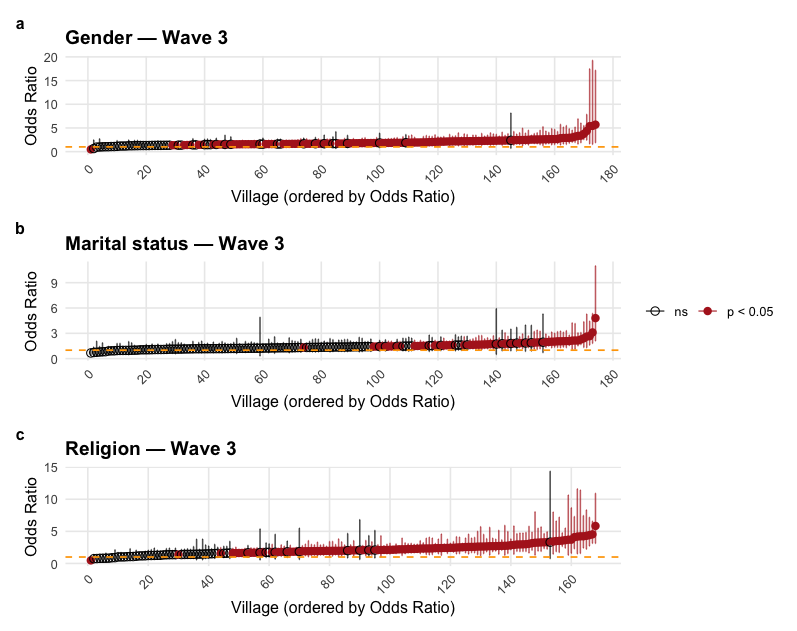
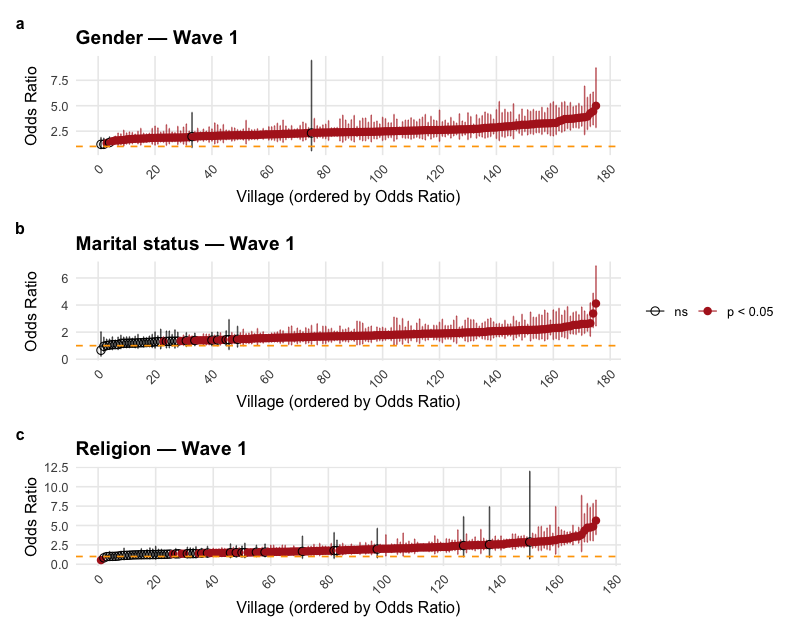
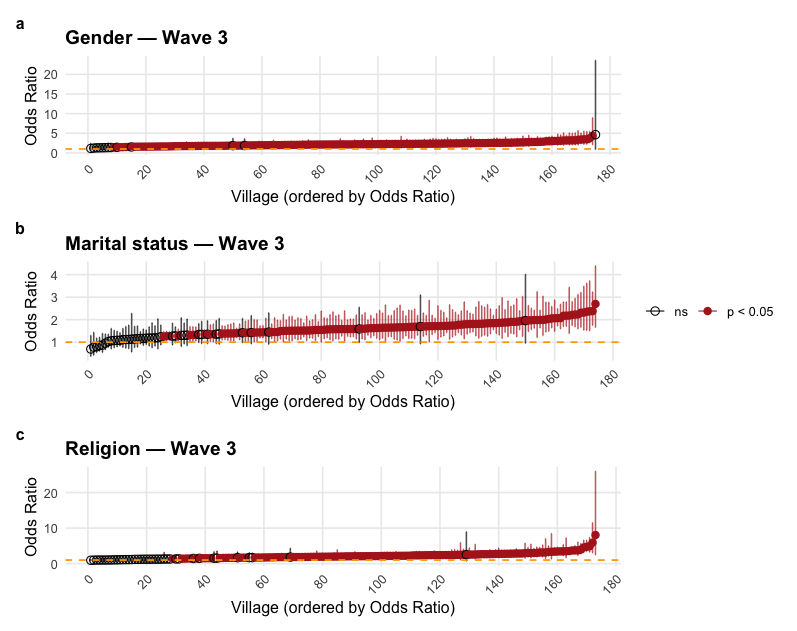
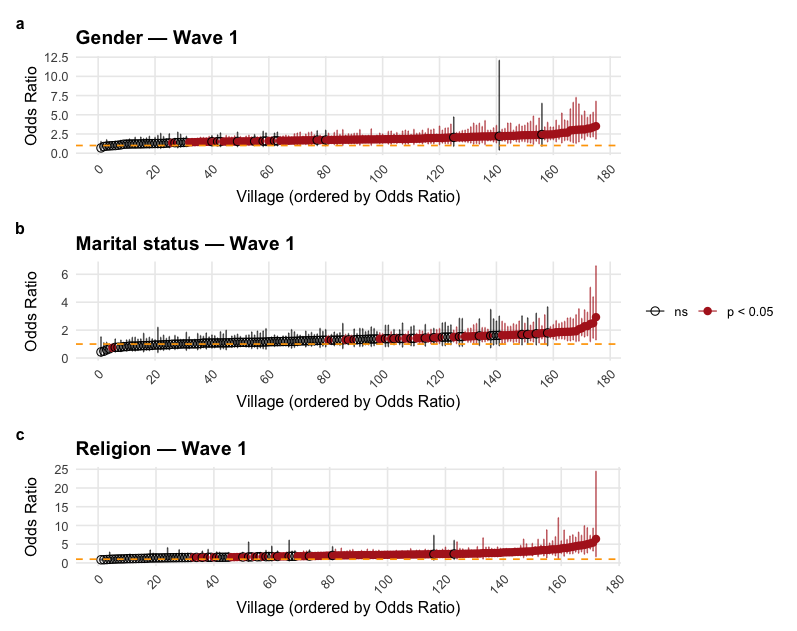
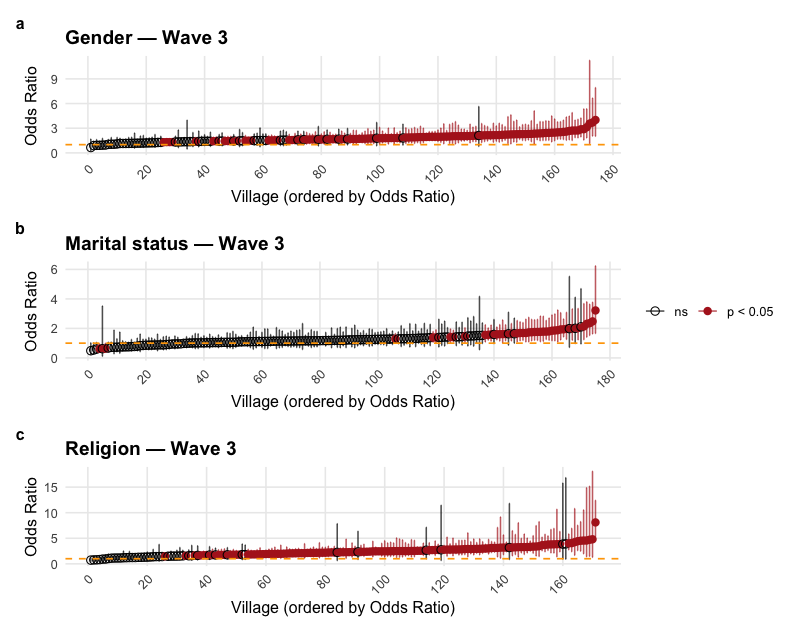
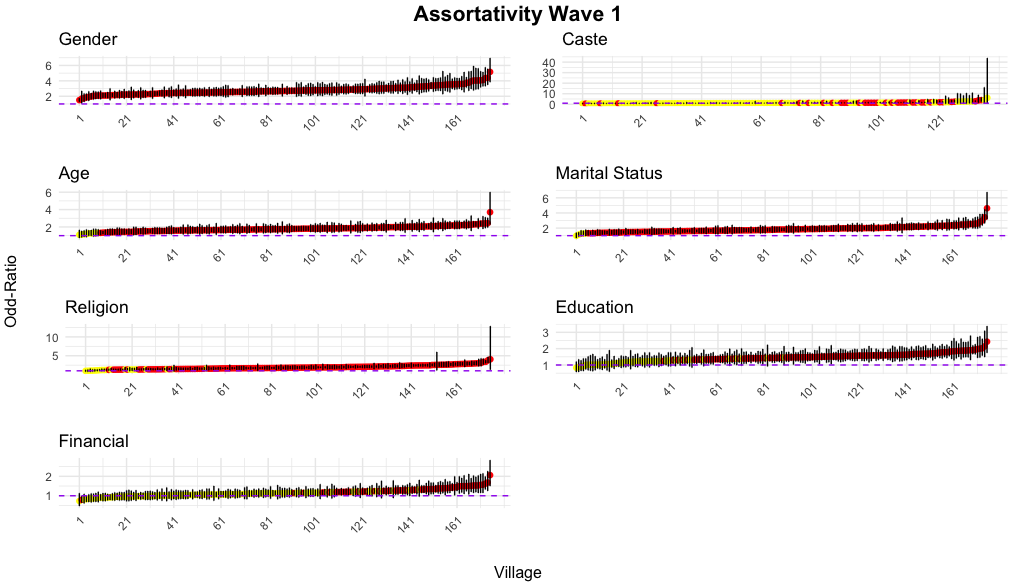
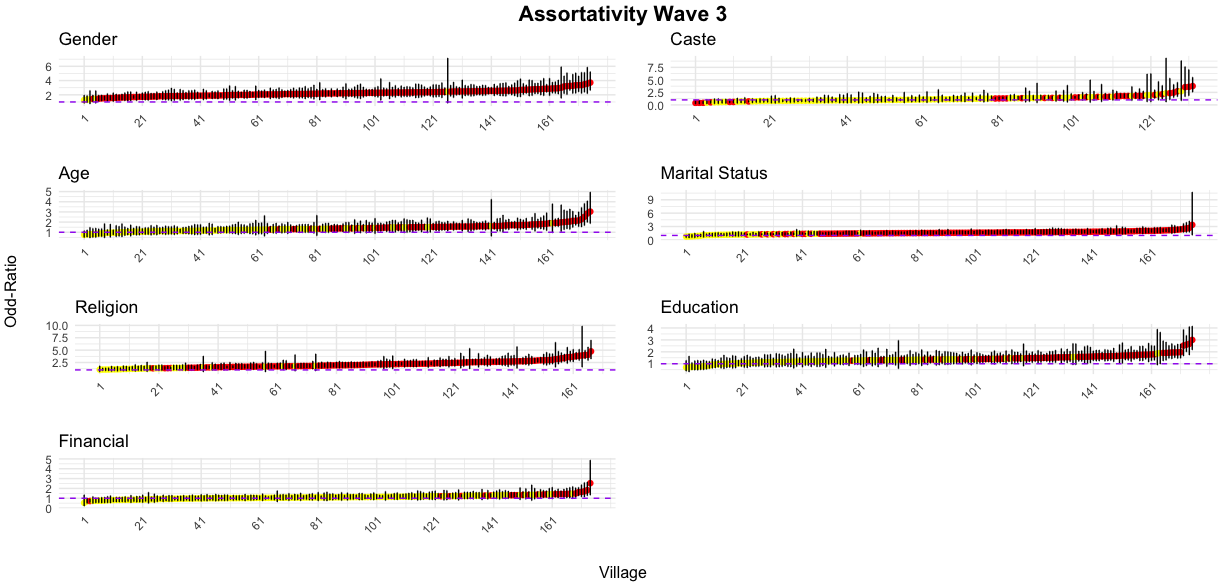
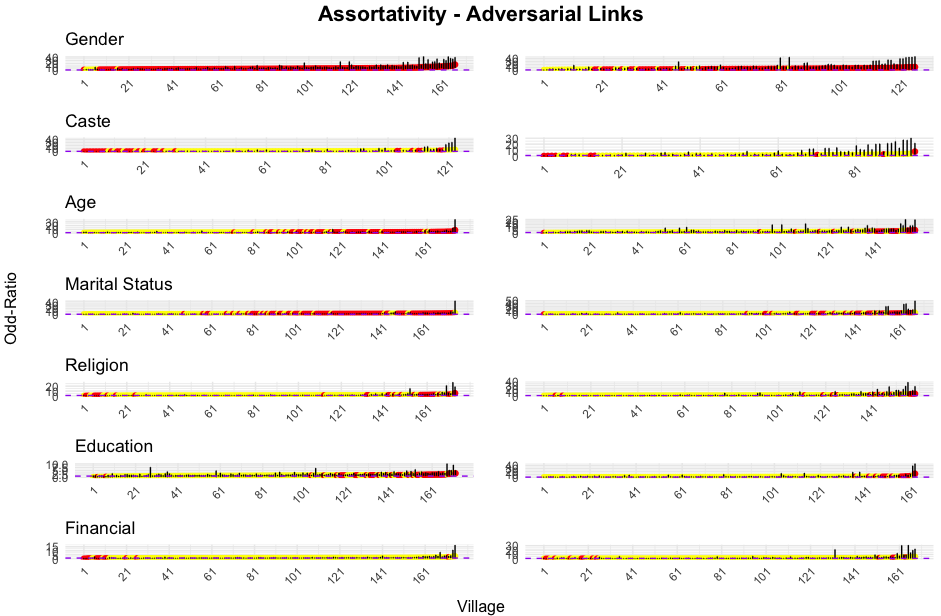
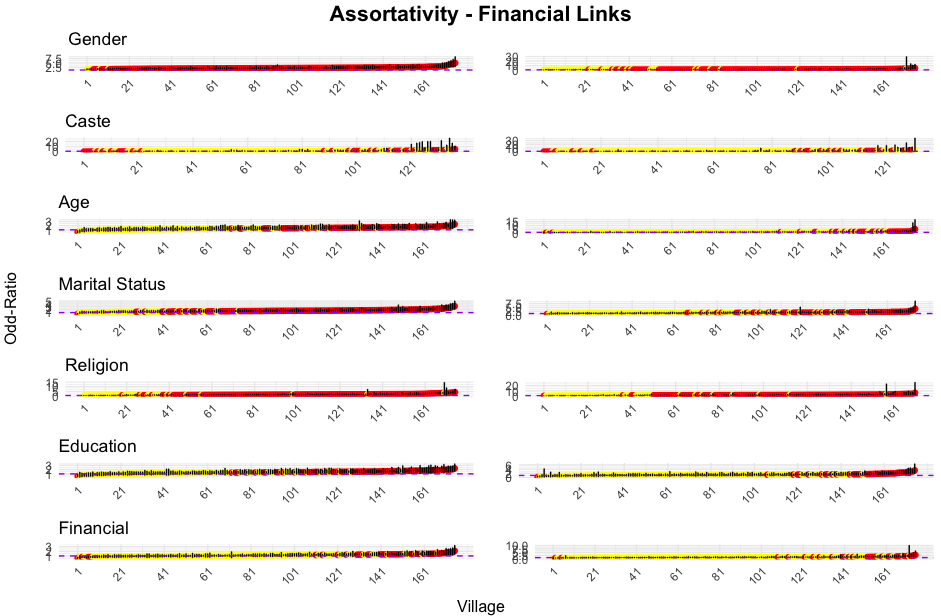
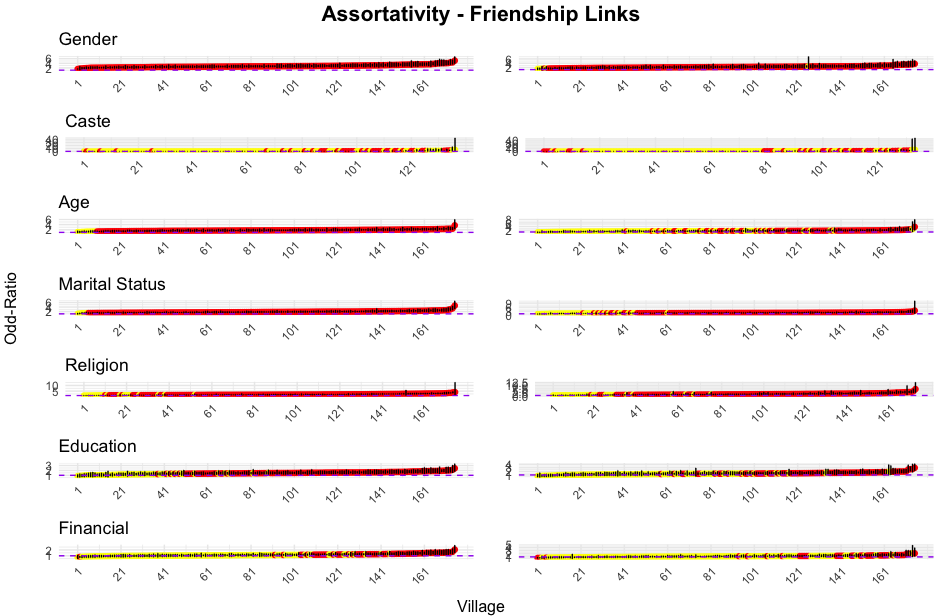
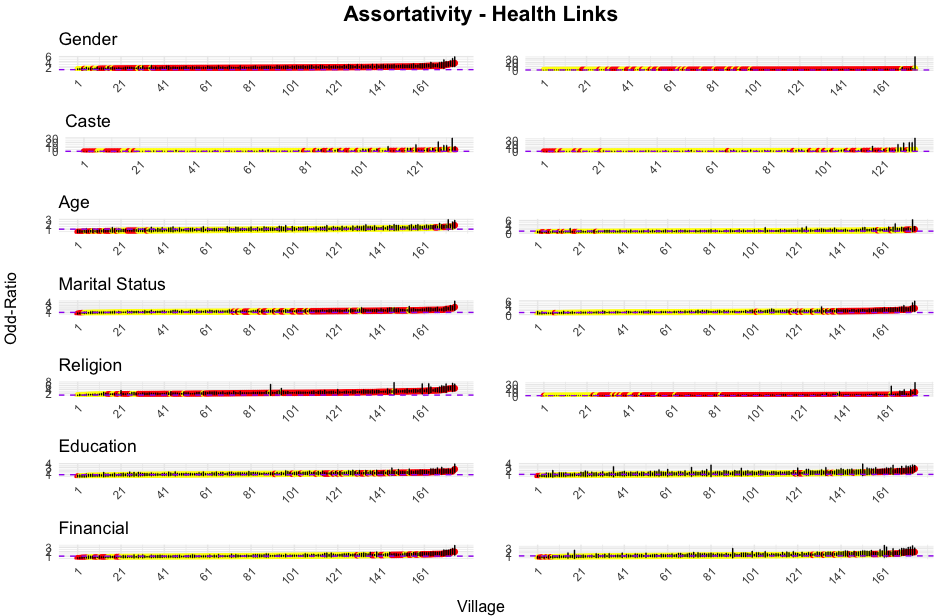
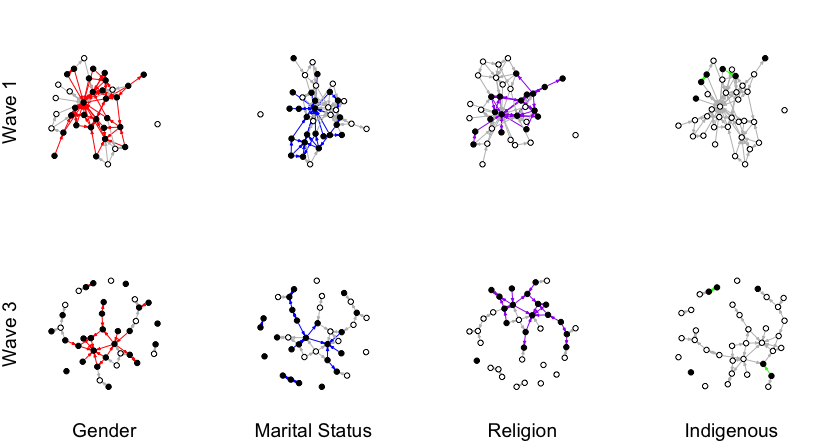
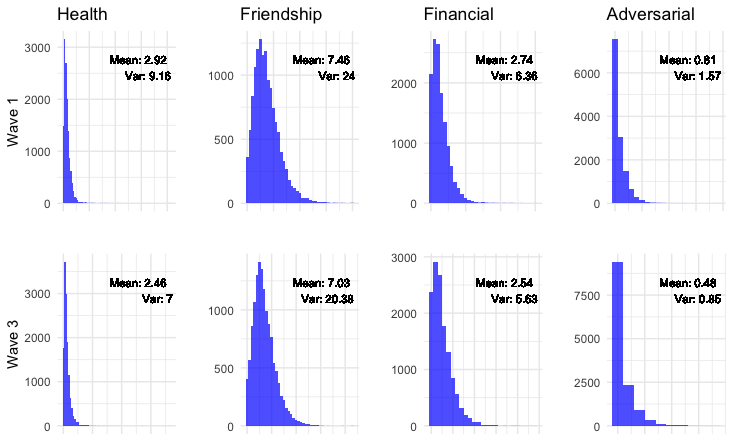
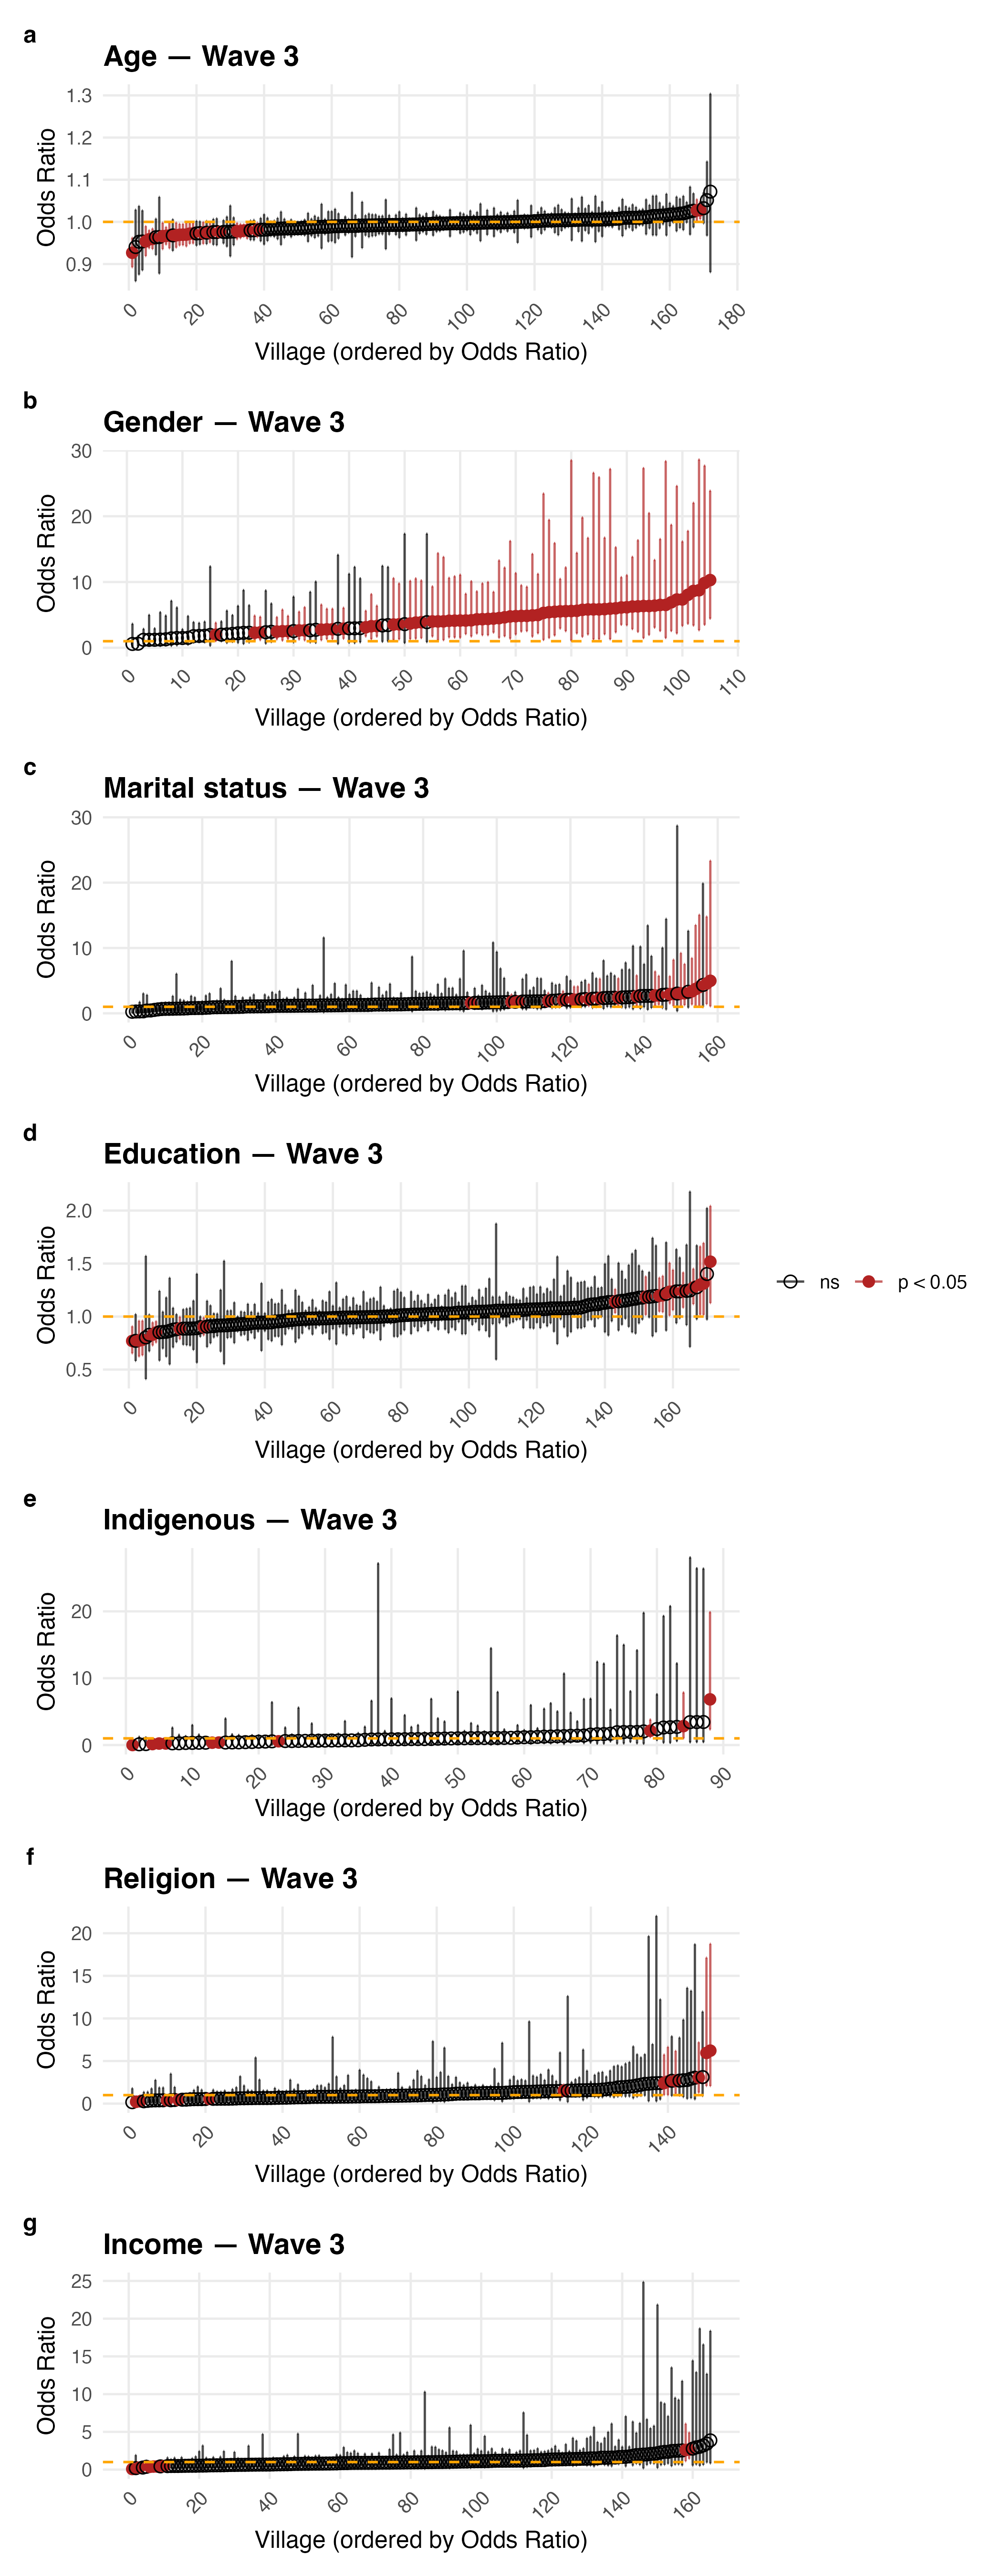
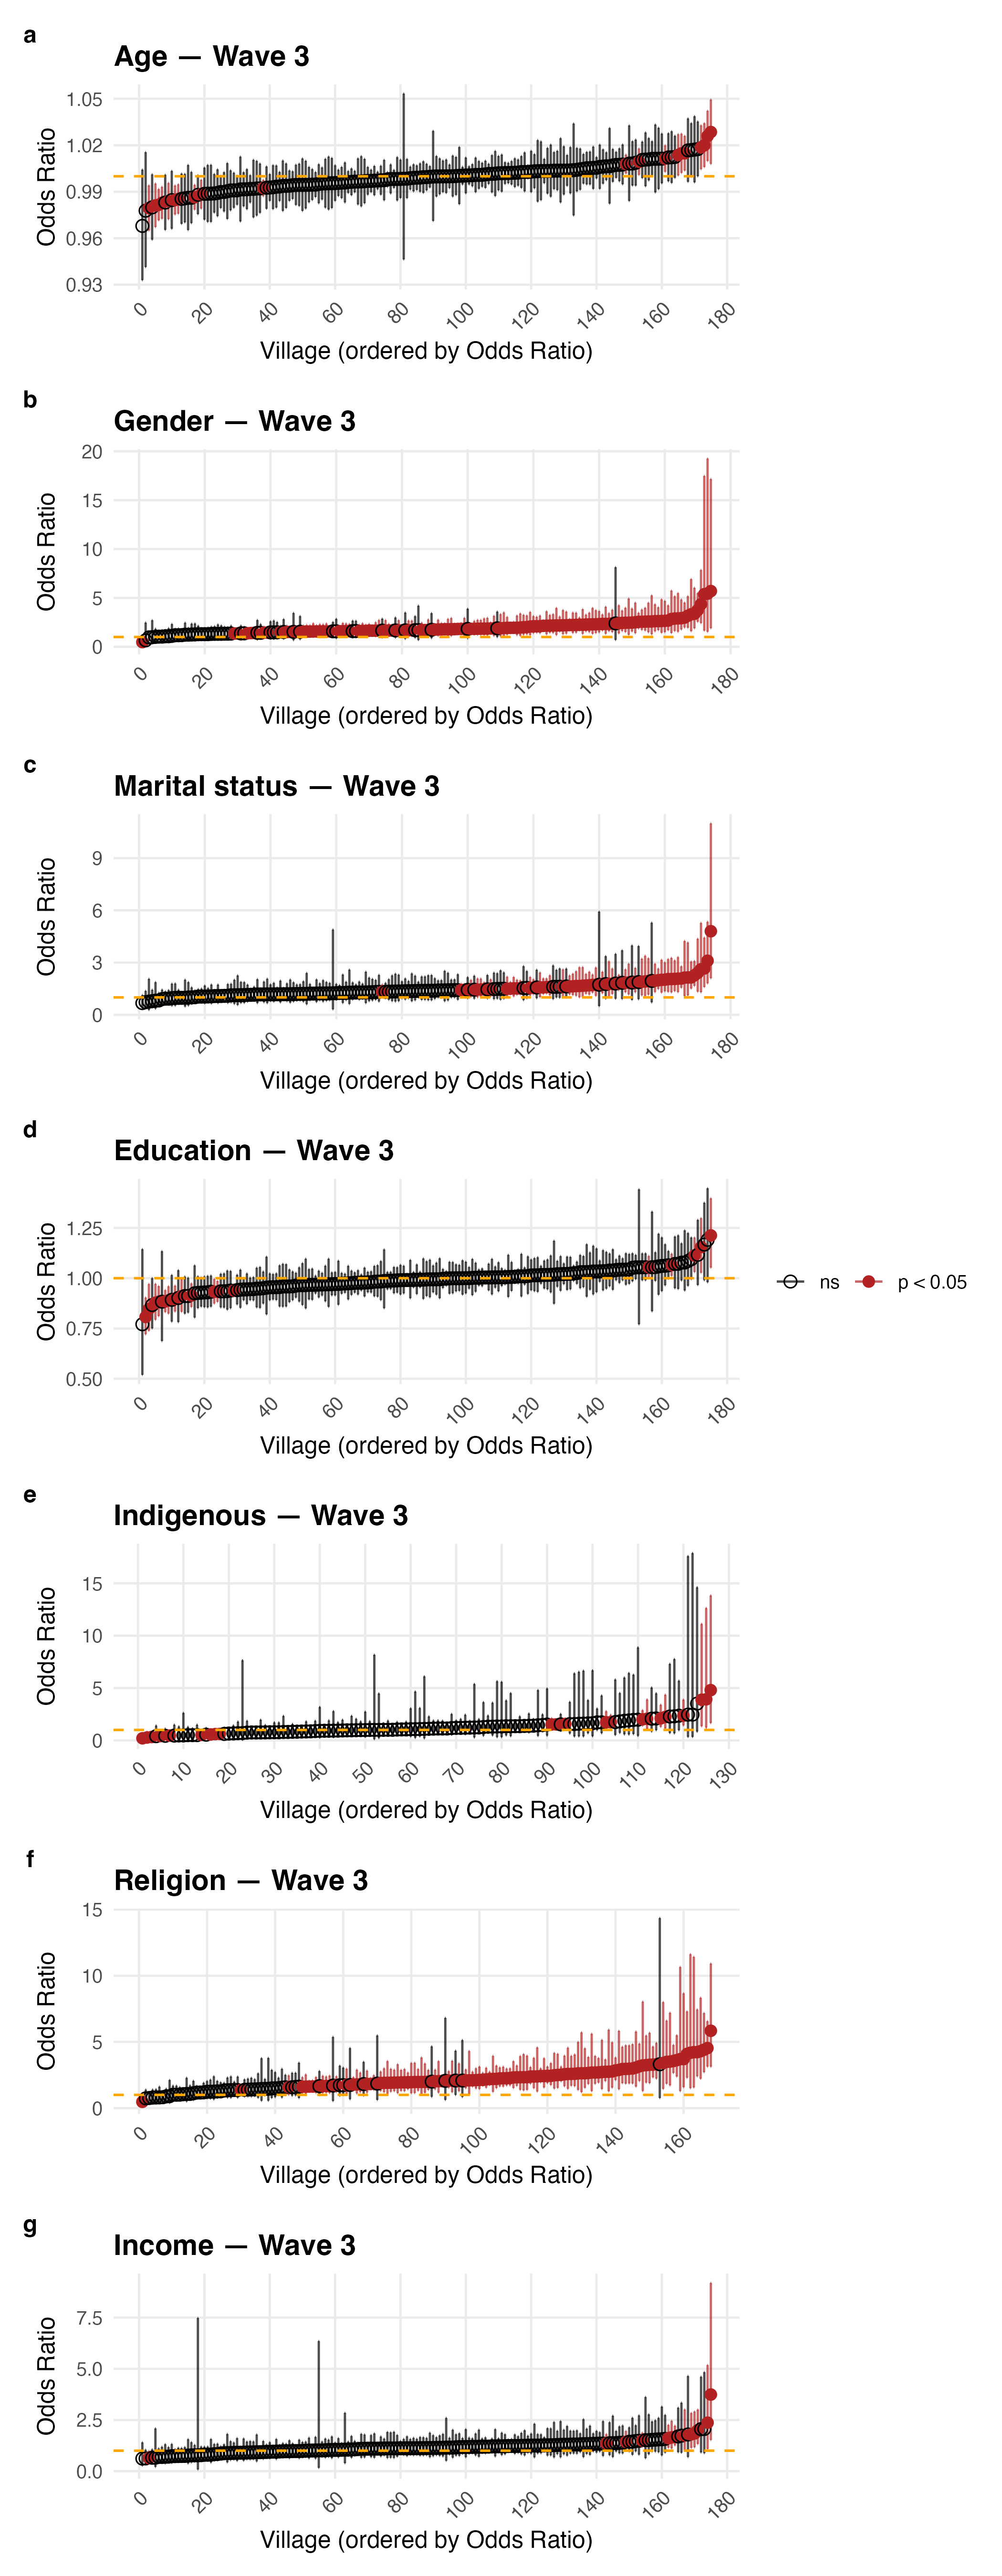
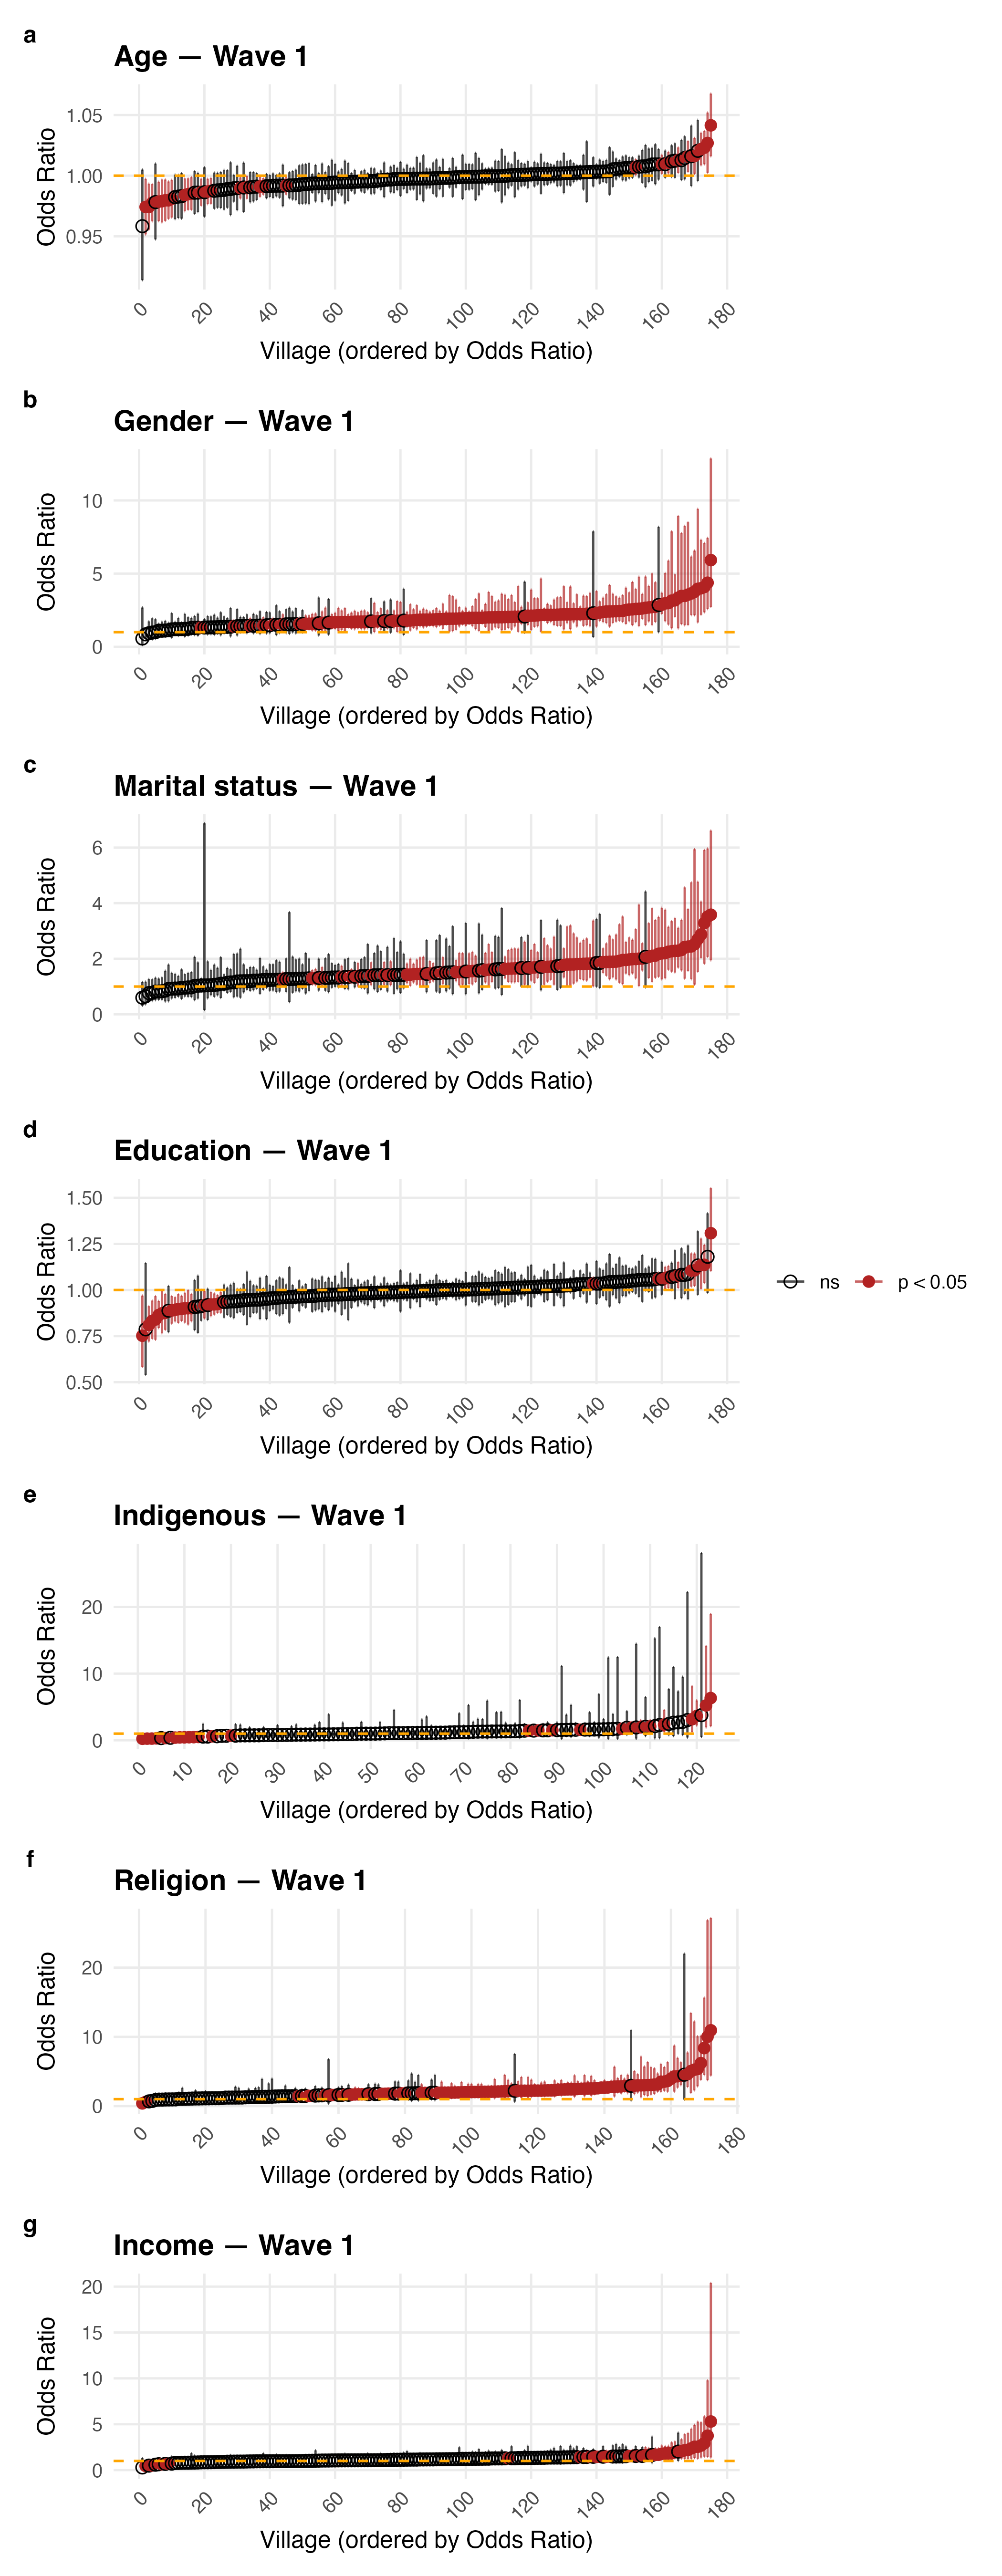
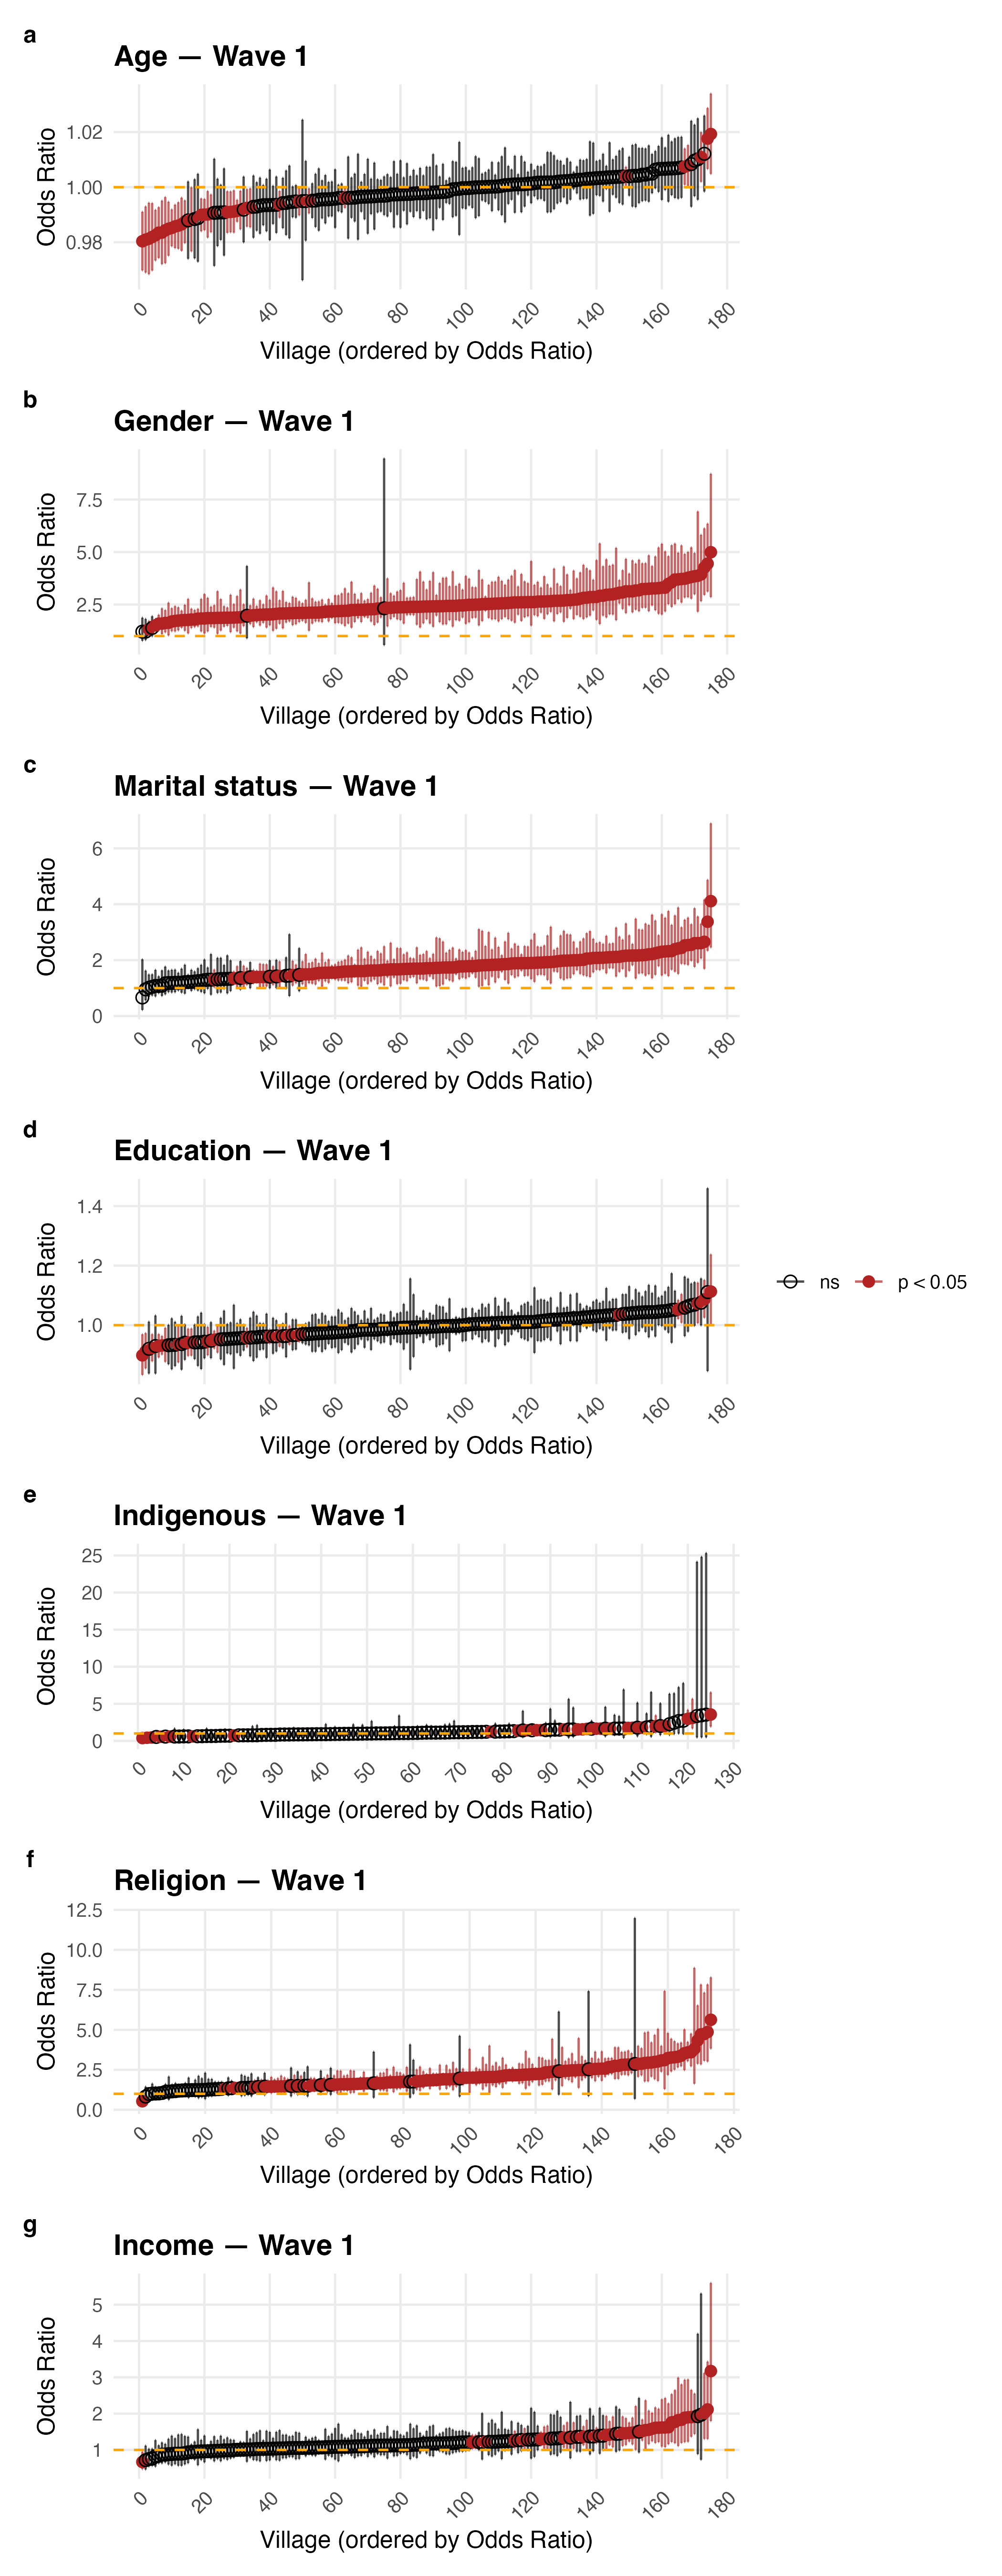
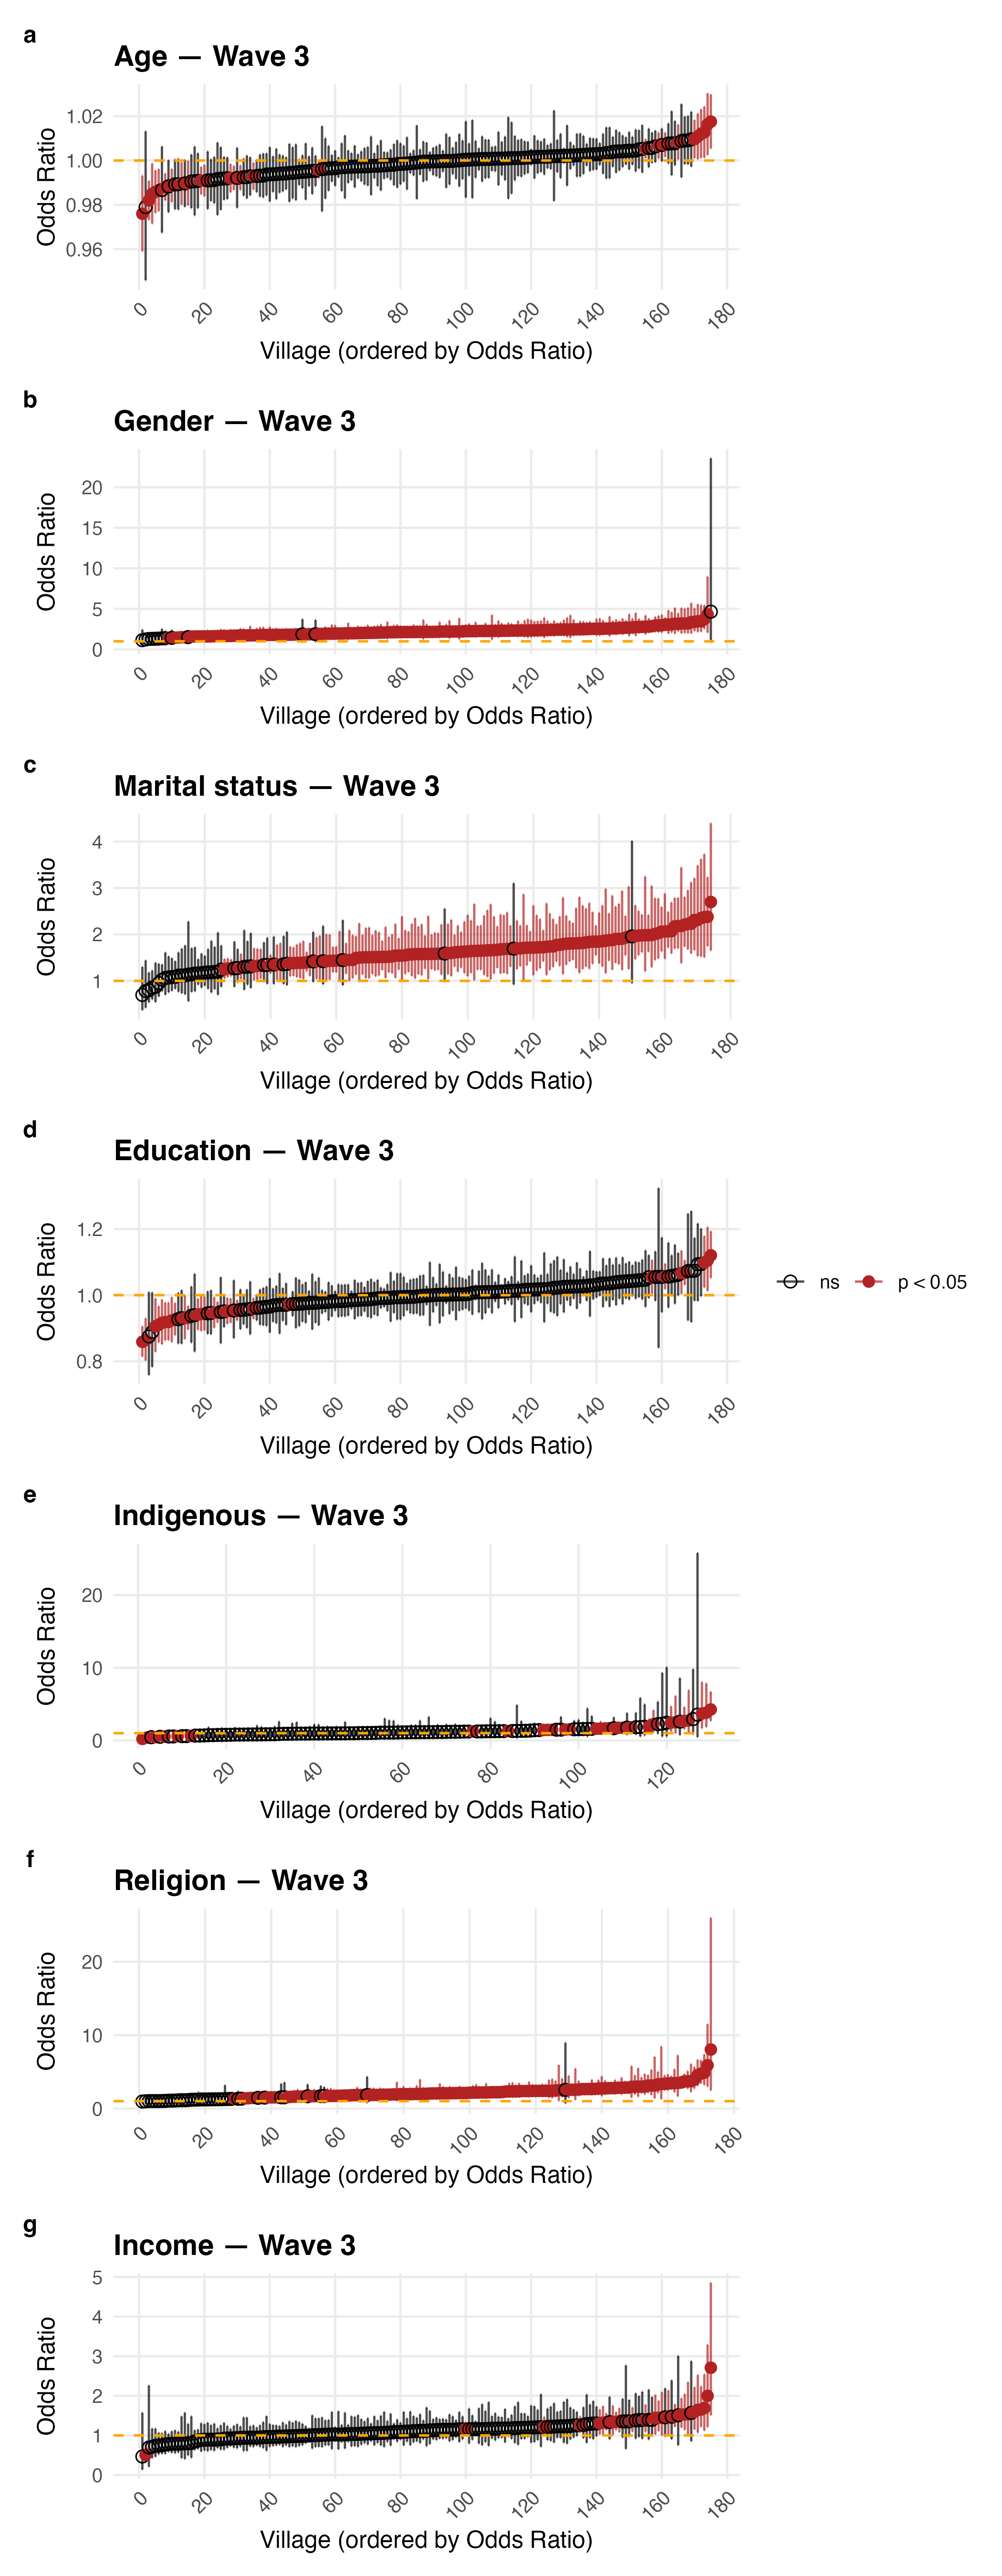
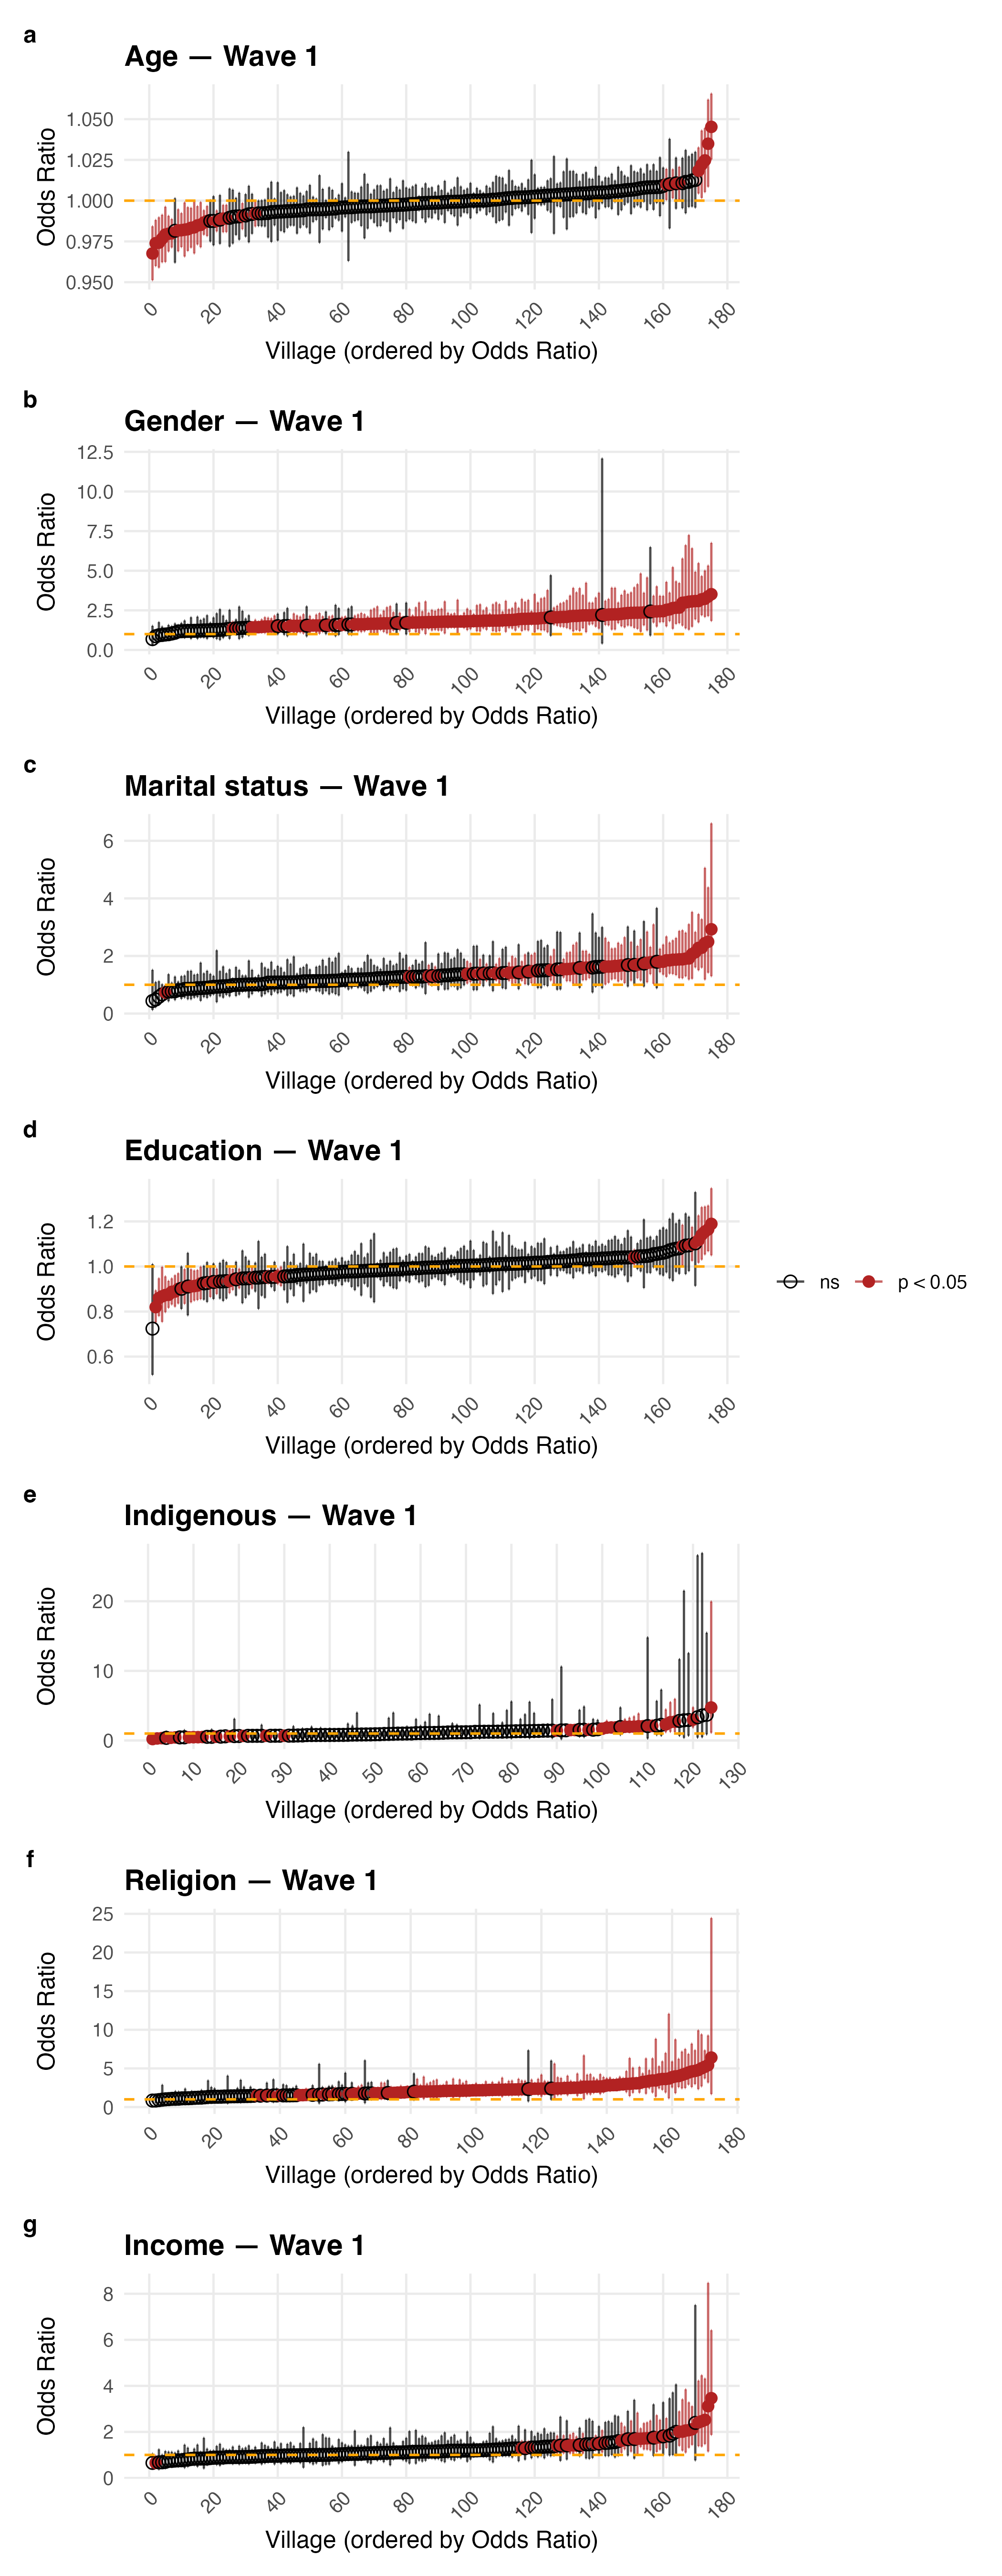
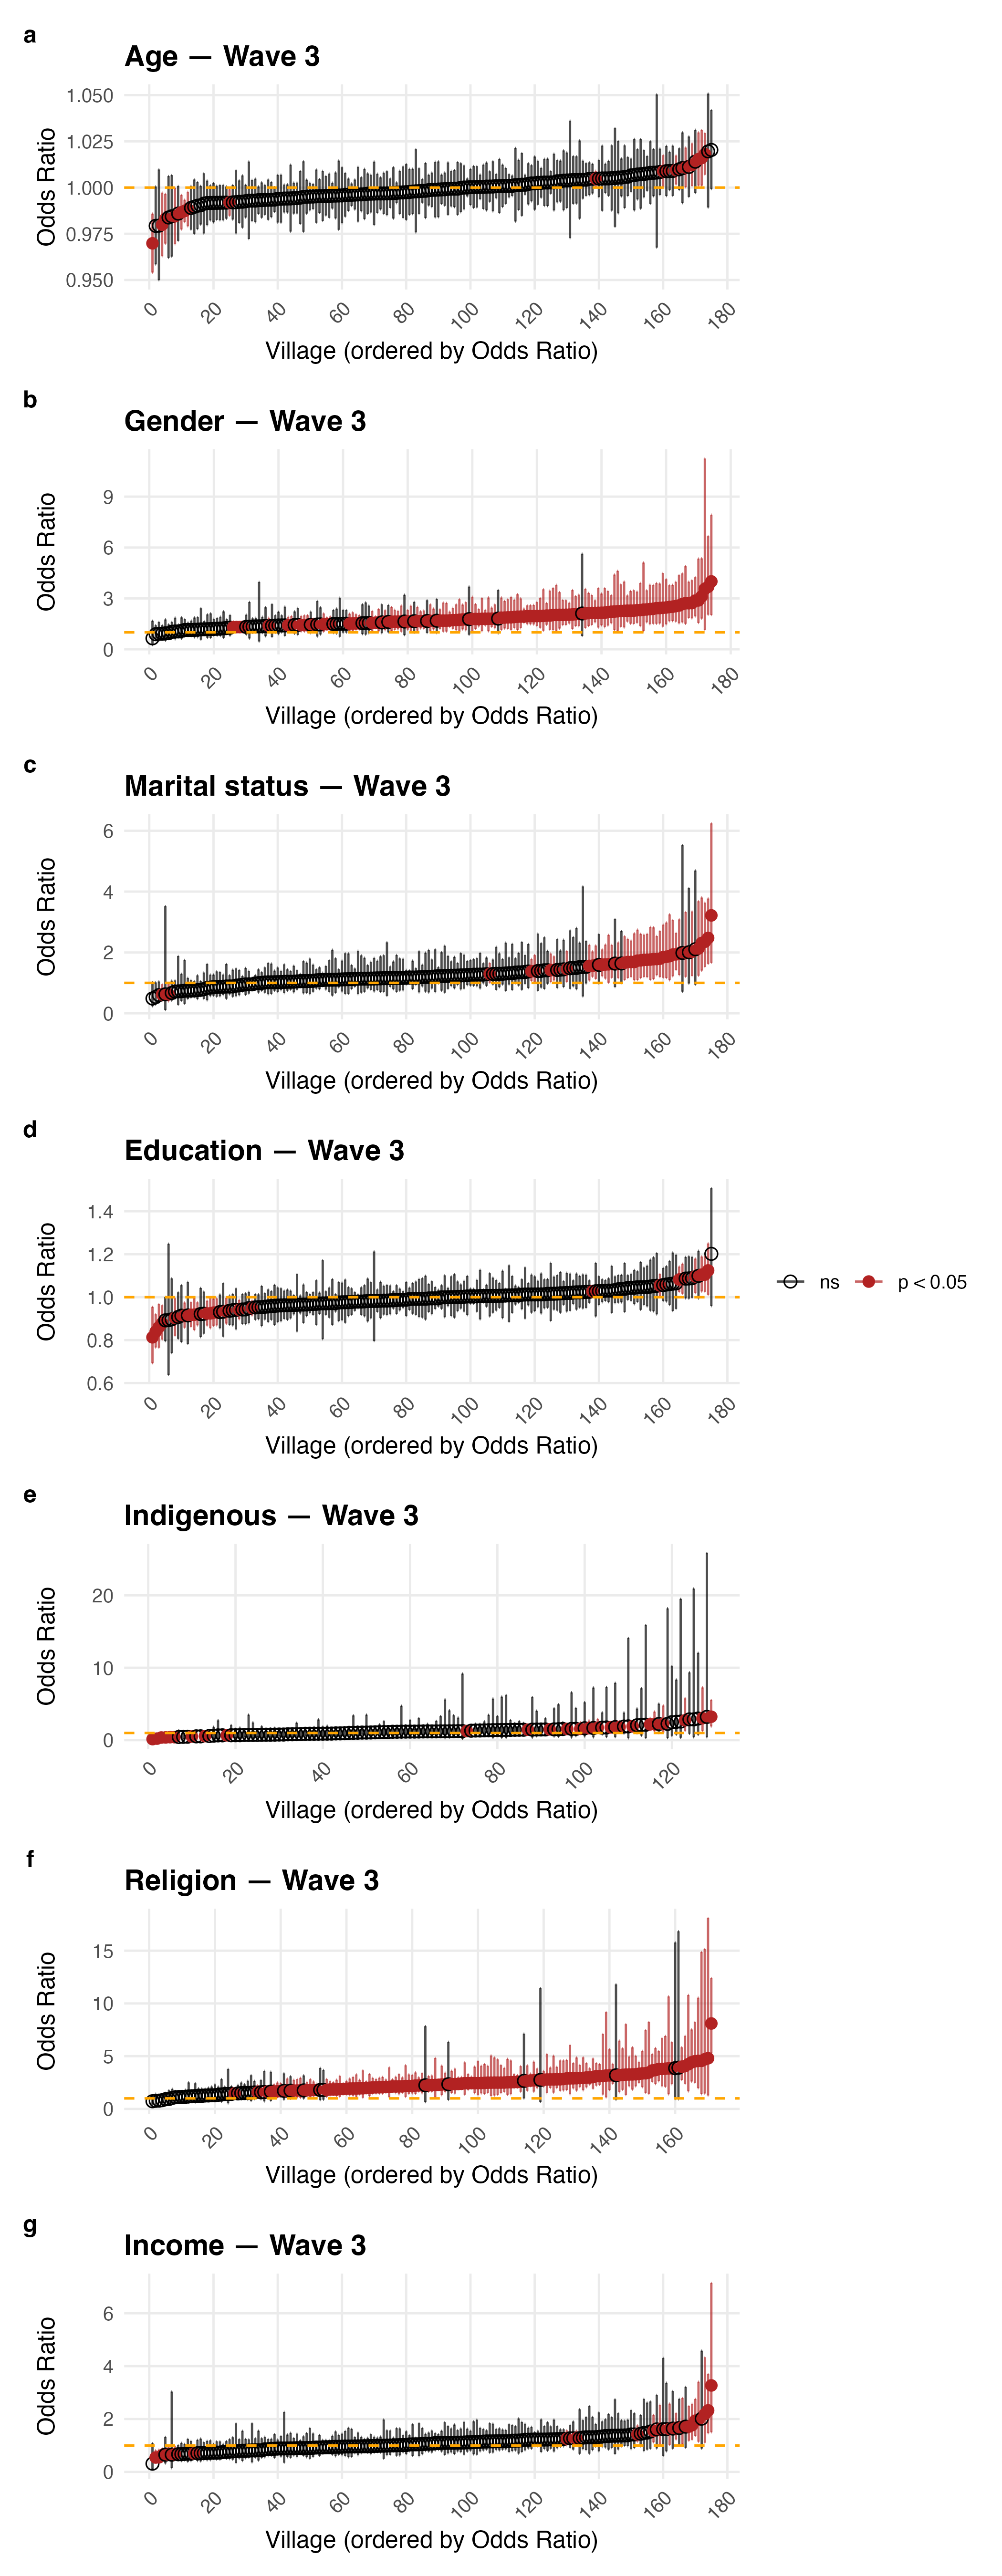
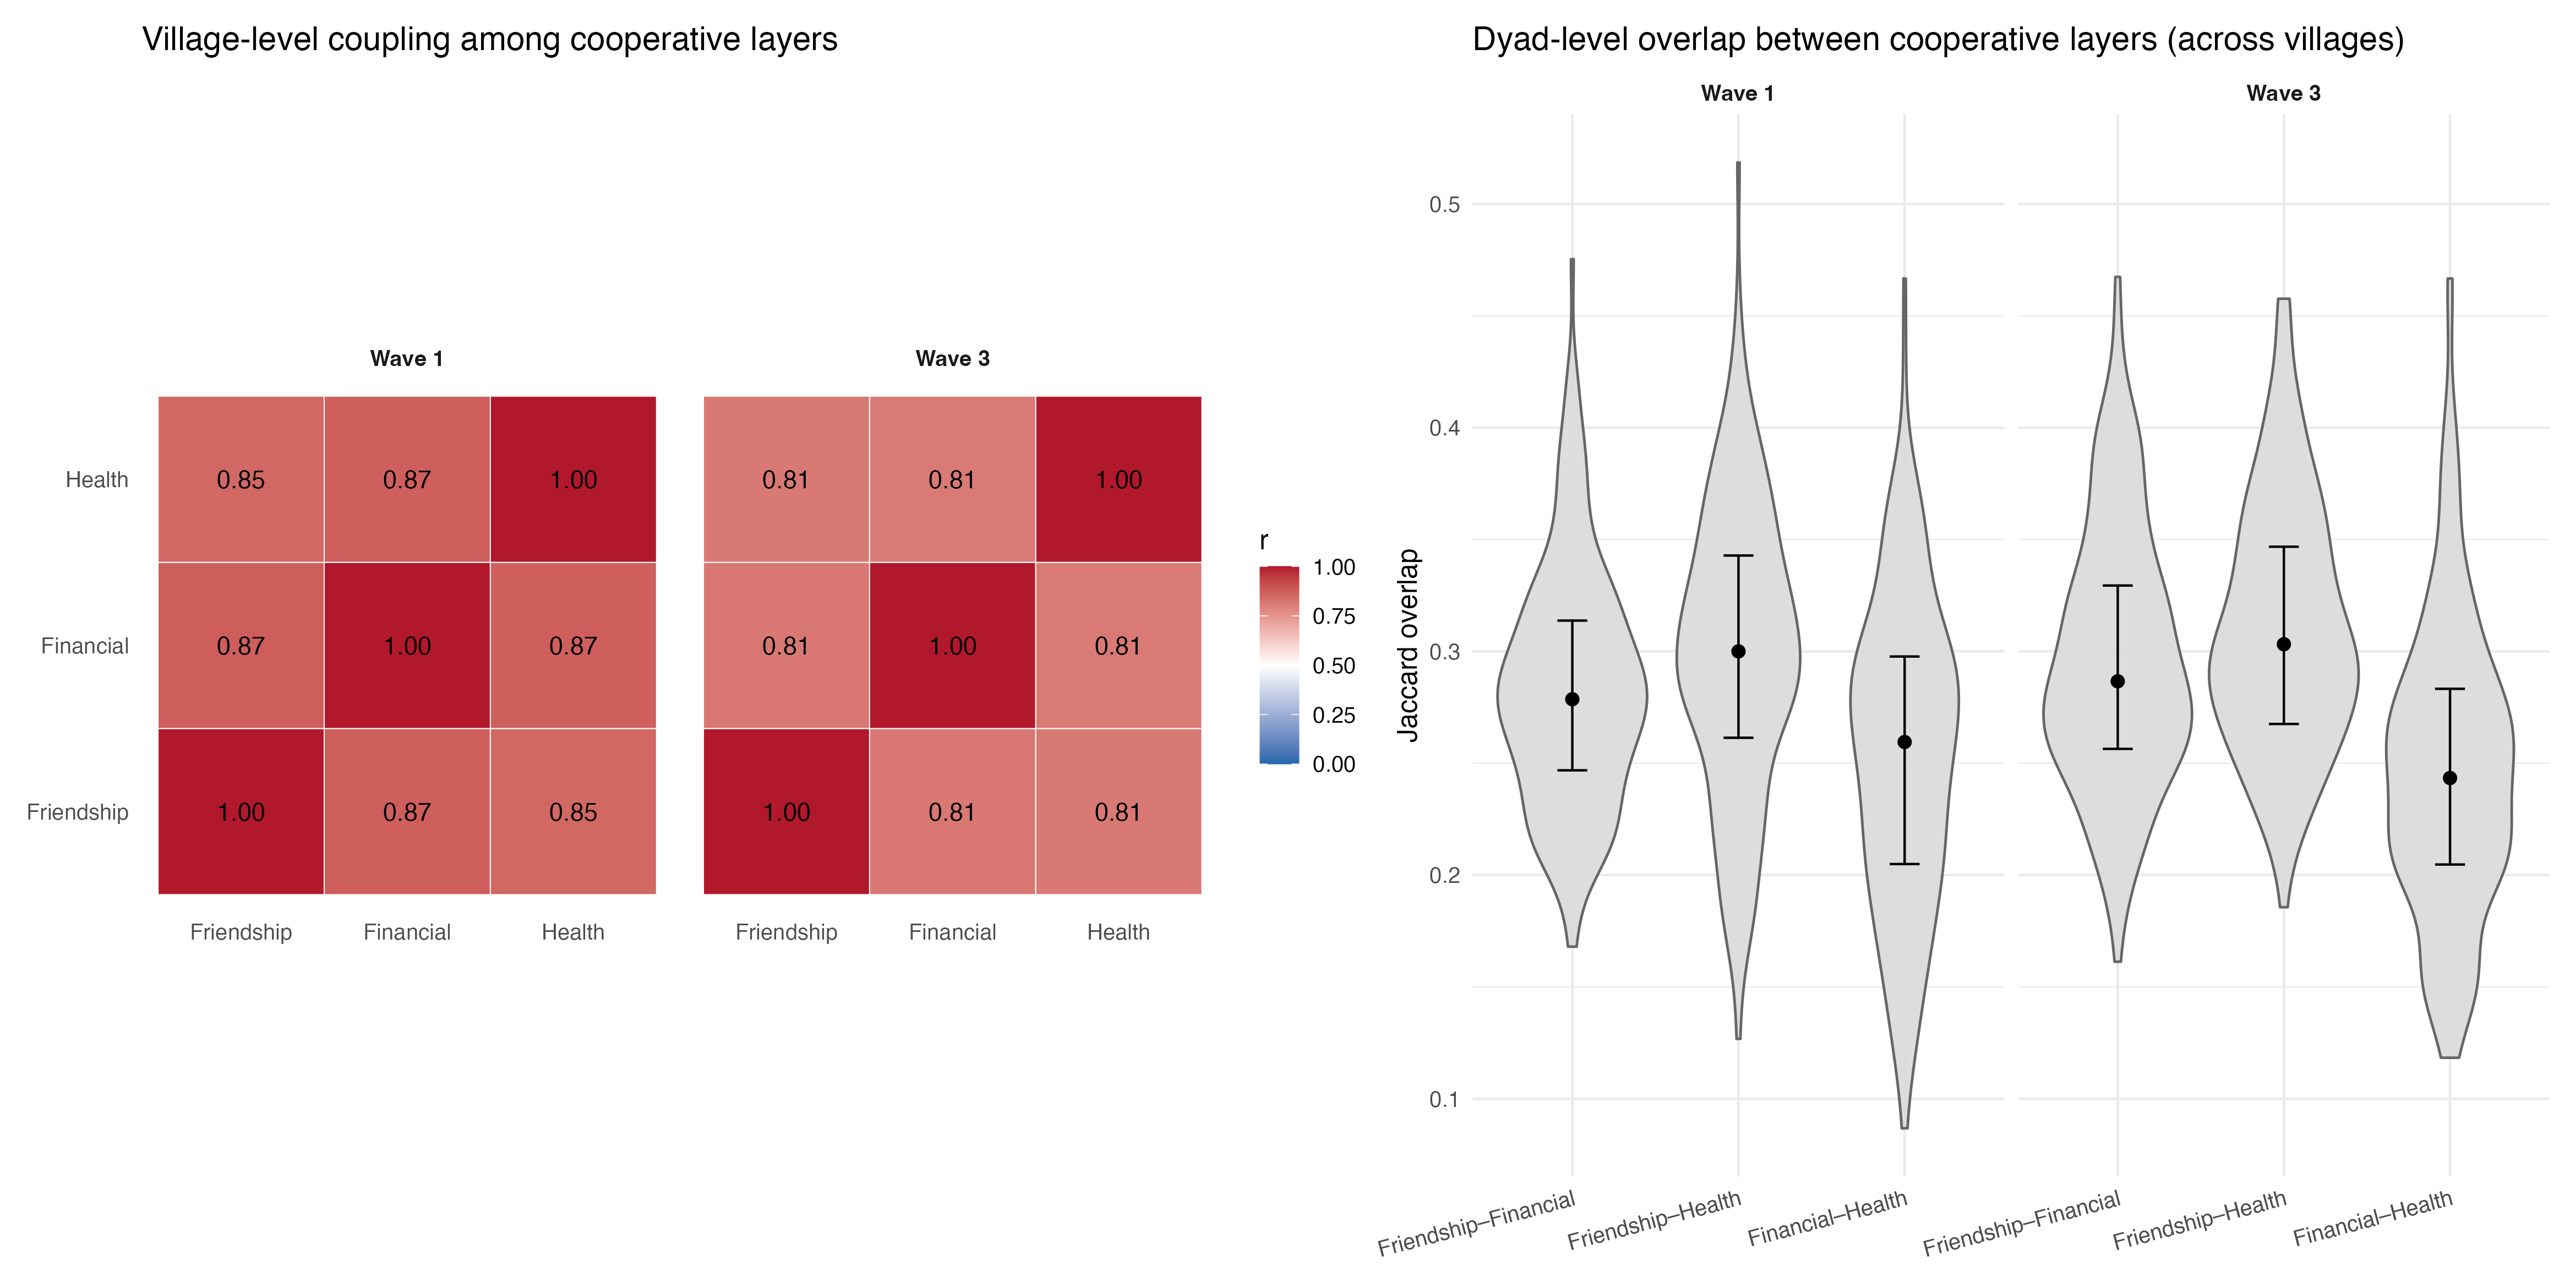
We examine static and dynamic social network structure in 176 villages within the Copan Department of Honduras across two data waves (2016, 2019), using detailed data on multiplex networks for 20,232 individuals enrolled in a longitudinal survey. These networks capture friendship, health advice, financial help, and adversarial relationships, allowing us to show how cooperation and conflict jointly shape social structure. Using node-level network measures derived from near-census sociocentric village networks, we leverage mixed-effects zero-inflated negative binomial models to assess the influence of individual attributes, such as gender, marital status, education, religion, and indigenous status, and of village characteristics, on the dynamics of social networks over time. We complement these node-level models with dyadic assortativity (odds-ratio-based homophily) and community-level measures to describe how sorting by key attributes differs across network types and between waves. Our results demonstrate significant assortativity based on gender and religion, particularly within health and financial networks. Across networks, gender and religion exhibit the most consistent assortative mixing. Additionally, community-level assortativity metrics indicate that educational and financial factors increasingly influence social ties over time. Our findings provide insights into how personal attributes and community dynamics interact to shape network formation and socio-economic relationships in rural settings over time.
Deep Dive into Deep description of static and dynamic network ties in Honduran villages.
We examine static and dynamic social network structure in 176 villages within the Copan Department of Honduras across two data waves (2016, 2019), using detailed data on multiplex networks for 20,232 individuals enrolled in a longitudinal survey. These networks capture friendship, health advice, financial help, and adversarial relationships, allowing us to show how cooperation and conflict jointly shape social structure. Using node-level network measures derived from near-census sociocentric village networks, we leverage mixed-effects zero-inflated negative binomial models to assess the influence of individual attributes, such as gender, marital status, education, religion, and indigenous status, and of village characteristics, on the dynamics of social networks over time. We complement these node-level models with dyadic assortativity (odds-ratio-based homophily) and community-level measures to describe how sorting by key attributes differs across network types and between waves. Our
Social networks shape individual behaviors, access to resources, and overall well-being (Smith and Christakis, 2008). They are associated with information flow, distribution of support, and the maintenance of social norms within communities. Investigating the factors that determine the formation and maintenance of social networks sheds light on how communities are bound together. This understanding is particularly vital in rural settings, where resources are often scarce, and social ties significantly impact individuals' access to support and opportunities.
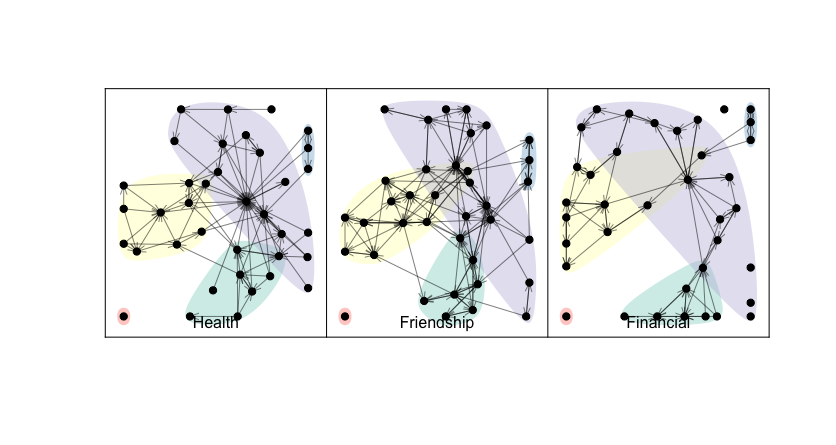
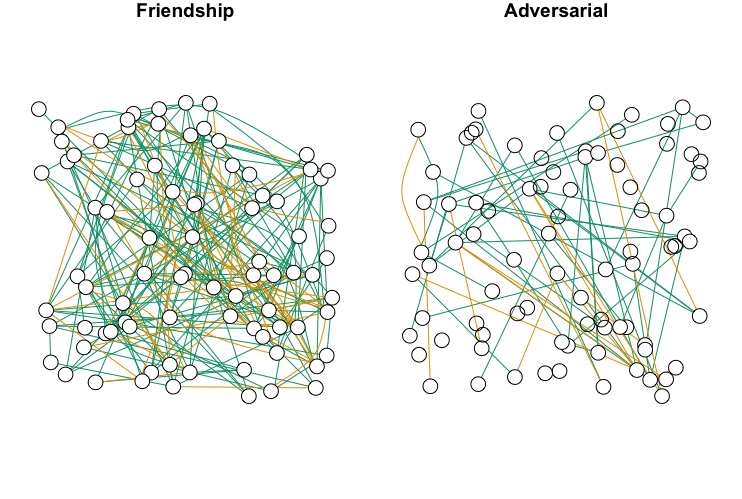
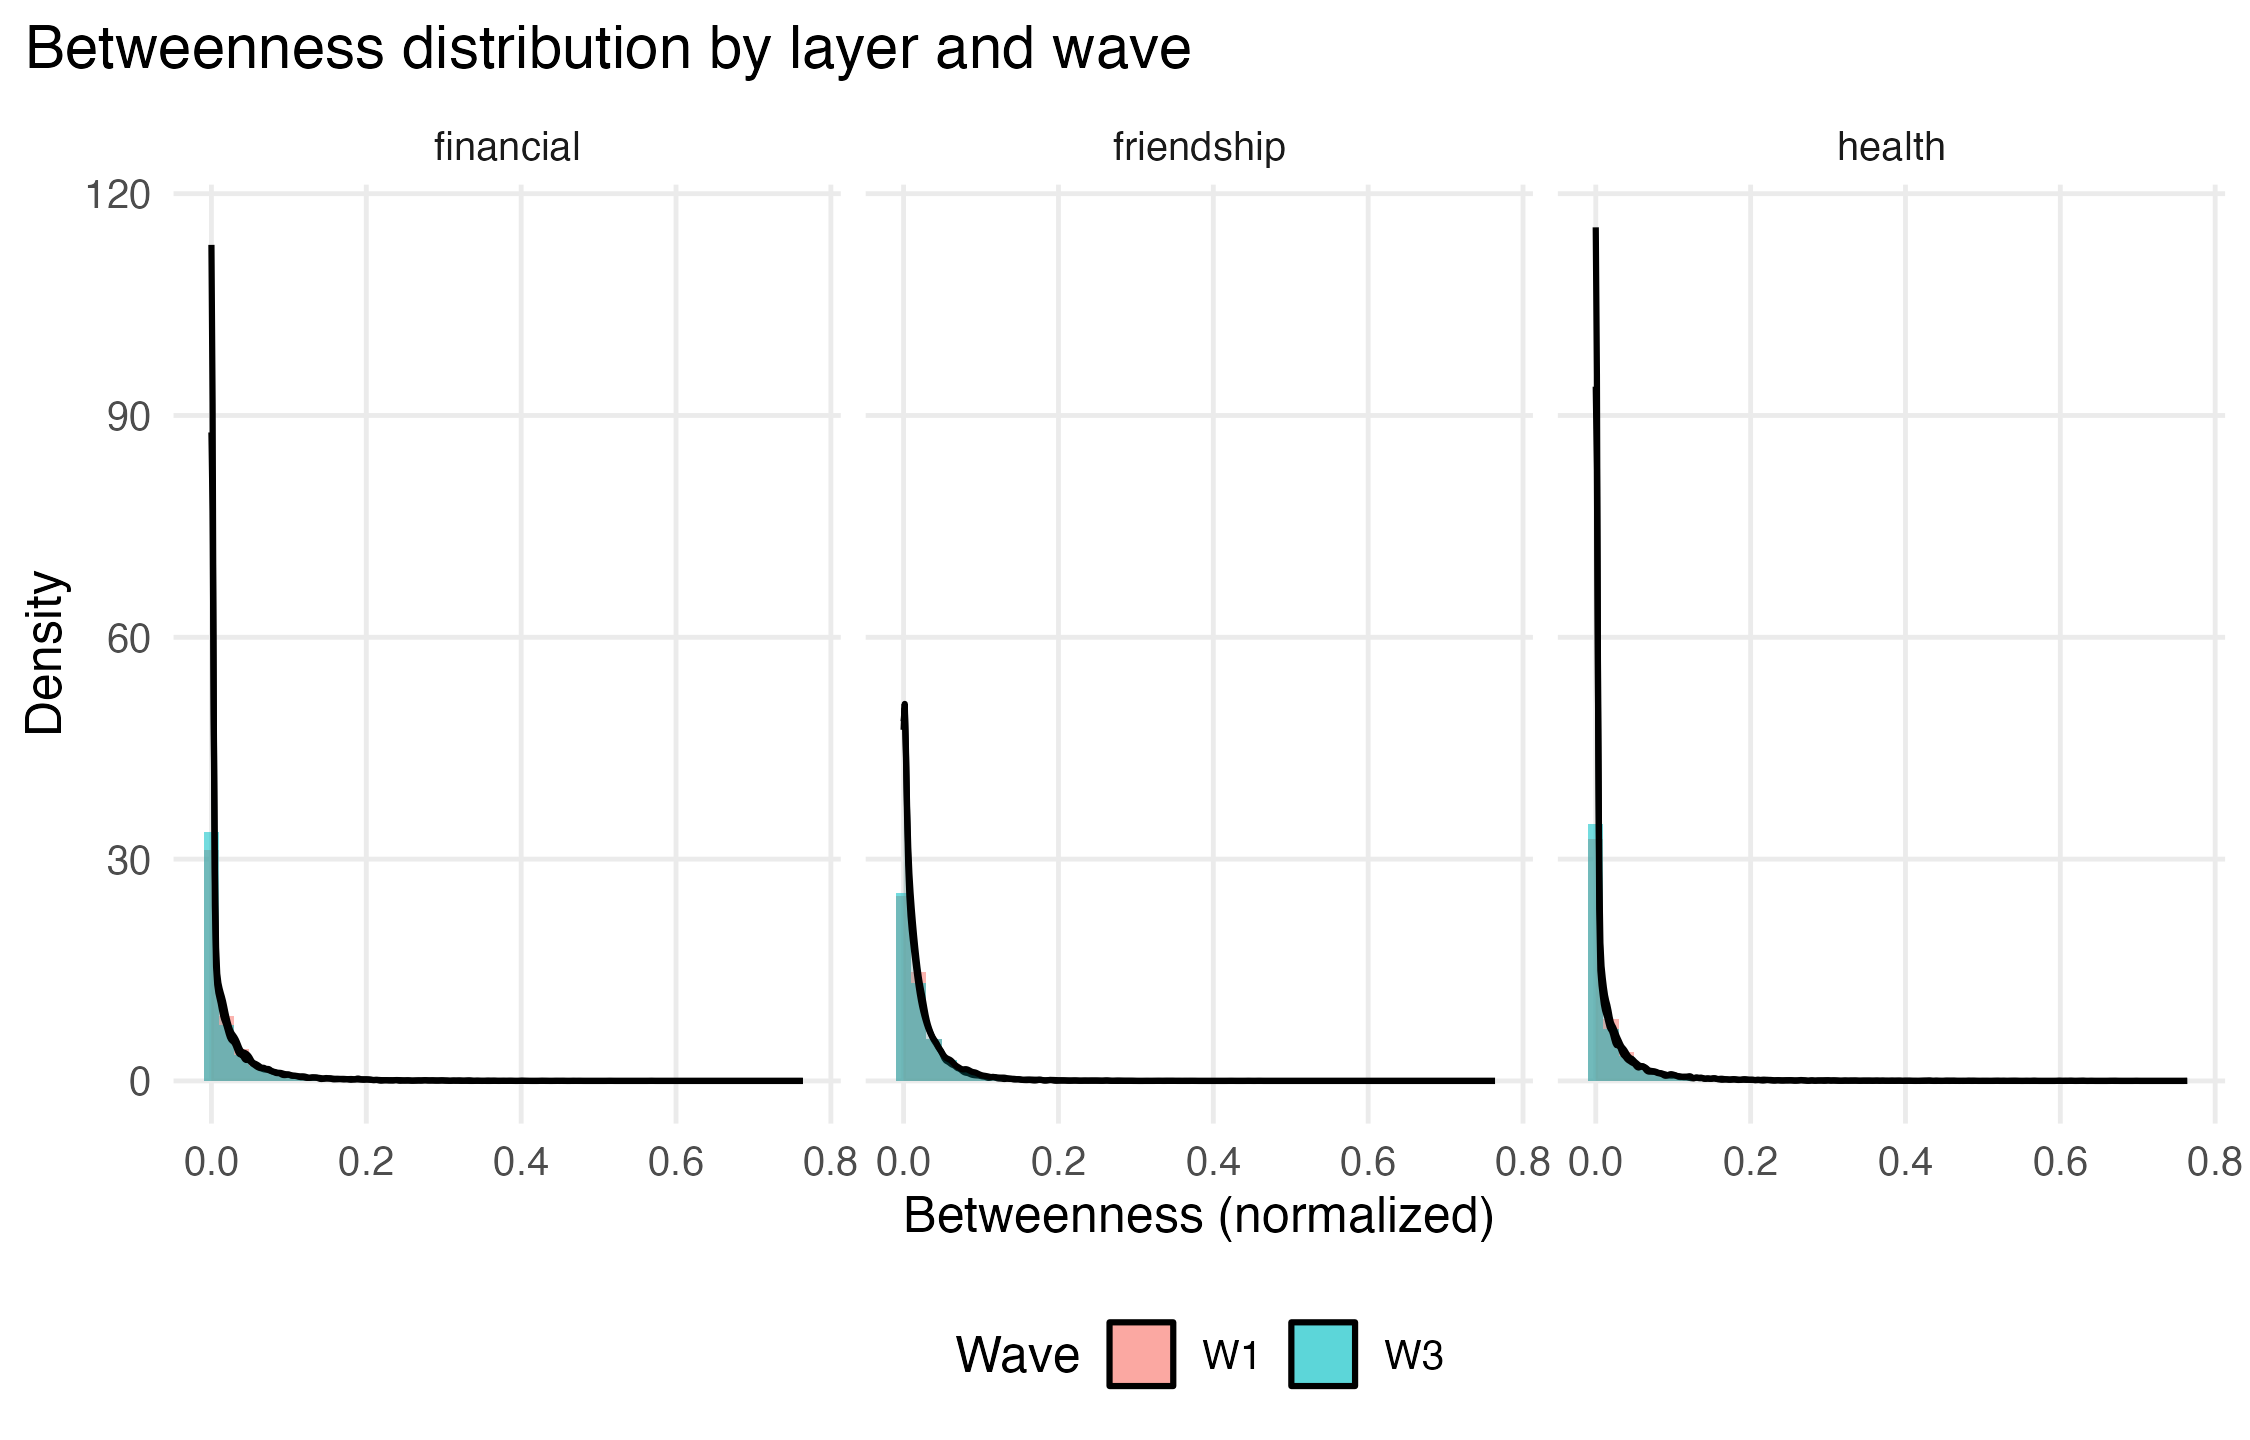
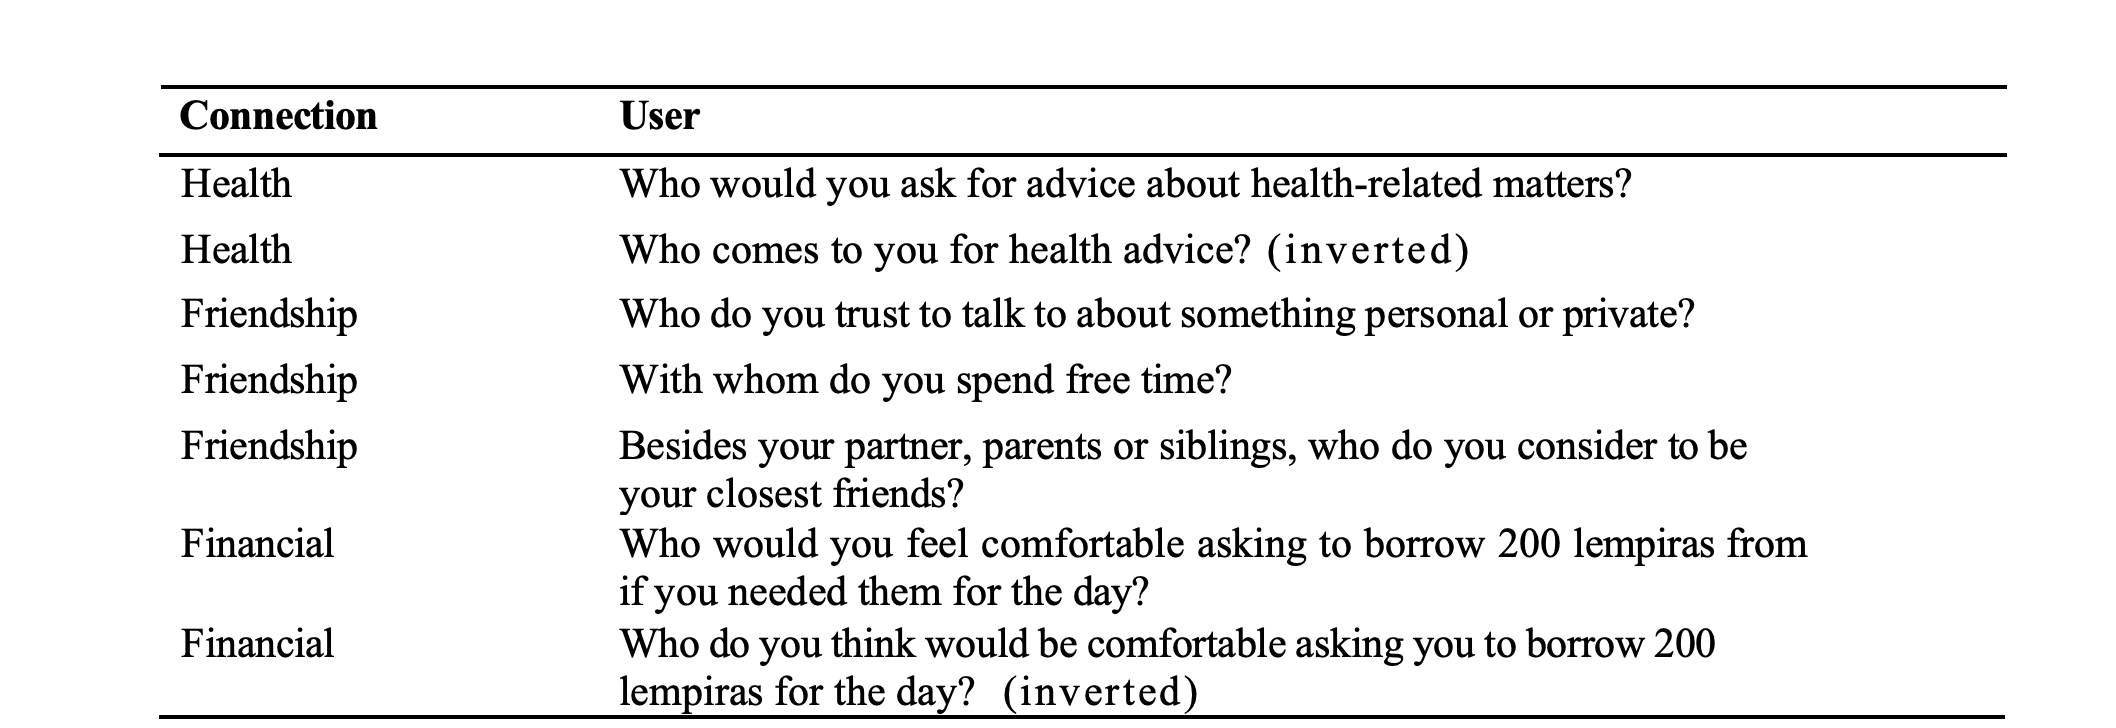
Here, we investigate the determinants of health, friendship, financial, and adversarial relationships among 20,232 individuals in 176 rural Honduran villages. By focusing on these diverse types of relationships, we aim to capture a holistic view of social network dynamics within these communities. Health advice relationships are crucial for understanding how individuals seek and provide care, while friendship ties reveal patterns of social support and companionship. Financial relationships shed light on economic exchanges and resource sharing. Adversarial relationships highlight conflict and social tensions. By examining these relationships, we identify the socio-economic and demographic factors that are associated with network formation and maintenance.
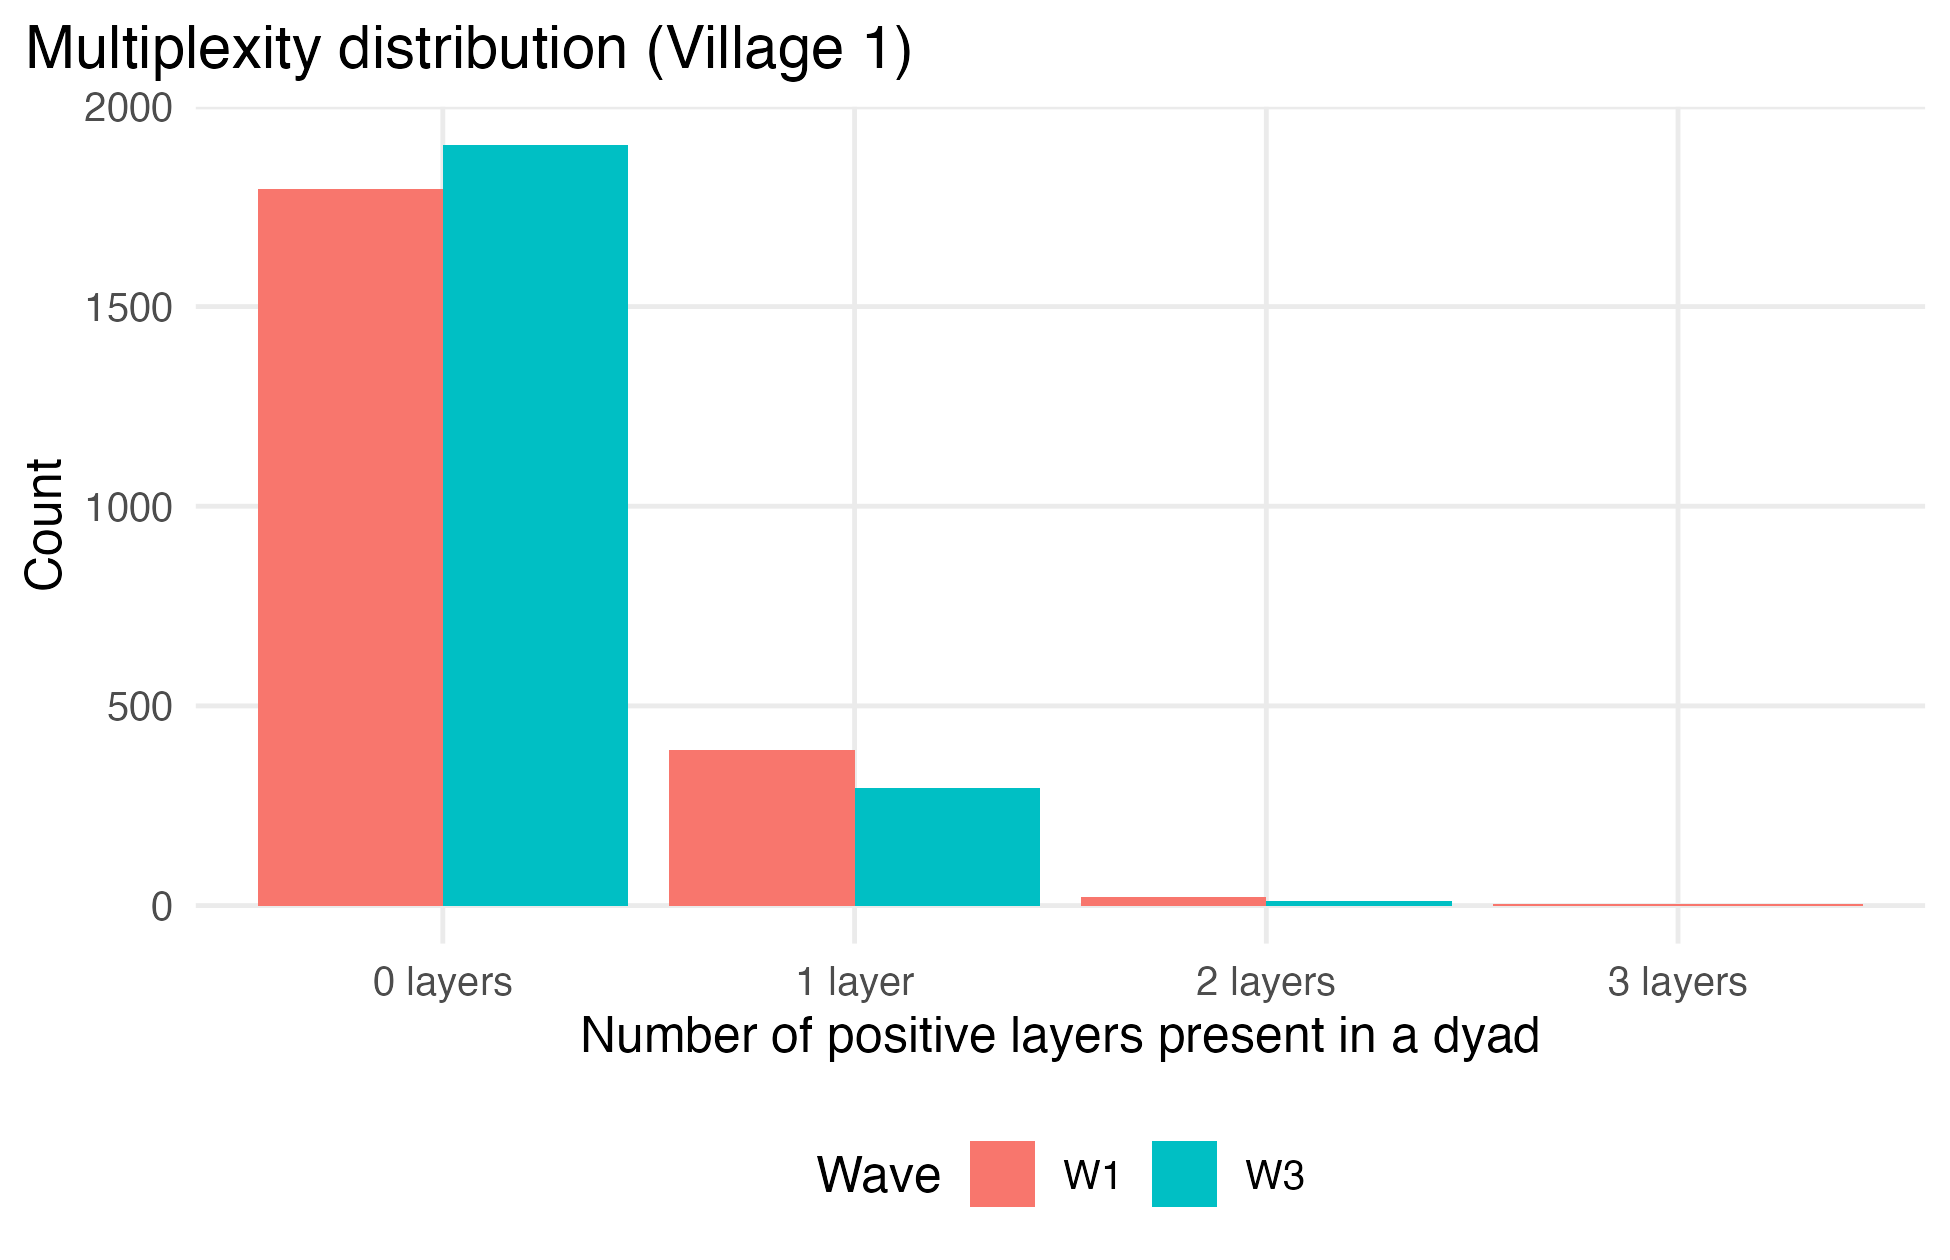
Village social life in low-infrastructure settings is multiplex: the same households exchange health advice, friendship, and financial help while also experiencing conflict. These ties shape how information moves, who receives support, and where disputes arise. Decades of work show that network structure can be leveraged to deliver programs and trace behavior change, from microfinance diffusion to health messaging and peer-influence experiments (Christakis and Fowler, 2010;Banerjee et al., 2013;Centola, 2010Centola, , 2011;;Kim et al., 2015;Hunter et al., 2015). At the same time, homophily and community structure can segment populations and limit reach. In single-layer village networks, communities are often “connected yet segregated,” with sharp alignment to social attributes such as caste or sex (Montes et al., 2018;Ghasemian and Christakis, 2024).
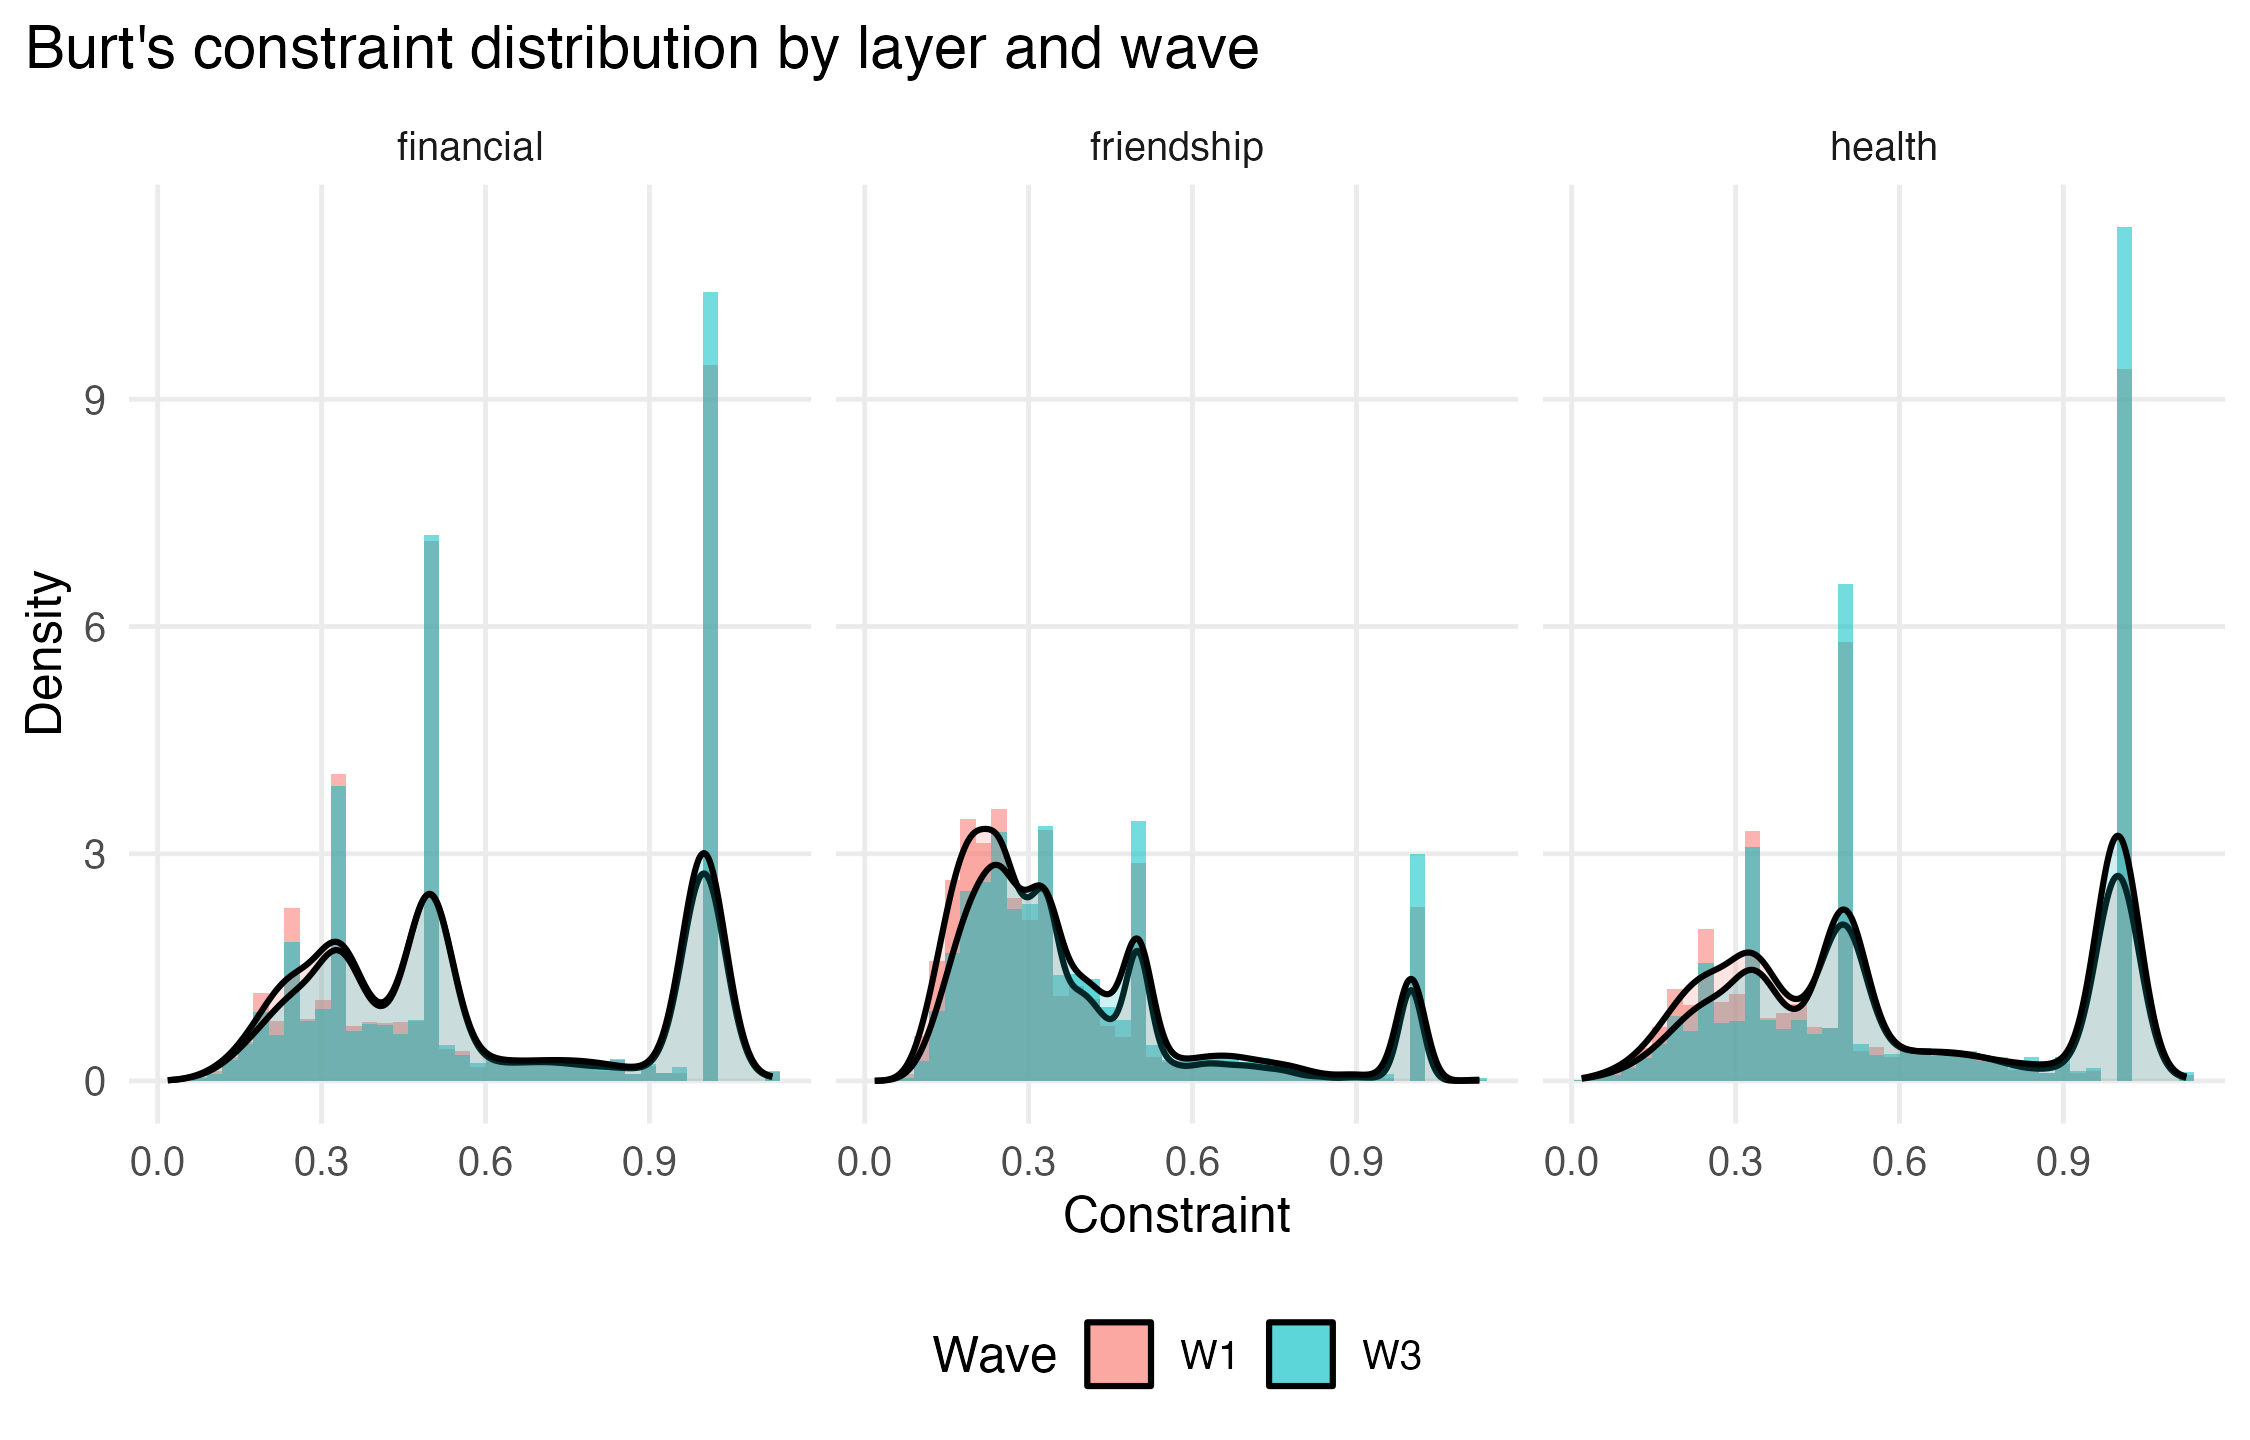
More specifically, empirical analyses of rural village networks across the Global South reveal dense, highly clustered structures that are nonetheless segregated along social lines, with substantial heterogeneity in individual positions and tie types that shapes diffusion and program reach Perkins et al. (2015). In 75 Karnataka villages, networks aggregated from 12 relationship types featured large connected components (typically ∼98% of nodes) and high clustering (∼ 0.6), yet strong dyad-level assortativity by caste (significant in 98% of villages; same-caste tie odds ratios ≈ 1.1-18.6) and by sex, and community partitions that aligned most with caste (normalized mutual information ≈ 0.39), while sex explained little of modular structure; (Montes et al., 2018). These patterns confirm homophily and triadic closure as organizing mechanisms in rural networks and help explain why diffusion often proceeds within identity-defined modules unless bridges are present (Newman, 2003;Henry et al., 2011;Fortunato, 2010;Blondel et al., 2008).
Related empirical work shows that network structure, rather than geography or simple demographics, predicts spread of innovations and behaviors in villages: microfinance participation in India followed network paths and was anticipated by centrality-based measures (Banerjee et al., 2013); experimental and field studies demonstrate that homophily and clustered topology modulate adoption dynamics (Centola, 2010(Centola, , 2011)), and that network-informed targeting, e.g., seeding nominated friends to exploit the friendship paradox, can outperform naive strategies in increasing population-level uptake (Kim et al., 2015;Hunter et al., 2015;Airoldi and Christakis, 2024).
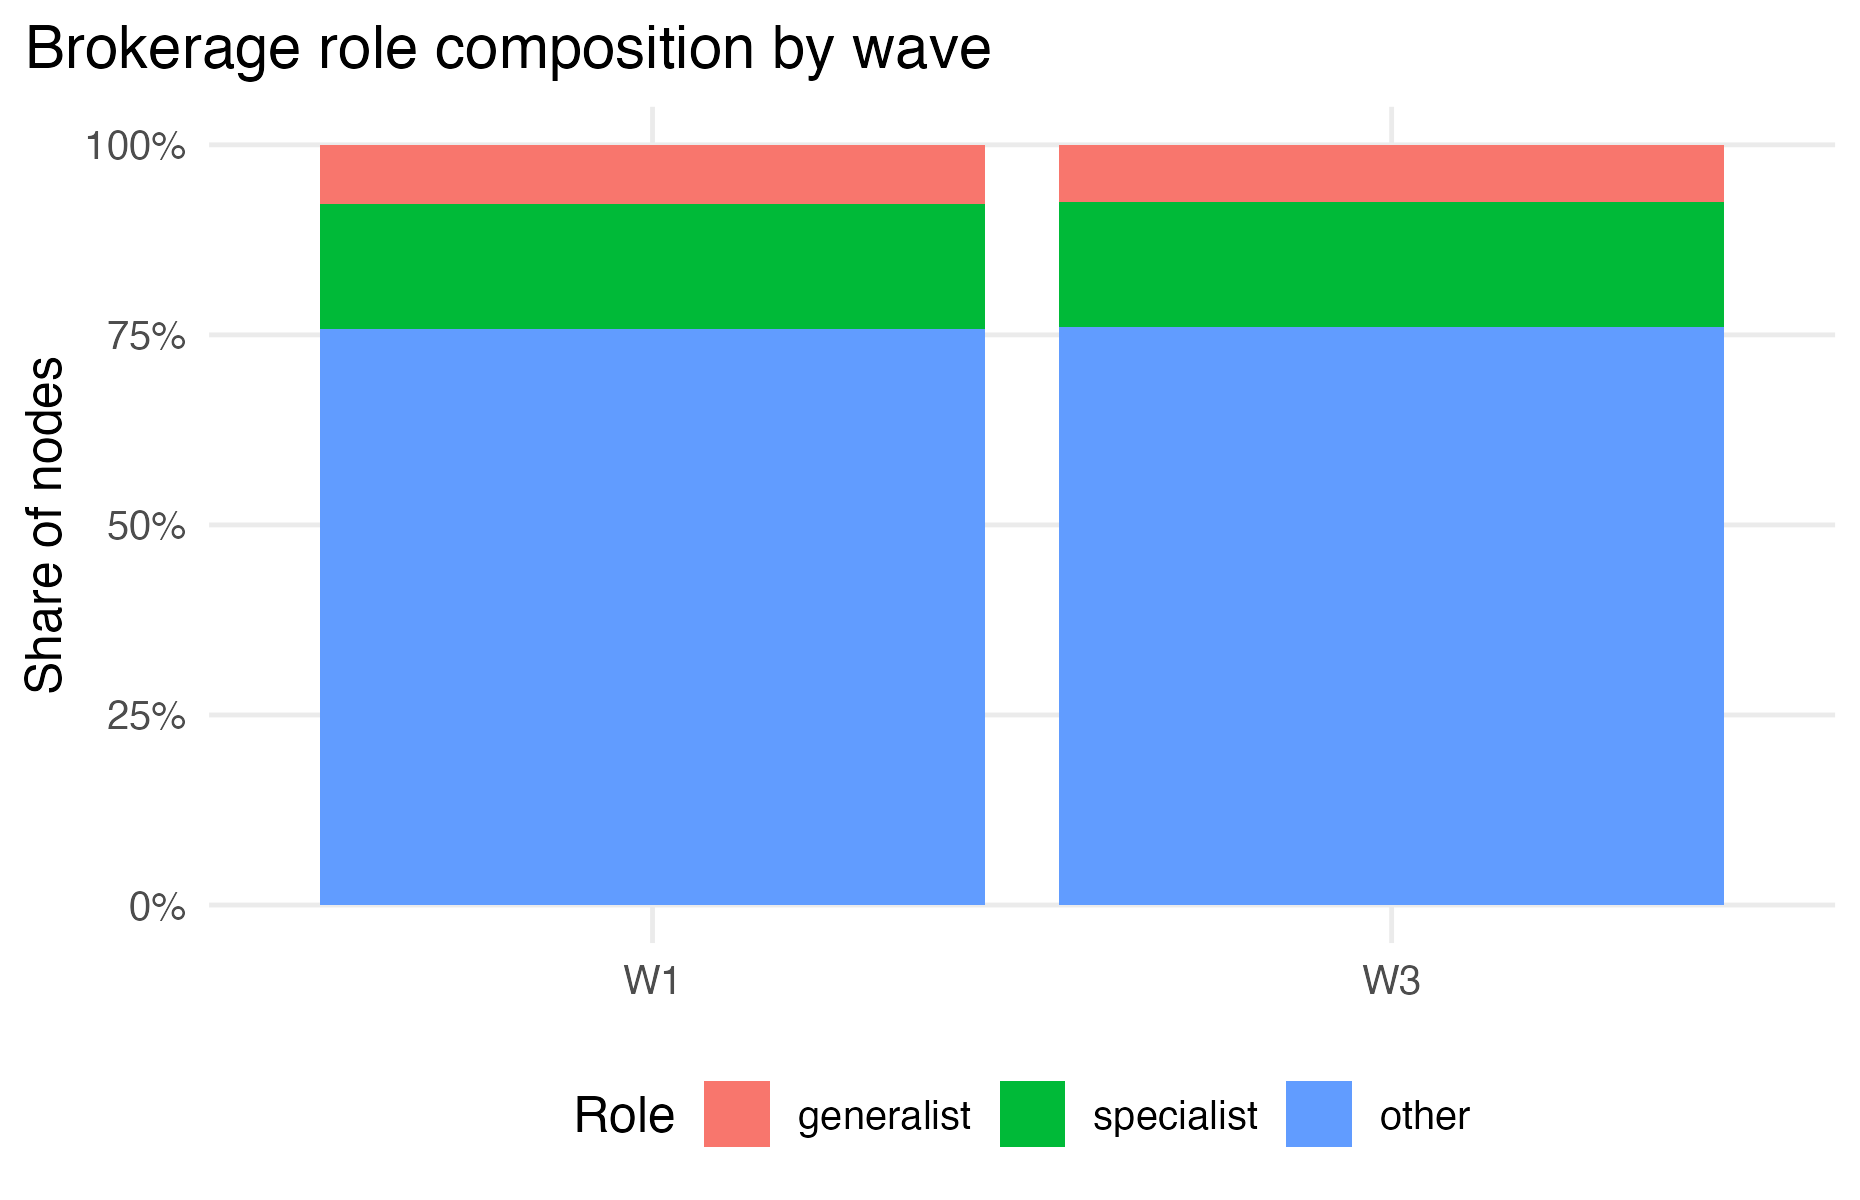
Beyond single-layer representations, the literature emphasizes multiplexity, distinct layers such as kinship, advice, and resource exchange that are not redundant and can differentially mediate contagion, implying that aggregating ties may obscure critical pathways for association (Porter et al., 2009;Kumpula et al., 2007;Airoldi and Christakis, 2024). At the same time, identity-based segregation (e.g., caste, religion, gender) and traditional institutions shape access to information and opportunity, generating village-to-village and within-village heterogeneity in network roles (hubs, brokers) and exposure to external ideas (Munshi and Rosenzweig, 2006;Sanyal, 2015;Berreman, 1972;Patil, 2014).
Methodologically, studies have leveraged a community detection and modularity (Girvan and Newman, 2002;Fortunato, 2010;Blondel et al., 2008), assortativity metrics (Newman, 2003;Noldus and Van Mieghem, 2015), and statistical network models (Hoff et al., 2002;Wang and Wong, 1987;Robins et al., 2007), while design-oriented work has highlighted that ignoring homophily can bias
…(Full text truncated)…
This content is AI-processed based on ArXiv data.