MRC-GAT: A Meta-Relational Copula-Based Graph Attention Network for Interpretable Multimodal Alzheimer's Disease Diagnosis
Alzheimer's disease (AD) is a progressive neurodegenerative condition necessitating early and precise diagnosis to provide prompt clinical management. Given the paramount importance of early diagnosis, recent studies have increasingly focused on comp…
Authors: Fatemeh Khalv, i, Saadat Izadi
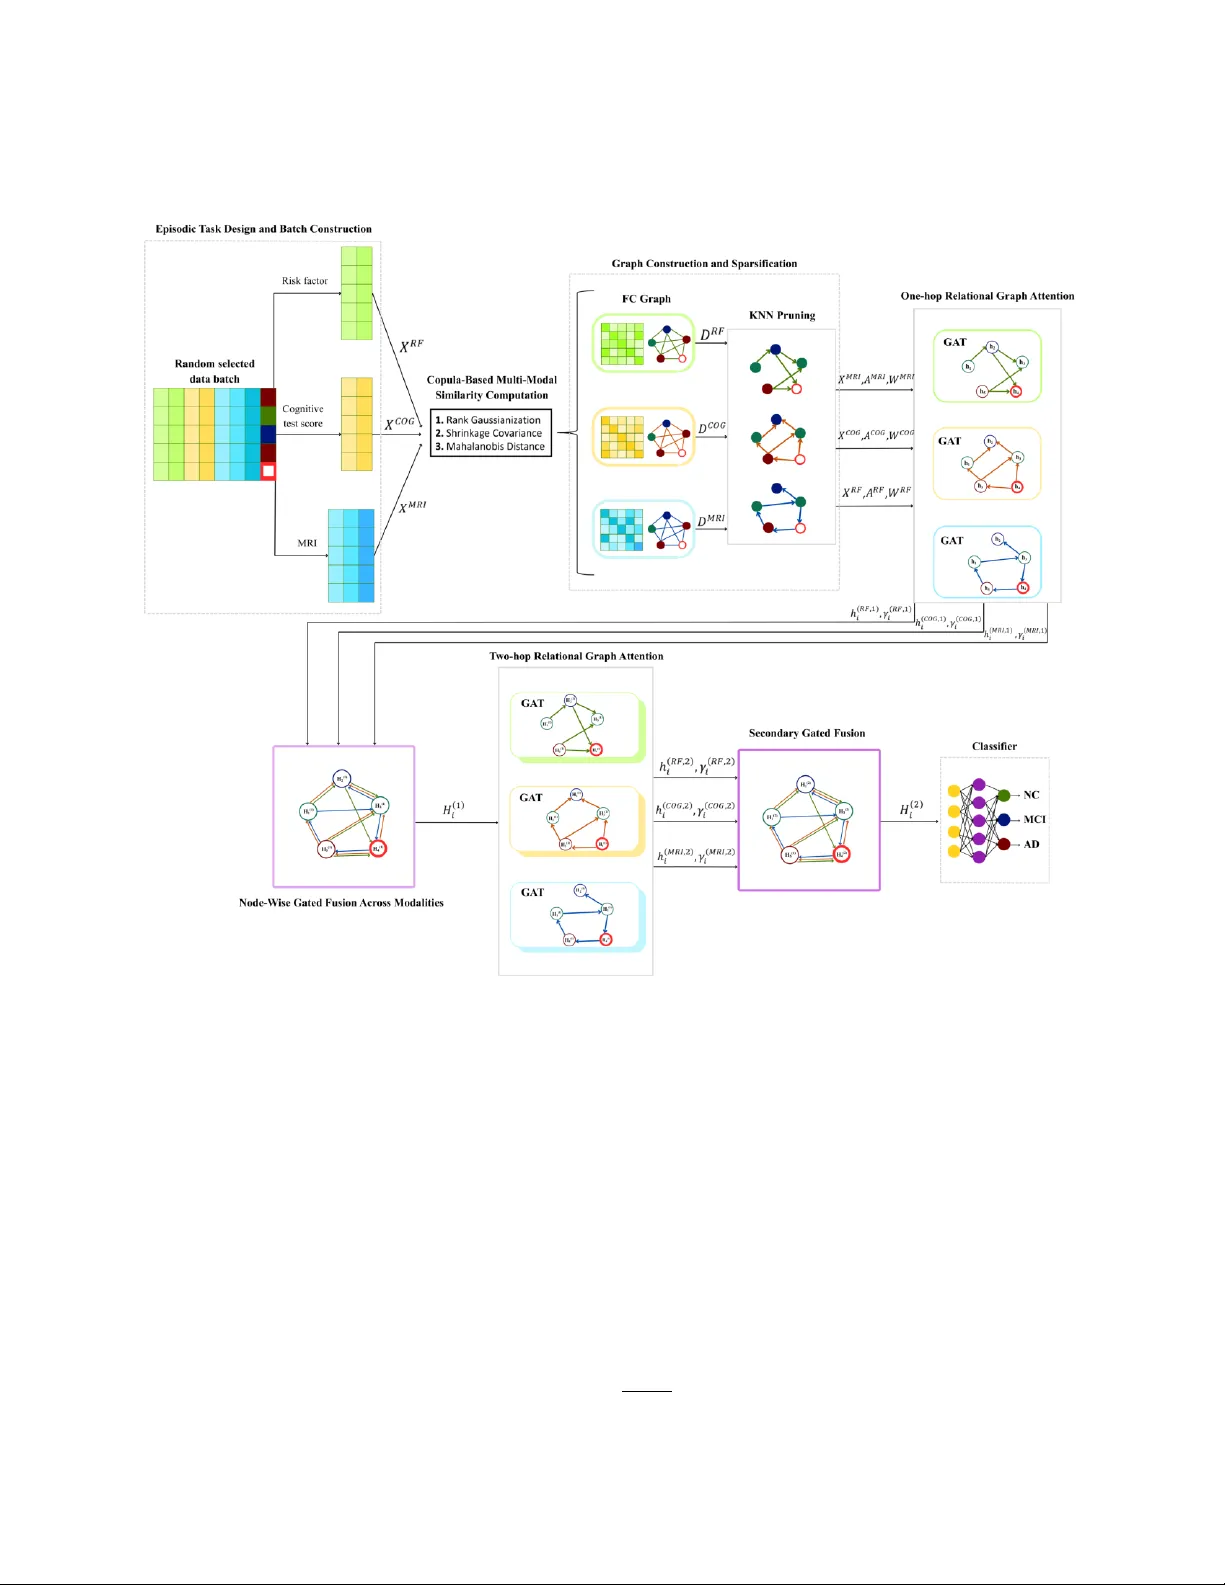
MRC -GA T : A Meta-Relationa l Copula-Based Gr a ph A ttention N etwork for Interpr etable Multimodal Alzheimer's Disease Diagn o sis Fatemeh Khalvand i, Saadat Izadi and Abdolah Cha lechale * Computer Engineering Department, Razi University , Kermanshah, Iran f.khalvandi@stu.razi.ac.ir , s.izadi@razi.ac .ir , chalechale@razi.ac.ir Abstract Alzheimer ’ s disease (AD) is a progr essive neurodeg enerative condition necessitating early an d precise d iagnosis to provide prompt clinical management. Given t h e paramou nt importance of early diagnosis , recent s tudies have increasingly focused on computer-aided diagnostic models to enhance precision and reliability . However , most gr aph - based approaches still rely on fixed structural designs, which restric t th eir flexibility and limit g eneralization across heterogen eous patient data. T o overcome these limitations, the Meta-Relational Copula-Based Graph Attention Network (MRC -GA T) is proposed as an efficient multimodal model for AD classification tasks. The proposed architecture, copula-based similarity alignmen t, relational attentio n, and node fusion are integrated as the core components of episo dic meta-learning , such that the multimod al features, including risk factors (RF), Cog nitive test scores, and MRI attributes, are first aligned via a copula -based transform ation in a common statistical space an d then combined by a multi-relational attentio n mechan ism. According to evaluations perfor med on the T ADPOL E and NACC datasets, the MRC-GA T model achieved accuracies of 96.87% and 92.31%, respectively , demonstrating state - of -the-art per formance compared to existing diagnostic models . Finally , the p roposed model conf irms the robustness and applicability o f the proposed method by pr oviding interpretability at v arious stages of disease diag nosis. Index T erms : Alzheimer ’ s disease, multimo dal feature , copula-based similarity , graph attention network (GA T), meta - learning, in terpretability . 1. Introduction Alzheimer ’ s disease is an irreparab le and progressive neurod egenerative disease, mainly affecting o lder people, causing d rastic impairm ent in cog nitive function s, memory l oss, and b ehavioral changes [1] . W ith the increa sing agin g population in the entire global health setup, Alzh eimer ’ s cases are o n the rise, and estimates show th at by 2050, mo re than 130 million people are likely to suf fer from Alzheimer ’ s, causing an enormous burden on the entire global health infrastructur e. The pre- dementia phase of Alzheimer ’ s, identified as Mild Co gnitive Impairment (MCI), is an intermediate phase betwe en aging and dementia, wherein the required cognitive f unctions ar e diminished, but the capability to manag e day - to -day activ ities is main tained [2] . The lack of any conclusive treatmen t [3] , underlin es the prime importance of early detection and subsequent interventions to co ntrol the p rogression o f Alzh eimer ’ s and improve the health o utcomes [4] . The diagnostic requirements for Alzheimer ’ s gener ally entailed co gnitive function tests like the Mini- Mental State Examination (MMSE) and the Clinical Demen tia Rating (CDR) [5] , accompan ied by neuroimaging techniques, fo cusing on o btaining structural and functional details on the patho logy of Alzh eimer ’ s and MCI, describ ing the abno rmalities in the Alzh eimer ’ s an d MCI -inflicted brain s [6 ] . Th ese techniques, being very cumbersom e, require extensive expertise and possess low accuracy rates, thereby underlining the increasing demands and requirements for sophisticated co mputer-aided diagnostic tech niques, possessing enhanced accu racy and efficiency in Alzheimer ’ s diagnostics. Based on the weakn esses of co nventional d iagnostic appro aches and neuroimaging an alysis tech niques, various studies h ave been conducted to develop innovative advanced computing appro aches , intending to improve early Alzheimer ’ s d isease diagnosis. In early -stage diagnostic stud ies, conventio nal machine learning classifiers, including logistic regression, sparse inverse co variance estimation , and mu lti -kernel SVMs, were used to disting uish between Alzheimer ’ s d isease, Mild Cognitive im pairment, and Cognitive Nor mal ( CN) and showed moderate accuracy and * Corresponding author poor gener alization . Later research stud ies proposed en semble learning and feature selection tech niques, in cluding random forest and RFE- SVM, for improving multimodal feature lear ning and enhancing d iagnostic ac curacy [7, 8] . Subsequently , convolutional neural networks (CNNs) showed significant improvements by learning spatial discriminative features from MRI and EEG and transforming into hig h -resolution 3D an d multimodal feature a nalysis for comprehensive d isease modeling and characterization [9 -13]. However , those CNN ap proaches disreg ard the relational depen dencies among different r egions o f th e b rain. In this regar d, Graph Neu ral Networ ks (GNNs) hav e been identified as robust alternatives to regular CNN ap proaches, as they can model an d cap ture relation al dependences as well as individual variances of the subject -specific data, h ence exhibiting s up erior interpretability a nd robustness in subject- specific predictive modeling tasks [14- 17] . nov el advan ces in mu ltigraph and fu sion learning models and approaches have shown im proved biomarkers and accuracy by in tegrating and combining v arious graphs along with multimodal em bedding models [18 - 20] . In summary , all those latest studies and r esearch sho w significant and continuous progress towar d the parad igmatic shift toward innov ative and advanced g raphs and multimo dal learning approaches with considerations toward leveraging improved accur acy an d diagnostic efficiency in Alzheimer ’ s analysis and modelin g. Non etheless, there are still various resear ch challeng es and questions y et to be resolved and an swered appropriately . Despite the significan t success achiev ed by the graphical ap proaches proposed for Alzheimer ’ s disease diag nosis, some issues still n eed to b e resolved to improve generalization and applicability . First, the presence of natural variability between multimo dal patter ns, includ ing MRI, cognitiv e, and risk factors, makes it difficult to accur ately calculate similarity measures between different individuals, of ten introducing no isy an d vo latile gr aph patterns [18, 19] . In add ition, CNN-based models are efficient in learning spatial patterns but inefficient in handling non -imaging features, inclu ding demographics an d family history , which are essential f or fully und erstanding and modeling the disease [20] . Second, m any existing GCNs remain tran sductive models dep ending on a fixed graph that restricts their ability to g eneralize to new , un seen no des. Hence, they fail to generalize well on novel, u nseen subjects and are crippled in conducting standalone tests with out rebuilding the en tire graphs . Although newly introduced models, such as GA T , and other differentiable com ponents address this drawb ack, they still dep end on large static graph s and sacrifice accuracy [ 18]. Finally , m ultimodal attention and fusion techniques, wh ich ar e useful too ls for improving accuracy , are o ften less interpretable; thus, it b ecomes dif f icult to disting uish the inf luences of co ntributing and subject-related associatio ns within th e entire diagnostic process. In addition, issues of small sam ple size and varying distributions of features can raise the prob lem of o verfitting. Resolving these issues requ ires th e d evelopment of an adaptive, inter pretable, and inductiv e learning model o n graphs that can hand le multimodal features with varying properties. T o addr ess these challen ges, the MRC-GA T mod el is intr oduced as a multimodal, episo dic meta learn ing model that integrates c o pula-based similarity alignment, relatio nal attention, and no de-wise gated fusion. Firstly , the features are mapped into a copula feature space through rank Gaussianization, an d then robu st internal covarian ces are estimated thr ough Ledoit -W olf shrin kage within each mod ality . The pairwise similarities are then measur ed through Mahalanob is Dis tance, enabling scale-independen t c o mparison against correlated features. T he relation-specific graphs are de fined for each modality , and then they ar e sparsified through directed k-nearest-neig hbors (KNN) and a predefined thresho ld . Mean while, for each ty pe of modality , on e -hop relational attention and nod e-wise gated fusion layers are used, and then two- hop attention and secondary fusion refine the subject embedd ing b y extending the receptive field and improving lear ning stability . Imp ortantly , attention weights an d node-wise fu sion weights are qu antifying th e contributions of nodes and neig hbor s, providin g transparent and clinically coherent interpretation . Finally , an episodic meta- learning p rotocol trains the model to classify unseen query subjects fr om small suppo rt sets, ensuring robu st generaliza tion and improved learning stab ility . Experimen ts condu cted on the T ADPOL E and NAC C d atasets show that MR C-GA T deliver s stro ng and consistent diagnostic p erformance, achieving 96.87% and 92.31% accurac y , and providing stable multimo dal an d class discrimination across heterogen eous subjects. In summary , the following are the key contribution s of this research wor k : • To red uce instability in similarity measurem ent for RF, COG, and MRI, a copula -aligned graphical construction process is proposed . • A two- stage relational attention modeling with node- wise g ated fusion is propo sed, which enables explanation of attention weights on each edge and each modality. • An episodic meta -learning approach is proposed to improve the generalization capab ility of the mod el, and it can make inductive inference on nov el instances and achieve stable performance on various d ata sets. The remainder of this article is structured as f ollows. In Section 2 , related work is reviewed; Section 3 describes the methodology and details of the pr oposed architectu re; Section 4 o utlines the ev aluation setup, datasets, evalu ation metrics, and r eports experimental r esults; and Section 5 conclud es the paper by summarizing the key f indings and suggesting potential directions for future resear ch. 2. Related W ork In this section, the current progress in multimodal fusion, graph learning, and Explainable AI in Alzheimer ’ s disease diagnosis will be examin ed. The section will b egin with the discussions on multimo dal fusion techniqu es, fo llowed by an analysis of g raph-based approaches, and finally describ e emer gin g techn iques improving the interpretability and accuracy of Alzheim er ’ s disease diag nostic modeling. 2.1 Multimodal Fusion Appr oaches The mu ltimodal fusion techniques u sed in d iagnosing Alzheimer ’s disease fo cus on combining diverse clinical, cognitive, n euroimaging, and genetic features into a un ified modelin g scheme . More recently, studies o n multimod al fusion in Alzheimer’s disease can be primarily clustered into two overarching paradigms, namely feature-level fusion and decision -level fusion. At featur e level fusion, cascaded dee p learning models, as exem plified by the m ultimodal mixing transformer (3MT ), p rocessed clin ical and neuroimaging features to gether through the mechan isms o f cross - attention and m odality dropout, obtaining robu st generalization under missing -modality scenarios [21 ]. Similar ly, another deep learning architecture, the deep mu ltimodal discriminative and interpretability network (DMDI N) , achieved feature alignmen ts through the use of multilayer perceptrons and generalized canonical correlation analysis, creating a discriminative shared space with improved separation and identificatio n of distinct p atterns in the various modalities [2 2]. In another line of work, interp retable models of disease prog ression have u tilized MRI, clinical scoring, and genetic polymorphisms thr ough interaction models, boosting robustness again st cen ter v ariability [23] . Meanwhile, other trimod al fusion techn iques feature successful discrim ination between progressive an d stable MCI through the combined u se of SNPs, gray -matter ratios, an d sMRI features, un derscoring th e morpholog ical predominance of gray -matter ratios [24] . At the dec ision level, v arious late -fusion methods combine the predictions of modality-specific learners. For example, a multi- level stacking ensemble fuses six base classifiers per modality and combines the predictions at a l ater stage across mo dalities, leading to increased accuracy and enhanced i nterpretability due to op timized featu re selection [25] . Multimodal mixing method s coup le MRI -tailored vision transformers with 1D -CNNs, utilizing multi -scale atten tion for clinical features, fu rther boosting the p erformance in AD recognition tasks [26] . Th e p resented collection o f multimodal fusion studies underlines the importance of bringing togeth er complemen tary biomarkers in addition to identifying ch allenging aspects of finding appropriate no nlinear cross -modal relationships an d maintaining interpre tability when complex architectur es are being modeled for fusion . 2.2 Graph-Based Methods for AD Diagnosis Graph co nvolutional f o rmulations hav e been used to en code subject - to -subject relationships from imaging -derived biomarkers and phenotyp es. The UNB -GCN metho d builds ed ges from phenotyp ic similarity an d u ses attentio n to refine morphological biomarkers of cor tical atrophy . Experiments on ADNI show impro ved accu racies f or AD vs. CN and AD vs. MCI, while the authors rep ort that UNB better ca ptures AD -in duced cortical ch anges comp ared to traditional volumetr ics [27]. Beyo nd fixed graphs, an auto-metr ic GNN introd uces a metric -based meta -learning strategy th at trains on man y small n ode -classification tasks to enab le indu ctive testing; an AM GNN layer with a probability constraint learns node -similarity metrics while fu sing multimodal data, yielding high accu racy on TADPOLE for both early d iagnosis and MCI to AD conversion [18]. Furthermore, a multigraph - combination screening GCN constructs numer ous graphs sp anning mu ltiscale features and multi -ho p neighbo rhoods and then selects optimal co mbinations via a learn ed predictor, followed b y multigraph attention; this design mitigates inco rrect edges and improves robustness on NACC and TADPOLE [20] . Besides, a feature-aware multimodal meth od integrates SHAP-based boosting feature selection, cross -modal attention to model subtle inter -modality relatio ns, and a GCN branch for heterogen eous data, with an au tomatic model-fu sion strategy learn ing weights between s ub -models; results on two ADNI coho rts indicate strong diagno stic performance [28] . On the other h and, an in teractive deep cascade spectral GCN constructs separate imag ing and n on- imaging relatio nal graphs with learnable edge gen erators, and employs dual cascad e sp ectral bran ches with inter -branch in teraction to capture complementary seman tics ac ross depths, surp assing prior state of the ar t on multiple disease datasets [2 9]. 2.3. Explainable and T rustwor thy AI for AD Diagnosis Explainability for the diag nosis o f AD h as been investigated throug h various parad igms. The deep multi -modal discriminative and interpretab ility networks were used to r ealign the various modalities o n a discriminative subspace, and through knowledg e distil lation , they were able to revive synchronized representations, stressing crucial ROI’s involved in the classification decision o f AD [22] . The case-based method for counterfactual reasoning comb ined U - Net an d GAN mod els to provid e subject -spec ific map s, exp laining how slight morp hological m odifications might affect th e diagn ostic decision, without affecting the excellent accuracy on tasks [30] . Also, attention-enhance d autoencoders co mbined with Grad -CAM aided in locating those par ts of the brain crucial for decision -mak ing within T2 -weighted sMRI inputs, leading to high ac curacy and useful saliency m aps [31] . In addition, multimodal models and the federated learnin g platform integrating Random Forest with SHAP exp lanation unraveled f eature attributions through MRI segmentation , clinical, an d p sychological i nput data while retaining privacy and achievin g stron g precision, recall, an d Area under Curve ( AUC) [32]. T o overcome the limitations iden tified in some curren t g raph- based m odels and mu ltimodal classification ap proaches , the MRC-GAT mo del has bee n developed to provide an improved, more ad aptive, and d ependable method f or Alzheimer’s disease cla ssification. Un like other graph -based models, wh ich relied on fixed g raph to pology [20, 27, 29] , or models based on individual auto -metric relationships for meta-tasks [18] , MRC-GAT has an in ductive architecture especially designed to ad dress the a bove challenges and provide a reliable integration of heterogen eous multimod al data. A concise comparison with other method s is provided in Table 1. T able 1. Summary of relate d works. Refere nce Y ear Method Dataset Advantage Limitation [18] 2021 Auto-Metric GNN with meta-learning T ADPOLE Enables inductive testing and learns adaptive node-similarity metrics Requires multiple small graph tasks; limited interpretability [20] 2024 Multigraph screening + multigraph attention T ADPOLE , NACC Reduces noisy edges and enhances node aggregation among similar patients High computational cost due to graph enumeration ; Limited scalability to large cohorts [21] 2023 Cross-attention + modality dropout ADNI Robust to missing modalities Requires careful tuning of transformer layers; May overfit on small complete subsets [22] 2023 MLP + GCCA + knowledge distillation ADNI Discriminative embeddings; Identifies significant ROIs via distillation Complex optimization process; Sensitive to hyperparameters [23] 2024 Deep model with interaction encoding ADNI Improves long-term prediction accuracy; Integrates interaction effects via multimodal data Requires large multi-center data; Sensitive to scanner/inter-center variability [24] 2025 T rimod al fusion (SNP + RGV + sMRI) ADNI High accuracy distinguishing sMCI vs pMCI; RGV plays key role in morphological discrimination Limited interpretability; Requires complete trimodal data [25] 2023 Stacking ensemble + PSO -based feature selection ADNI Multi-modality stacking; improves accuracy and interpretability Depends on handcrafted sub- score; Complex 3-level stacking increases training time [26] 2025 MRI_V iT + 1D- CNN with attention fusion ADNI Robust multimodal fusion; Leverages V iT for spatial and 1D -CNN for tabular features; Strong accuracy Requires large labeled datasets; High computational demand [27] 2023 UNB -GCN with attention ADNI Highlights key cortical regions; interpretable Single-modality focus; limited generalization [28] 2024 SHAP-based selection + GCN + auto-fusion T ADPOLE Preserves low-dim correlations via SHAP boosting; Captures subtle cross-modal relations Complex integration; risk of overfitting [29] 2024 Dual spectral GCN branches ADNI, ABIDE Builds multi-relational graphs from imaging & non-imaging; Deep cascade interaction enriches high-level features High computational complexity; Requires learnable edge generators per modality [30] 2025 U-Net + GAN counterfactuals ADNI Generates causal counterfactual maps; Outperforms SOT A in ACC and AUC; Outperforms Grad-CAM & other XAI methods High model complexity; computationally heavy [31] 2025 Autoencoder + Grad- CAM ADNI Highlights discriminative brain regions Single-modality (sMRI only); Limited to 2D axial slices [32] 2025 Federated RF + SHAP exp lainability OASIS Preserves data privacy and interpretability Limited to classical models; No joint feature learning across institutions Proposed W ork T ADPOLE , NACC - Aligns data distributions across different modalities. - Provides interpretable attention weights across modalities. - Enables inductive generalization to unseen subjects through episodic meta-learning - Requires tuning of k and copula parameters. - Computationally heavier than single-relational GCNs. 3. Methodology This section describes the MRC- GAT method, Section 3.1 p rovides prob lem statement and exp lains the motiv ation for the proposed mod el. Section 3.2 formalizes multimod al class ification und er an episodic meta- learning setting and introduces the n otation. Section 3.3 describes the m o del architecture. Finally, Sectio n 3.4 outlines the training strategy. 3.1. Problem Statement Alzheimer’s disease rep resents a p rogressive form of neurodegener ation associate d with co gnitive decline and brain shrin kage, and it’s precisely this ear ly stage in Alzheim er’s disease, pr esented as m ild cogn itive impairm ent (MCI), which holds great significan ce for early diagnosis. Despite large amounts of research involving developments in machine learning and imaging techn iques, early diagnosis con stitutes a diff icult task due to var iability in clinical data orig inating from several sources, such as dem o graphics, cog nitive ev aluation, and MRI scan. The graph diagnosis approaches have sev eral challenges in this context. The h eterogeneity of data makes it difficult to build similarity graphs across subjects. The standard GNN models have static graph structures, which limit th eir ability to generalize to unseen subjects. Moreover, many existing f u sion approac hes provide o nly limited tra n sparency, whic h reduces their practicality in clinical set tings. I n view of these issues, it be comes necessary f or an ideal diagnosis mod el to be able to align data f rom diverse modalities systematically, and be able to gener alize to n ew subjects, as well as p rovide for the interpretability of results. To fulf ill th ese requ irements simu ltaneously, it becomes necessary to com bine copula - based tech niques, episodic meta-lear ning approaches, and relational attentio n meth ods v ia nod e -wise gated fusion to form th e MRC- GAT model. 3.2. Problem For mulation Let be the dataset, wh ere is the multimo dal feature v ector of the subject , and is the diagnostic lab el (CN , MCI, AD) . Each subject vector is partitioned into three modalities: (1) where corresponds to demographic risk fac tors, is cog nitive test score s, and denotes MRI f eatures. The objectiv e is to learn a function : (2) such that the predicted label is close to the true label . with this in min d, the dataset has been represented as a multi-relatio nal graph : (3) where contains the nodes representing the subjects, and each relation type embodies all pairwise dependencies defined within one modality. The learning objective is thus set as minimizing th e following classification lo ss over the episodic tasks: (4) where ar e the model par ameters, is a sampled meta -task includin g suppor t and query nodes, and deno tes the corresponding multi-relation al graph. 3.3. Model architecture The entire train ing p rocess of the proposed MRC -GAT is shown in Fig . 1, which describes the meta -lear ning process ov er various episodes. In the training pro cess, for each tr aining iteration, samples of episodes are collected from th e training set, an d each episode is a small graph generated by well -balanced support set samples and an unlabeled query node. The graphs are input into the model simultaneously, an d the forward an d bac kward processes calculate the loss fo r th e ep isode, and the m odel updates the p aram eters o nce for each training iteratio n. Then, the trained p arameters will b e transferred to th e next training iteration , by which the model continu ally trains to acq uire the relatio nal represen tations. After train ing iterations, the trained parameters are directly used f or inference o n other episodes without any par ameter fine -tuning. The p seudo -code o f the prop osed m ain model is shown in Algorithm 1, and Fig. 2 descr ibes the exact process and details of the MRC- GAT model . The remaining content of this section is divided in to the following parts: • Episodic Task Desig n and Batch Constructio n; • Copula-Based Mu lti-Modal Similar ity Computatio n; • Graph Constru ction and Sparsification; • One-hop Relation al Graph Attention; • Node-Wise Gated Fu sion Across Mod alities; • Two-hop Relation al Graph Attention an d Fusion ; Fig . 1. Overview of ep isodic meta-training/ inference for MRC-GA T . Multiple episodes, consisting of support and query samples, are processed in eac h iteration, with the a verage loss being compute d and the model param eters subsequently updated. F inally , the trained model performs inductive inference to classify new query subjects into CN, MCI, or AD groups. 3.3.1. Episodic Task Design and Batch Construction The Alzheimer’s disease diagnosis is formulated as the f ollowing supervised n ode classification p roblem within an episodic meta-learning method . Eac h episode is defin ed as a small, encapsulated classification task consisting of a support set an d a query node , and is mathematically expressed as : (5) where is th e total n umber of d iagnostic classes , is the number of supp ort samples to be chosen from each class . is the multimodal feature vect o r of s ubject . is the ground-truth diagnostic label an d is the query node, which is to be classified and is lab eled as unidentified . Hence, the total n umber o f no des in this episod e will be . The ratio nale b ehind this setting is to provide input to the model in an equal manner for all classes, along with one unidentified query node per episode, which is required to be inductively classified by the model. Additionally , within each episode, the union of the support and query nodes , denoted as , co nstitutes t he set of ver tices for three relation -specific grap hs f or each mod ality, namely Every relatio n-spec ific g raph reflects the inherent patterns o f similar ities for its respective modality, yet th ese distrib utions of raw features have extr eme variations from each other in differen t modalities. T o facilitate similarities to be computed, th ere is a n eed fo r these multimodal f eatures to be pro jected into an align ed common space via the tr ansformation based on copulas, in which similarities in terms of d istances/edge weigh ts in different modalities bec ome comparab le. Fig . 2. Model architecture and workflow of the MRC-GA T method. 3.3.2. Copula-Based Multi-Modal Similarity Computation Following th e episodic task design outlined above, this section is devoted to calculating pairwise similar ities between risk factors, cognitive data, and MRI modalities. To achiev e statistical comparability acro ss heter ogeneous feature spaces, raw feature vectors are mapped into a Gaussian co pula d omain, which e n ables mo re accurate modeling of non linear depend encies and covariance structu res. The overall p rocedure is or ganized in th ree steps: rank Gaussianization of feature distributions, covar iance sh rinkage to stabilize d ependen cy estimate s, and Mahalan obis distance computation to measure the statistical dissimilarity between subjects. These relationships are computed in three steps, as discussed below : • Rank G aussianization: To normalize heterog eneous features ac ross modalities, each featur e dimensio n is first transformed into the Gaussian copula domain as: (6) where is the rank of a value amon g samples, and is the inverse standard no rmal cumulative distribution function (CDF). This transfo rmation enforces marginal Gaussianity so that making features from different modalities are statistically comp arable while p reserving their rank -based dependencies can still be preserved . • Covariance Shrink age: The Covar iance patterns in relation ar e r egularized b y Covar iance shrin kage named Ledoit-Wolf shrinkage, d efined as: (7) where is the Gau ssianized feature matrix for the relation , is the nu mber o f featu res in relation , is th e identity matrix of size , wh ile is th e matrix trace operator, and is the shrinkag e parameter. The use of the shrink age parameter here reduces the instability o f the estimated value, which may b e problematic in high - dimensional d ata and small samples. • Mahalanobis Di stance Bet ween Subjects : The Mahalanobis d istances are calculated between all pairs of subjects for relatio n as follows: (8) where and are the Gau ssian feature vectors of subjects and under relation , is the inverse of the regularized covariance matrix, and is the Mahalanobis distance between subjects and in relation , defined as the qu antification of the statisti cal dissimilarity between th e two subjects co nsidering the correlation structure between features. The inclusion of cov ariance information in this m easure implies that this measure calculates distances within the whitened feature spac e, assigning more significance to corr elated featur es. The set of all pairwise Mahalanobis distances co nstitutes the stat istical basi s for gener ating r elation-spec ific grap hs, within which each n ode pair is connected based on their similarity measuremen ts. 3.3.3. Graph Construction and Sparsification Using the p re-computed pairwise Mah alanobis distances, an initial fu lly con nected gr aph is crea ted for each relation, with edge weights defined as inverse fun ctions of the respective distances. The adjacency a n d weight matrices are defined as: otherwise (9) here, is a bin ary ad jacency matrix indicating whether there is an edge b etween n odes an d , and the similar ity weight is inversely proportional to the Mahalanobis distance . T hus , a s ubject with a higher similarity value, i.e., smaller distance , will b e mor e strongly weigh ted in this process . At this poin t, the graph is fully connected and dense. Upon this graph initialization, a KNN-based sparsification step is applied to retain only the most relevant local relationships and suppress weak or non- informative connections. This prunin g strateg y f acilitates co mmunication between any node, pr imarily with its mo st relevan t n eighbors, while maintaining information about the structure. These k-n earest neighbors for ever y node , given relatio n is deter mined by: (10) In this case , represen ts the index set of the nodes m ost similar to node . The sparse matr ices are then expressed as fo llows: oth erwise (1 1) where is def ined as whether nod e is within the top- neighb ors of node un der r elation , and assigns weights based on the inverse of the Mahalanobis distance. Th e value of the h yperparameter , th erefore , directly influences the b alance between sparsity and c o verage of information within gr aphs. To fur ther re f ine t h e structure, the distance gating mechanism is used in filtering out the low or noisy edges with similarity less than the predefined value . The process is defined as: (1 2) In this context , is th e maximum allowed value for the retention of an edge , and is element -wise multiplication , with th e binary m ask eliminating edges abov e this value. The a b ove process serves as the quality control process, whereby on ly stron g and trusted edg es are retain ed. Moreover, the obtained graph is considered directed, implying that the node may be among the top neighbo rs of the node witho ut being mutually connected . This is more flexib le than d epicting dependencies am ong subjects, as it models the complex directed relationships typically recurring within clin ical o r bio logical networks. Consequently, this directed and sparse -graph structure constitutes a basis for the following relation -specific atten tion mechanism, used for adaptive informatio n aggregation through modality -dependent edges. 3.3.4. One-hop Relational Graph Attention In this section, the relatio nal g raph attention mec hanism is in troduced on top of the sparsified gr aph structure developed earlier. During th is stage, the m odel lev erages the directed n eighborhood structure to learn modality - specific nod e representatio ns t hrou gh the use o f attention -driven message passing. Unlike con ventional und irected settings, here the direction ality of edges makes it possible for the mo del to selectively ag gregate from incom ing neighbors, captu ring asym metric dep endencies. This step for ms the found ation fo r learning loca l relatio nal patterns before in tegrating information acro ss modalities. The in put feature vector at the current layer is represen ted by for node in relation d enote its in put feature vector at the current layer. At layer one , this will refer to the input multimodal features ( ), whereas at other layers , it will be represented by the fused feature o btained through the previous step ( ). To capture the directed relationships between the nodes, an attention coefficient is calculated fo r the directed edge as follows: (1 3) where is a relation-specific pro jection matrix mappin g node features into a latent subspace of dimension , is a trainable attention vector th at ca ptures pairwise fea ture interactions, denotes v ector concatenatio n . After computing the attention weights, each node u pdates its represen tation in r elation as f ollows: (1 4) where is the updated node embed ding for the relation , deno tes the set of n eighbors conn ected to in the -specific graph, r epresents the normalized atten tion coefficients, and is the Exponential L inear Unit (ELU) activation , which stabilizes gradien ts and intro duces nonlinearity . By doing so, messages fro m feature -similar neighbors ar e selectively aggregated to y ield richer relation- specific emb eddings. This node update procedure e nriches each subject's repr esentation by selectively aggregating information from its m ost similar feature neighb ors within each mod ality. Based on the enrich ed embeddings lear ned abo ve, the sub sequent step dev elops a no de -wise gated fusion approach to ad aptively integrate infor mation ac ross risk factor, cognitive, and MRI modalities to represent each node . 3.3.5. Node-Wise Gated Fusion Across Modalities After obtaining relation- wise embeddings , the model combines them by u sing learning-en abled gating components, wh ich control the contribution of var ious modalities to ward the fused no de represen tation. The combination is ex pressed as: (15 - a) (15 - b) (15 - c) where is a lear nable gating vector for relation , is th e unnormalized gate score , which calculates the weightage of m odality for node , is the n ormalized gating co efficient o btained by the softmax op eration on all the modalities; and is the fused em bedding in the first lay er, which ag gregates all the rel ational representations into one embedding. This ad aptive gating pro cedure enables the networ k to emphasize informative modalities an d attenuate less relevant ones on a node -specific basis. Building on top of these fused embeddings, the subsequent two - hop r elational atten tion layer ex tends con textua l reaso ning and captures h igher- order depen dencies acro ss directed, modality- specific relational graphs. 3.3.6. Two-hop Relational Graph Attention & Fusion The embeddings from the first layer are then broadcast to all th ree modality-specif ic graphs and input into the second r elational GAT lay er. Th is layer allows two-hop reasoning and computes n ode representations by gathering information from the node’s neighbors and the neighbors’ neighbo rs in the directed relation, expressed as follo ws for the node and relation : (1 6) where the second-layer projection matrix is denoted by , and attention coefficients are represented as , while the input embedding obtained from th e first f usion le vel is . A new gating mechanism is then applied to fuse the relation-specif ic embeddings at this deeper level; this mechanism preserves the same mathematica l structure as E qs. 16 (a) – (c) , but it n ow op erates on the updated representation s , wh ich captur es mu ch more contextual information extracted by multi-h op propag ation. In this case, the learnable g ate for the relation is den oted , while the co rrespond ing coefficient is the normalized gating weight for m odality , an d the outco me is the final fused embed ding, which captures mu ltimodal relationships across modalities . The seco nd r elational- GAT layer increases th e recep tive field fro m one -hop to two-hop neighborho ods, allowing for information propagation along bo th intra -m odal an d cross-modal connections. Th is hier archical attention structu re develops a broader contex tual integration and mitigates the over-smoothing impact o f deeper GNNs [33, 3 4]. Modality contributions adaptively fuse in a n ode -wise gated manner , maintain ing subject-level diffe rences and av oiding feature homogenizatio n across layer s. As a result, final em beddings ca pture b oth fin e-grained local affinities and glo bal relational contex t span ning clinical, cogn itive, and neuroimaging domain s. These enriched representation s th en ser ve as input to the downstream classifier, where diagnostic prediction s f or quer y nod es are generated in episodic training. 3.4. Episodic Meta-Learning Strategy In this section, the training process is arrang ed in an episodic m eta-learnin g loop as illus trated in Fig. 1. At iter ation , a batch of episodes is sam pled; each episode contains a balanced support set and one un labeled query node. These sam ples ar e p assed th rough the MRC-GAT stack using the curren t parameters . Fo r each ep isode , the model calculates the p rediction for the query nod e and determin es the The iteration- level ob jective is then def ined as the average loss o ver all B ep isodes: (1 7) where denotes the numb er of e p isodes p er iteration , is the focal loss f or the episode , and deno tes the batch- averaged episodic loss used for the u pdate. Then, a single meta-update is ap plied to model parameters as f ollows: (1 8) where is the model parameter before th e upd ate, is the learning rate, an d is the grad ient o f th e av eraged episodic loss. This update scheme, in which one update is perf ormed per iter ation , en sures that each g radient step reflects the diversity of m ultiple ind ependent tasks, rath er than a single episode, promo ting stable an d gen eralizable learning. The final par ameters after iterations are used directly for inference on u n seen episodes without further fine-tuning , as shown in the right p anel of Fig. 1. Given a new support -query configur ation, it performs relation al reasoning and g ated fu sion exactly as durin g train ing, while pr eserving the ep isodic structure . This allo ws the model to perf orm inference on subjects nev er seen before . Message p assing is perfor med via relational GAT layers, where information fr o m various m odalities is adap tively in tegrated using node -wise gating, which provides the fused representation for n ode . Then, th e quer y node embedding is passed th rough a two -layer multilayer percep tron classifier (MLP) to estimate the diag nostic probability distribution: ( 19 ) where an d ar e lear nable weight matr ices, and ar e b ias term s, an d denotes the rectified linear activation function, an d the output repr esents a probability vector over the diagnostic categories. Finally, the training ob jective can be written as: (20) where denotes all trainable parameters, is a sampled ep isodic task drawn from the d istribution , denotes the MRC-G AT mod el param eterized b y , and represen ts the f ocal loss that balances ea sy an d har d examples in addition to tackling class imbalan ce. This meta-lear ning form ulation allows the mo del to learn representations inductively across heterogeneous graphs, which are gener alizable to unseen query sub jects. Algorithm 1. Training of MRC-G AT with Episodic Meta-Lea rning Input: training set with label {CN, MCI, AD} Output: Trained parameters 1. for each meta-epoch do 2. Sample support nodes and one query node per class; 3. Construct relations {RF, COG, MRI}; 4. for each relation g do 5. # Gaussian copula normalization 6. # Ledoit – Wolf covariance estimation 7. # Pairwise Mahalanobis distances 9. # Similarity weights 10. # Prune edges to k nearest neighbors 1 1 . # Threshold-based edge pruning 12. end for 13. Build multi-relational graph ; 14. Apply relational GAT layers → obtain , then through gated fusion; 15. Compute class probabilities for query nodes 16. Evaluate focal loss = ; 17. Update parameters ; 18. end for 19. return 4. Evaluation This section evalu ates the propo sed MRC -GA T method for multimo dal Alzh eimer ’ s disease classification with T ADPOL E and NACC datasets. The model's performan ce is com pared with state- of -th e-art baselines on thr ee and binary class ification tasks. The sub sequent sectio ns discus s tr aining co nfiguration, datasets, evaluatio n metrics, results and comparison s, and finally provide an interpretability analysis. 4.1. Training Configuration The meta-training takes place in the context of the episodic meta-lear ning paradigm, aimed at achieving inductive generalization to unseen subjects under a few-shot learning setting. Each episode consists of 10 support examples per class, and one query sample, while there are 32 episodes sa m pled in every iteration. Additionally , in each episode, the feature v ectors are rank- Gaussianized, alon g with covariance shrinkag e, along with the formation of directed KNN graphs, where the parameter values are set to , and a threshold is applied to prune weak edges. The code for th e experiment has b een written in Pyth on version 3.10, PyT orch version 2.2.0 , and CUDA version 12.1 , running inside the Goo gle Colab platform, set up with an Nvidia T esla T4 GPU, having a capacity of 16 GB GPU RAM . The Relational GA T module has two atten tion layers having attentio n h eads of size four and two, respectively , where n ode-wise gated fusion is ap plied af terwards. The par ameter setting s for the op timisation pr ocess include the use o f the Adam optimiser , whe re the learning rate starts at 0 .01, and a total of 1200 iterations is perfo rmed . The dropout strategy has a rate of 0.2, ap plied to the attention mechanisms. The p roposed approach also follows a five - fold cross-valid ation process. T able 2 provides a summary of th e training param eters. T ab le 2. Summary of T raining Configuration Parameter Setting method Episodic meta-learning Hardware NVIDIA T esla T4 (16 GB VRAM), 2 vCPUs, CUDA 12.1 Software Python 3.10, PyT orch 2.2.0 Graph pruning KNN (k = 6), τ = 1 Relational GA T 2 layers (4 heads for the first layer and 2 heads for the second layer) Optimizer Adam, learning rate = 0.01 T rainin g Iterations 1200 Batch Size 32 Regularization Dropout = 0.2 V alidation Protocol five-fold cross-validation 4.2. Datasets T wo comp lementary multimodal d atasets were used to evaluate the proposed mo del across distinct clinical and acquisition cond itions. T ogether , they pro vide heterogeneous combin ations of imaging , cogn itive, and d emographic features, enab ling a comp rehensive assessment of m odel performan ce an d generalisatio n. The following sub sections briefly descr ibe the T ADPOLE an d NACC datasets. Tadpole Dataset: F or both training and evalu ation of th e mo del, the T ADPOLE dataset [35] was used. This dataset was derived from the Alzheim er’s Disease Neu roimaging Initiative (ADNI) , which presen ts comprehensive multimodal clinical data , including dem ographic a n d genetic risk factors, cognitive ass essment scores, and neuroimaging biomar kers. These complementar y modalities tog ether describe the multifaceted aspects of Alzheim er's disease and pro vide a strong basis for co mparing mod els th at incorporate heter ogeneous feature do mains under a single learnin g m ethod. A single cross- sectional snapsh ot from each participant was used, emphasizing the joint representation of multimodal fea tures rather than their temporal evolu tion. This setting refl ects a clin ically realistic diagnostic scenar io, in which medical d ecisions are typically mad e based on baseline ex aminations. Furthermore , the dataset encom passes a broad spectru m o f disease stages, ranging from cognitively normal to mild cognitive impairment a n d Alzheimer’s disease, enab ling a comprehensive evaluation of the model’s generalization a b ility across heterogen eous patient p rofiles. The propo sed MRC-G AT arch itecture is specifically designed to manage m ultimodal variability and relational complexity, which mak es the TADPOLE dataset an appropriate and challenging benchmark to validate the effectiveness of the p roposed approach. NACC D at aset : T he National Alzheimer’s Coordinating Center (NACC) dataset [36] is a comprehensive, multimodal repository on Alzheimer’s disease, co mbining diverse data types, such as clin ical assessmen ts, cogn itive scores, neu roimaging, gen etic m arkers, and biomarkers. Collected longitud inally from several Alzheimer ’s Disease Research Centers (ADR Cs) a cross the United States, it covers a wide ran ge of participants spanning co gnitively normal to mild cognitive impairment and Alzh eimer’s disease stages. While this d ataset does not represent th e g eneral population because of its specific focus on research cohorts, the standardized protocols assu r e that features are o f h igh quality and well har monized, which will perm it robust modeling of disease progression and d iagnostic patterns. T his makes NACC especially suita ble for assessing ad vanced machine learning methods , such as th e p roposed MRC-GAT, because it allows testing generalization acr oss heterogeneou s multimodal inputs under rea l -world clin ical variability. 4.3. Evaluation Metrics Performance of the proposed m odel is evaluated using a set o f widely adop ted classif ication metr ics. This evaluation proto col allows clear an d consistent comparison across episodes, with reflection o f clin ical sign ificance regarding discr imination among the diag nostic categories CN, MCI, an d AD. The metrics definitions ar e as follows: • Model Performance Evaluation Metric The performance of the proposed model in this study was evaluated using the accuracy metric. Accuracy measures the proportion o f correctly predicted samples r elative to the total nu mber of samples and is defined as follows: (21) where TP , TN, FP , and FN denote true po sitive, true negative, false p ositive, and false negative counts, respectiv ely • Area Under the Receiver Operating Characteristic Curv e (AUC) T o test the discriminative p ower of the classifier , the Ar ea Und er the ROC Curve is cal culated as: (22) where is the Receiver Op erating Character istic curve obtained by varying the d ecision threshold f . The Micro- AUC is o btained by aggreg ating the true positive an d false positive counts acro ss all t he d iagnostic classes and subsequently calculating the area u nder the combined ROC curv e, that is: (23) where , , , and denote the true po sitive, false positive, f alse negative, and true negative counts for class , resp ectively , and represents the total n umber of diagnostic classes. • DeepROC-Based Analy sis In ad dition to the tradition al metrics, a DeepRO C [3 7] analysis wa s perf ormed, qu antifying mo del sensitivity across specific False Positive Rate (FPR) intervals. Building on th e wo rk of Carrin gton et al. [3 8], th e FPR domain was discretized in to three sub -ranges, Gr oup 1 , Group 2 , and Group 3 to test the diagnostic stability at different clinical risk levels. For each interv al, the averag e sensitivity an d average specificity were computed as: (24) (25) where deno tes th e ROC fu nction mapping the false -positive rate in to the true -positive rate , and , represent the width of the integration intervals. Using these, the n ormalized interval-based is then formulated as: (26) which integrates both average sensitivity and specificity to p rovide a localized assessment of model reliability under specific risk r egions. I n su mmary , these metrics jointly provide a comprehensive assessment of the model’ s diagnostic performance. The next subsection discusses the experimen tal results based on these ev aluation measures. 4.4. Experimental Result Th is section p resents an ex tensive evaluation of the proposed MRC -GA T mod el on multiple experimental settings. A detailed performance investi g ation is co nducted on the T ADPOLE and NACC d atasets for the th ree- class and binar y classification tasks, includ ing comp arisons with state - of -the-art grap h-based baselines. Also, interpretability analy ses are giv en to illustrate ho w the model utilizes the multimodal inform ati on and relatio nal structu res during the co urse of making d iagnostic process. 4.4.1. Tadpole Results T o v alidate the proposed MRC-GA T m odel, experiments were first performed on th e widel y used T adp ole dataset, which offers m ultimodal information across MRI, cognitive, and d emographic featur es, en abling a comprehensive evaluation of mo del g eneralization and cross -modal fusion. Th e overall effectiveness and training dynam ics of the MRC-GA T model were in vestigated throug h various m etrics, inclu ding train ing loss tren ds, ROC cur ves fro m cross - validation, and confusion matrices. Th ese elem ents ser ved to appraise the model 's steadiness, ability to differentiate classes, and uniformity over dif fer ent folds . As illustrated in Fig. 3(a), the training loss ex hibits a rapid decline during the initial iteration s, followed b y gradual stabilization . This pattern dem onstrates a smooth co nvergence process with low fluctuation, indicating that the pro posed optimization strategy effectively maint ains training stability . The relatively n arrow stan dard deviation across folds further supports the reproducib ility an d robustness of the ep isodic meta-learnin g process introduce d earlier . Fig. 3(b ) presents the cro ss-fold micr o-averaged ROC curves across validation fold s. The mod el achieves consistently high performance, with AUC values ranging from 0.990 to 1.000 and a m ean AUC of 0.9 97 ± 0.004. The tigh t alignment of th ese curves and m inimal spread acr oss partitions underscor es the model's solid ad aptability to varied data groupin gs. Besides, the con fusion matrix shown in Fig. 3 (c) provides a detailed view o f the classification outcomes across diagno stic ca tegories. The m odel accurately identifie s CN an d AD subjects with recognition rates above 99%, wh ile M CI cases achieve an accuracy of 90.5%. Misclassifications are prim arily observed between adjacent cognitive stages , CN -MCI or MCI- AD, which is consistent with the clinical co ntinuity of Alzheimer ’ s disease progression . (a) (b) (c) Fig. 3 . Results on the TADPOLE dataset: (a) Training loss curve; (b) Cross-fold micro-averaged ROC curv es; (c) Confusion matrix for CN, MCI, and AD classes. • Three-class Class ification A comparative ev aluation was cond ucted between th e p roposed MRC-GAT m odel and sever al r epresentative graph-based baselines that have previou sly b een applied to th e Tadpole dataset. The selected baselines r eflect the chronological developm ent of multimodal graph strategies concern ing Alzheimer 's disease grap h lear ning, inclu ding attention-b ased fusion an d m ultigraph screening approaches. Specifically, AMGNN [18], E VGCN [39], MMAF [19] , UPGT [40], and MGCS-GC N [20] were used as state- of -the- art r eferences, all o f which reported co mpetitive performance on the same dataset, forming a robust benchmark for comparison. As can be seen from Table 3, the proposed MRC-GAT model outp erforms all others in the three - class classification task, with an accuracy of 96.87±1.05% and an AUC of 99.59±1.16 %, which outperforms the state- of -the-ar t graph-based and multimod al methods with a clear m argin. The best performance amon g b aselines is MGCS -GCN, whose accuracy and AUC are 94.10±2.32% and 97.90±1.12 %, respectively . These results all p oint to the strong classification performance o f the MRC-GAT model . T ab le 3. Three-clas s classification experimental results on the T ad pole Dataset Author Method Published Dataset CN vs MCI vs AD ACC (%) AUC (%) Song X et al. [18] AMGNN 2021 T adpole ___ Huang Y et al. [39] EVGCN 2022 T adpole Y ang F et al. [19] MMAF 2023 T adpole Pellegrini C et al. [40] UPGT 2023 T adpole Huabin W et al. [20] MGCS-GCN 2024 T adpole Proposed method T ad pole • Binary Classifica tion To fur ther confirm the diagn ostic effectiveness d emonstrated in the multiclass exp eriments, th ree additio nal binary classification tasks were co nducted on the T adpole dataset, namely CN vs AD, MCI v s AD, an d CN v s MCI. These pairwise setting s reflect differen t stages of co gnitive declin e and pro vide a finer ev aluation of the m odel’s sensitivity and reliability under clinically relevan t cond itions. As s ummarized in Tabl es 4-6 and visualized in Fig. 4, the propo sed MRC-GAT outperfo rms four r epresentative b ase lines, Spectral-GCN [41 ], Inception-GCN [4 2], MMAF [19], and MGCS-GCN[20] across all evaluation metrics, including AUC, AUCₙᵢ, and the DeepROC -der ived average sen sitivity an d specificity . Th ese r esults exten d the stability tren ds observed in the prev ious section. Amo ng the three experimen ts, MCI vs AD remains th e most challenging because of the significant clinical and imaging overlap between mild impairment and early dementia. As reported in Table 4 , MRC-G AT attains the best overall performance with an AUCₙᵢ of 98.8 %, exceeding MGCS-G CN (98.4 %), MMAF (96.1 %), and Inception -GCN (93.8 %). As illustrated in Fig. 5(a ), the DeepROC analysis shows an average sensitivity of 96.5% and specificity of 98.6% within Group 1, and the low -FPR interval is crucial for clin ical safety. The correspon ding ROC cu rve r ises sharply near th e origin, reflecting reliab le detection even un der minimal false -positive co nditions. T ab le 4. D eep Roc analysis in the MCI versus AD experiment on the Tadpole dataset FPR Pres. Risk [0,1] All [0,0.33] Group1 [0.33, 0.67] Group2 [0.67, 1] Group2 92.4% Spectral-GCN AUC 92.4% 92.7% 89.3% 94.8% 92.4% 81.9% 96.2% 99.0% 92.4% 96.6% 57.1% 15.4% 93.8% Inception-GCN AUC 93.8% 92.0% 94.3% 100% 93.8% 82.2% 99.1% 100% 93.8% 95.4% 60.3% 0% 96.1% MMAF AUC 96.1% 94.1% 100% 100% 96.1% 88.2% 100% 100% 96.1% 96.1% 0% 0% 98.4% MGCS-GCN AUC 98.4% 97.6% 100% 100% 98.4% 95.1% 100% 100% 98.4% 98.4% 0% 0% 98.8% Proposed method AUC 98.8% 98.4% 100% 100% 98.8% 96.5% 100% 100% 98.8% 98.6% 0% 0% As shown in Table 5 , for the CN v s AD experiment, where the p henotypic gap between normal and diseased groups is broader, MRC-GAT achieves an AUCₙᵢ o f 99.8 %, ou tperforming MGCS-GCN (99 .6 %), MMAF (9 9.2 %), and Inception-GCN (98 .4 %). The ROC curve in Fig . 5(b) d emonstrates a n early v ertical ascent at the beginning of the axis, signify ing extremely high sen sitivity, 99.5% coupled with equally high specificity , 99.7 % in the early detection zon e. T a ble 5. D eep Roc analysis in the CN versus AD experiment on the T adpole dataset FPR Pres. Risk [0,1] All [0,0.33] Group1 [0.33, 0.67] Group2 [0.67, 1] Group2 97.1% Spectral-GCN AUC 97.1% 98.2% 91.0% 100% 97.1% 93.3% 97.9% 100% 97.1% 100% 56.2% 0% 98.4% Inception-GCN AUC 98.4% 97.5% 100% 100% 98.4% 95.1% 100% 100% 98.4% 98.4% 0% 0% 99.2% MMAF AUC 99.2% 98.8% 100% 100% 99.2% 97.5% 100% 100% 99.2% 99.2% 0% 0% 99.6% MGCS-GCN AUC 99.6% 99.6% 100% 100% 99.6% 99.1% 100% 100% 99.6% 99.7% 0% 0% 99.8% Proposed method AUC 99.8% 99.7% 100% 100% 99.8% 99.5% 100% 100% 99.8% 99.7% 0% 0% In th e CN vs M CI co mparison, as sho wn in Tab le 6 , wh ich ev aluates th e earliest transition stage of cognitive decline, the p roposed model again achieves the highest performance, reaching AUCₙᵢ = 99.9%, surpassing MGCS - GCN (99.7 %), MMAF ( 97.2%), an d Inception - GCN (96.3%). As illustrated in Fig . 5 ) c ( , the ROC tr ajectory o f the proposed model demonstrates a steep initia l ascent and near -saturation behavior, indicating outstanding detection capability in the clinically critical lo w-FPR r egion (Group 1). Within this reg ion, the mo del attains an averag e sensitivity of 99 .1% and specificity of 99.7 %. T ab le 6. DeepRoc analysis in the CN versus MCI experiment on the T adpole dataset FPR Pres. Risk [0,1] All [0,0.33] Group1 [0.33, 0.67] Group2 [0.67, 1] Group 3 92.8% Spectral-GCN AUC 92.8% 94.8% 82.5% 100% 92.8% 83.7% 94.6% 100% 92.8% 99.2% 54.2% 0% 96.3% Inception-GCN AUC 96.3% 94.4% 100% 100% 96.3% 88.8% 100% 100% 96.3% 96.3% 0% 0% 97.2% MMAF AUC 97.2% 97.8% 93.7% 98.3% 97.2% 93.8% 97.7% 99.9% 97.2% 99.2% 50.4% 28.3% 99.7% MGCS-GCN AUC 99.7% 99.5% 100% 100% 99.7% 98.9% 100% 100% 99.7% 99.6% 0% 0% 99.9% Proposed method AUC 99.9% 99.6% 100% 100% 99.9% 99.1% 100% 100% 99.9% 99.7% 0% 0% Fig. 4. Binary classification experimental results of different models on the Tadpole dataset. (a) (b) (c) Fig. 5. DeepROC comparison visualization on the Tadpole dataset. (a) MCI&AD; ( b) CN&AD; (c) CN&MCI These binary classification r esults, alon g with the previous m ulticlass evaluation, altogether demon strated that MRC-GA T ach ieved no t on ly the highest over all diagnostic accur acy but also maintained ex cellent sensitivity and specificity under clinically relevant condition s. This consistent perf ormance confirms the strong diagnostic capability and stability of th e proposed model on th e T ADPOLE d ataset, highlightin g its effectiveness in integ rating and interpreting complex multimodal relationships within a representative Alzheimer's cohort and naturally supporting its extension to the NACC dataset. 4.4.2. NACC Results To further ass ess the model’s r obustness under real -world variability, the proposed MRC -GAT was next evaluated on the ind ependent NACC dat aset, which co ntains heterog eneous clinical and imaging d ata collected across multip le centers. As shown in Fig. 6(a), the training loss continuously reduces over the train ing iterations. Though there is more fluctuation at the beginning because o f the higher v ariability of the NACC dataset bu t the curv e stabilizes over time. Fig. 6( b) presents the micro-averag ed ROC curv es across the five validation folds of th e NACC dataset. Th e curves show a consistently strong separation between classes, with AUC scores ranging from 0 .955 to 0.997 and a mean value of 0 .980 ± 0.015. The li mited s pre ad observed ac ross folds su ggests that the mo del performs reliably d espite the greater variability inher ent in NACC’s multimodal d ata. I n addition, Fig. 6(c) displays the row -normalized confusion matrix, summarizing the distribution of pr edictions across diagnostic groups. The model achieves a n otably high detection rate for AD (97.9%), wh ile MCI and CN cases rea ch 87.7% and 85.6%, respectively. The m ajority of errors arise between neighboring cognitive stages, particularly CN - MCI, ref lecting the subtle and gradual transitions characteristic o f early Alzheimer’s p rogression. (a) (b) (c) Fig. 6. Results o n the NACC d ataset: (a) Training loss curve ; (b) Cr o ss-fold micro-averaged ROC cu rves; (c) Confusion matrix for CN, MCI, and AD classes. Overall, these details illustrate that MRC-GAT uph olds steady predictive trustworth iness an d separation ability across datasets with d iffering collection methods. • Thr ee-class classifica tion T o mo re tho roughly assess th e generali sation capab ility of the MRC- GA T model under h eterogeneous clin ical conditions, a three -class evaluation was also conducted on the NACC dataset. Compar ed with T ADPOLE, NACC exhibits higher v ariability and a less balanced class distribution, providing a more ch allenging benchmark for examining the model’ s robu stness an d adaptability to real -world d iagnostic settings. As summar ized in T able 7, th e proposed MRC-GA T achieves the h ighest diagnostic performance among all evaluated meth ods, attaining 92.31 ± 1.02 % ac curacy and 98.0 ± 1.5 % AUC. These r esults surpass sev eral well - known b aselines, including Pop-GCN [41], Inceptio n-GCN [42], EV - GCN [39], and MGCS-GCN [20] , by a clear margin. Among the competing approaches, MGCS-GCN demonstrates the best baseline r esults with 90.21 ± 2.8 9 % accuracy and 92.13 ± 1.02 % AUC . however , MRC-GA T f urther improv es b oth metrics, confirming its superior capability to model complex cross -mod al dependencies and maintain d iagnostic stability acro ss heterogen eous clinical cohorts. In c ompar ison with the findings from the prev ious section, this outco me highlights the m odel’ s consistent behavior and effective generali sation under varying dataset ch aracteristics. T ab le 7 . Three-class classification experimental results on the NACC Dataset Author Method Published Dataset CN vs MCI vs AD ACC (%) AUC (%) Parisot S et al. [41] popGCN 20 17 NACC Kazi A et al. [42] Inception-GCN 20 19 NACC Huang Y et al. [39] EV -GCN 202 2 NACC wang W et al. [20] MGCS-GCN 2024 NACC Proposed method NACC • Binary Classifica tion Corresponding to th e pattern s pr esented in the T ADPOLE dataset, th e binary studies undertak en on the NACC cohort also depict the super iority of MRC-GA T in mo re hetero geneous clin ical conditio ns. The mo del con tinues to provide leading accuracy , sensitivity , and specificity throu ghout th e different tasks compared to all other tested models, as summarized in T ables 8 - 10 an d illustrated in Figs 7 ,8. The prop osed MRC-GA T consistently outperforms the baseline mo dels, Spectral- GCN [41 ], In ception-GCN [ 42], MMAF [19], and MGCS- GCN [20 ] across all binary classification tasks. As shown in T able 8, in the MCI vs AD exp eriment, wher e disease stages exhibit significant overlap, MRC- GA T achieves the highest per formance with an AUCₙ ᵢ of 97.1%, exce eding MGCS-GCN ( 95.8%) an d MMAF (91. 8%) by a considerable margin. W ithin the clinically crucial low -FPR region (Group 1), the model achie ves an average sensitivity of 94.3% and specificity of 96.9 %, ref lecting strong discriminability under c h allenging diagnostic bo undaries. The ROC curve in Fig . 8 (a) confirms a steep in itial r ise and near -saturation tren d, indicating accurate classification with min imal false -positive r ates. These findings alig n with the cr oss- dataset consistency observed earlier and verify the model’ s capac ity to differentiate subtle cogn itive transitions effectively . As repor ted in T able 9, the CN v s AD ex periment, which inv olves a more distinct phenotypic separation, the proposed model ach ieves an A UCₙ ᵢ of 99.2%, surpassing MGCS -GCN (98.9%), MMAF (97.2%), and I nception -GCN (93.9%). Th e DeepROC analy sis f urther demon strates an average sensitivity of 97.1% an d specificity of 9 9.1% in Group 1, emph asizing that the model retains hig h diagnostic p recision eve n in early detection regions. As illustrated in Fig. 8( b), the ROC tr ajectory o f MRC-GA T rises sharp ly near the origin, indicating reliable detection of AD subjects while maintaining an exceptionally low false-positive rate. For the CN vs MCI task, which represents th e earliest and most subtle s tage of c o gnitive decline, MRC -GA T once again achieves the b est overall result s with an AUCₙᵢ of 9 7 .5%, outperforming MGCS -GCN (96.7%), MMAF (9 4.8%), and In ception -GCN (91.6%). The DeepROC evaluatio n in T able 10 shows th at within Group 1, the model ac hieves an average sensitivity of 91.1 % and specificity of 9 8.2%, surpassing all baselin e methods. The ROC visualization in Fig. 8 (c) demonstrates a steep ascent with n ear-saturation behavio r , indicating precise recognition in early diagnostic zones and highlighting the model’ s strength in iden tifying mild cogn itive impairment. Finally , these binar y classificatio n outco mes complemen t the three - class experimen ts presented ea rlier , co nfirming that MRC-GA T not o nly achieves state - of -the- art accuracy but also maintains balanced sensitivity and sp ecificity across diverse diagnostic settings. This consistency across datasets underscores the model’ s potential as a relia b le and clinically applicab le tool for multimod al Alzheimer ’ s d isease diagnosis . Fi g . 7 . Binary classification experimental results of dif ferent models on the NACC dataset. T ab le 8. D eep Ro c analysis in the MCI versus AD experiment on the NACC dataset FPR Pres. Risk [0,1] All [0,0.33] Group1 [0.33, 0.67] Group2 [0.67, 1] Group 3 83.7% Spectral-GCN AUC 83.7% 80 .6% 89. 0% 89 .1% 83.7% 59.9% 94 .0% 97.4% 83.7% 88.1% 40 .6% 7.8% 91.6% Inception-GCN AUC 91.6% 89 .1% 93.8% 100% 91.6% 77 .0% 98.3% 100% 91.6% 93.2% 5 0. 0% 0% 91.8% MMAF AUC 91.8% 90.2% 94.8% 94.6% 91.8% 79.2% 97.3% 98.8% 91.8% 9 4.0% 45.2% 9.7% 95.8% MGCS-GCN AUC 95.8% 94.3% 97.3% 100% 95.8% 87.8% 99.4% 100% 95.8% 96.4% 54.8% 0% 97.1% Proposed method AUC 97.1% 95 .4% 98.1% 100% 97.1% 94 .3% 99.7% 100% 97.1% 96.9% 58.9% 0% T ab le 9. DeepRoc analysis in the CN versus AD experiment on the NACC dataset FPR Pres. Risk [0,1] All [0,0.33] Group1 [0.33, 0.67] Group2 [0.67, 1] Group 3 91.0% Spectral-GCN AUC 91.0% 87 .8% 93.6% 100% 91.0% 7 3. 6% 99.4% 100% 91.0% 92.9% 63.5% 0% 93.9% Inception-GCN AUC 93.9% 93.7% 96.9% 92.1% 93.9% 86 .2% 96.9% 98.8% 93.9% 96 .3% 0% 20 .6 % 97.2% MMAF AUC 97.2% 95.8% 100% 100% 97.2% 91.6% 100% 100% 97.2% 97.2% 0% 0% 98.9% MGCS-GCN AUC 98.9% 98.3% 100% 100% 98.9% 96.6% 100% 100% 98.9% 98.9% 0% 0% 99. 2% Proposed method AUC 99.2% 98.9% 100% 100% 99.2% 97.1% 100% 100% 99.2% 99. 1% 0% 0% T ab le 10. DeepRoc analysis in the CN versus MCI experiment on the NACC dataset FPR Pres. Risk [0,1] All [0,0.33] Group1 [0.33, 0.67] Group2 [0.67, 1] Group 3 82 .7% Spectral-GCN AUC 82.7% 84.4% 80.5% 80.5% 82.7% 64.4% 87.8% 96.2% 82.7% 92.5% 51.9% 18.5% 91.6% Inception-GCN AUC 91.6% 92.0% 83.9% 100% 91.6% 80.7% 94.2% 100% 91.6% 96. 1% 44.2% 0% 94.8% MMAF AUC 94.8% 93.6% 94.3% 100% 94.8% 85 .2% 99.3% 100% 94.8% 96.6% 62 .3% 0% 96.7% MGCS-GCN AUC 96.7% 96.1% 96.2% 100% 96.7% 90.6% 99.6% 100% 96.7% 97.9% 62.5% 0% 97.5% Proposed method AUC 97.5% 97.3% 97.1% 100% 97.5% 91.1% 99.7% 100% 97.5% 98.2% 65.4% 0% (a) (b) (c) Fig. 8. DeepROC comparison visualization on the NACC dataset. (a) MCI&AD; ( b) CN&AD; (c) CN&MCI 4.5. Interpretability Analysis The interpretability of the p roposed MRC -GA T mod el was inv estigated to provide insights into how the model allocates attention across modalities and inter-sub ject relati ons. This was designed at two com plementary levels of modality- level gating and edge-lev el attention , allowing fo r both glob al and loca lized perspectives on how multimodal features interact d uring episodic lear ning. T ogether , these two analyses illustrate how MRC -GA T ac hieves transparen cy a nd context-aware representation learning throu g h its adap tive fusion mechani sm . At the modality level, the gating heatmap across ten representative episodes, as depicted in Fig. 9, demonstrated that the relativ e importance of RF , COG, and MRI modalities is no t fixed b ut dynamically changes. This implies that the m odel attentively adju sts the reliance on different feature source s with respect to changes in data composition and diagnostic context. For instance, in those episod es with significan t cognitiv e v ariability , the COG mo dality was m ore activated, while MRI features were more prom inent when structural biomarkers were more discrimin ative. Such fluctuations in the activations validate that the network effectively balances complemen tary information from heter ogeneous modalities and avoids overdepend ence on any single feature domain. S uch adaptive m odulation at the mod ality level provides a global understanding of how the network manages multimodal interactions, thus laying the co nceptual foundation for further edge -level interpretability an alysis. Fig. 9. Modality gating heatmap across ten episodes. Based on the ab ove global perspective , the edge- level interpretability result pr ovides additional insight into how MRC-GA T cap tures the fin e-grained relational dependencies between the subjects . as shown in Fig. 10 , there are th ree attention graphs that are modality-aware, where the thickness of the edges represents the at ten tion weights. The resu lt shows an asymmetric connectivity p attern wh ere o nly so me of the neighborin g sub jects stro ngly influence the targe t node represen tation. This observatio n indicate s that the mod el successfully captures th e important relatio nal dependencies between the s ubjects in th e clinical domain while supp ressing the les s informative ones. In add ition, the variation in the importance of the edges associated with each modality sh ows that the inf luence o f the relational dependencies d epends on the modality , which cap tures the way in which similar ities in demographics, co gnition, and imaging in fluence the pr ediction representatio n. The consistency in the above r esult with the p revio usly identified modality- level gatin g behavior provides evidence that the mo del provid es consistent interpretability insights at hierarchical lev els of reasoning. Fig. 10. Modality-specific attention graphs for RF , COG, and MRI . T aken together , the results presented in Figs. 9 and 10 demonstrate th at MRC-GA T ac hieves adap tive, context - dependent interpretab ility both globally and locally . The complemen tary findings betwe en modality -level gating an d edge-lev el atten tion analyses rein force the transparency and co nsistency of the proposed m odel’ s decision process, closely aligning with the interpretability o bjectives established in the earlier methodolo gy . 5. Conclusion and Future W ork This work in troduced MRC-GA T as an a dap tive and interpretable method for diagnosing Al zheim er's disease u sing multiple mo dalities. Integ rating copu la-b ased similarity align ment, r elational atten tion modeling , and node-wise g ated fusion within an ep isodic meta-learnin g paradigm effectively h andled some serious limitations o f traditional graph approaches, which are u sually static and tran sductive. The proposed design allows for flexible h andling of heterogen eous data sources spanning demogr aphic, cognitive, and neuroimaging modalities while preservin g b oth statistical consistency and generalizability . Extensive ex perimentation with the T ADPOLE and NACC datasets yielded a state- of -th e-art diagnostic accuracy of 96.87% and 92.31%, respectively , in thr ee -class classificatio n tasks. Furthermor e, its consistent sen sitivity and specificity acro ss different bin ary evaluations confirmed the ro bustness and diagnostic reliability of the m ethod in various clinical condition s. Moreo ver , the interpretability an alyses both at modality and edge levels showed that this m ethod dynam ically adjusts the co ntribution of heter ogeneous mod alities and adaptively iden tifies clin ically meaningfu l su bject relationships. Th is tran sparency is impor tant for a deep understand ing of the model's internal decision proce ss, enhancing trust and applicability in co mputer-aided medical diagnosis. While these results are pr omising, the current implementatio n bears a relatively h igh compu tational cost and involves parameter tuning. Future exten sions are needed to improve computational efficiency , extend the method to longitudinal and predictive m odeling of disease pro gression, and consider privacy- preserving and f ederated strategies for d eployment in multi- center clinical en vironments. Ethics Statement Ethical app roval and inform ed consent wer e not required for this study , as all d ata were obtain ed from publicly available, fu lly anonymized datasets (T ADPOLE and NAC C). Declaration o f generative AI and AI- assisted technolog ies in the manuscript preparation process During the preparatio n of this work, the authors used ChatGPT (OpenAI ) to assist in imp roving the fluency , clarity , and readability of the manuscr ipt. After using this tool, the authors carefu lly reviewed, edited, and validated the content and take full r esponsibility for the integ rity and accuracy of the pu blished work. Competing Interests The authors dec lare that they have no co mpeting interests. Referenc es 1. Kamal, M.S., et al., Alzheimer ’ s patient analysis using image and gene expr ession data and explainable-AI to pr esent associated genes. I EEE T ransactions on Instrumentation and Measurement, 2021. 70 : p. 1-7. 2. Nichols, E., et a l ., Estima ti on of t he g lobal pr evalence of dement ia in 2019 and for ecasted pr evalence in 2050: an analysis f or t he Global Burden of Disease Study 2019. The Lancet Public Health, 2022. 7(2 ): p. e105-e125. 3. W eller , J. and A. Budson, Curr ent understanding of Alzheimer’ s disease diagnosis and tr eatment. F1000Research, 201 8. 7: p. F1000 F aculty Rev-1 161. 4. Adarsh, V ., et al., Multimodal classification of Alzheimer's disease and mild cognitive impairmen t using custom MKSCDDL kernel over CNN with transpar ent decision-making f or ex plainable diagnosis. Scien tific Reports, 2024. 1 4( 1): p. 1774. 5. Schmand, B., et al., V alue of neur opsychological tests, neur oimaging, and biomarkers for diagnosing Alzheimer's disease in yo unger and old er age cohorts. Journal of the American Geriatrics Socie t y , 20 11. 59(9) : p. 1705-1710. 6. Citron, M., Alzheimer's disease: tr eatments in discovery and development. Nature neuroscience , 2002. 5(Suppl 1 1): p. 1055- 1057. 7. Hao, X., et al., Multi-modal neuro i maging featur e selection with consistent metric constraint for diagnosis of Alzheimer's disease. Medical image analysis, 2020. 60: p. 101625. 8. T ong, T ., et al., Multi-modal classification of Alzheimer's disease using nonlinea r graph fusion. Pattern recogn ition, 2017. 63: p. 17 1-181. 9. Farooq, A., et al. A deep C NN based multi-class classification of Alzheimer 's di sease using MR I . in 2017 IEEE Interna t ional Confer ence on Imag ing systems and technique s (IST) . 2017. IEEE. 10. W u, Y ., et al., An attention-based 3D CNN with multi-scale integration bl ock for Alzheimer's disease class ification. IEEE Journal of Biomed ical and Health Informatics, 202 2. 26(1 1): p. 5665 - 5673. 1 1. Li, J., et al ., 3-D CNN-based multichannel contrastive learning for Alzheimer ’ s disease automatic diagnosis. IEEE T ransactions on Instrumenta tion and Measureme nt , 2022. 71: p. 1 -11. 12. Dwivedi, S., et al., Multimodal fusion-based deep learning network f or effective diagnosis of Alzheimer ’ s diseas e. IEEE MultiMedia, 2 022. 29(2): p. 45-55. 13. Cheng, J., et al., Alzheimer ’ s disease pr ediction al gorithm based on de-cor r elation constraint and multi-modal featur e inte raction. Computers in biology and m edicine, 2024. 170 : p. 108000. 14. Ramana, T . and S. Nandhagopal, Alzheimer disease detection and classification on magnetic r esonance imaging (MRI) brain images using impr oved expectation maximization ( IEM) and convolutional neural network ( CNN). T urkish Journal of Computer and Mathematics Education, 2021. 12(1 1): p. 5998-6006 . 15. Jiang, W ., et al., CNNG: a convolutional neural networks with gated r ecurr ent units for autism spectrum disor der classi fication. Frontiers in Aging Neuroscience, 2022. 14: p. 948704. 16. Liu, S., et al., Attention def icit/hyperact ivity disor der cl assification ba se d on deep spatio-tempora l featur es of functional magnetic r esonance imaging. Biomedical Signal Processing and Control, 2022. 71: p. 103239. 17. Pfeifer , B., A. Saranti, and A . Holzi nger , GNN -SubNet: di sease subnetwork detection with explainable graph neural networks. Bioinformatics, 20 22. 38(Supplement_2): p. ii120-ii126. 18. Song, X., M. Mao, and X. Qian, Auto-metric graph neural network based on a meta-learning strategy for the diagnosis of Alzheimer's disease. IEEE Jour nal of Biomed ical and Health Informatics, 2021. 25( 8): p. 3141 -3152. 19. Y ang, F ., et al., M ulti-model adaptive fusion-based graph network for Alzheimer ' s disease pr ediction. Computers in B i ology and Med icine, 2023. 153: p. 106518. 20. W ang, H., et al., A Multi-graph Combination Scr eening St rategy Enabled Graph Convolutional Network for Alzh ei mer’ s Disease Diagnosis. IEEE Transactions on Instrumentat ion and Measurement, 2024. 21. Liu, L., et al., Cascaded multi-mod al mixing transformers for alzheimer ’ s disease classification with incomplete da t a. NeuroImage, 2 023. 277: p. 120267. 22. Zhu, Q., et al., Deep multi-modal discriminativ e and interpr etability network for Alzheimer ’ s disease diagnosi s. IEEE T ransac tions on Medic al Imaging, 2 022. 42(5): p. 1472-1483. 23. W ang, Y ., et al., Pred icting long-term pr ogress i on of Al zhe imer ’ s disease using a multimodal deep learning model incorpora ting interaction effects. Journal of T ranslational Me dici ne, 2024. 22(1): p. 265. 24. Xi, Y ., et al., Pr edicting conversion of Alzheimer’ s disease based on multi-modal fusion of neur oimaging and genet ic data. Complex & I ntelligen t Systems, 2025. 1 1(1): p. 58. 25. Almohimeed, A., et al., Explainab le artificial intelligence of multi- level stacking ens emble for detection of Alzheimer ’ s disease based on particle swarm opti mizatio n and the sub -scor es of cognitive biomar ke rs. Ieee A ccess, 2023. 1 1: p. 12317 3 -123193. 26. Chen, J., et al ., Multimodal mixing convolutiona l neural network and t ransformer f or Alzheimer’ s disease r ecognition. Expert Syst ems with Applications, 2025. 259: p. 125321. 27. Qu, Z., et al., A graph convolutional network based on univariate neur odegeneration biomarker for Alzheimer’ s disease d iagnosis. IEEE Journa l of Transla tional Enginee r ing in He alth and Medicine, 2023. 1 1: p. 405-416. 28. Zhang, M., et al., A featur e-awar e multimodal framework wi t h auto-fusion for Alzheimer ’ s disease diagnosis. Comput ers in Biology and Medicine, 2024. 178: p. 108740. 29. Li, S. and R. Zhang, A novel interactive deep cascade spe ctral graph convolutional network with multi-r elational graphs for di sease pr ediction. Neural Networks, 2024. 175: p. 106285. 30. V aloor , A. and G. Gangadharan, Unveiling the decision making proc es s in Alzheimer ’ s disease diagnosis: A case-based counterfactual methodology for explainable deep learning. Journal of Neuroscience Me t hods, 2025. 413 : p. 1 10318. 31. Bootun, D., et al., ADA MAEX—Alzheimer’ s disease classification via attention-enhanced autoencoders and XA I. Egyptian In formatics Jour nal, 2025. 30 : p. 100688. 32. Jahan, S., et al., Federat ed Explainab le A I -based Alzhe imer ’ s Disease Pr ediction W ith Multimodal Data. IEEE A ccess, 2025. 33. Rusch, T .K., M.M. B ronstein, and S. Mishra, A survey on oversmoothing in graph neural networks. arXiv preprint arXiv:2303.10993, 202 3. 34. W u, X., et al., Demystify i ng oversmoothing in attent i on-based graph neura l n etworks. A dvances in Neural Informati on Process ing Systems, 2023. 3 6: p. 35084-35106. 35. Marinescu, R.V ., et al., T ADPOLE challenge: pr ediction of longitudinal evolution i n Alzheimer's disease. arXiv prepr i nt arXiv:1805. 03909, 2018. 36. Beekly , D.L., e t al., The National Alzheimer's Coor dinating Center (NACC) da t abase: t he uniform data set. Alzh eimer Diseas e & Associ ated Disorders, 2007. 21(3) : p. 249-258. 37. Carrington, A.M., et al., Deep ROC analysis and AUC as balanced average accuracy to impr ove model selection, understanding an d i nterpr etation. arX iv preprint arXiv:2 103.1 1357, 2021. 38. Carrington, A.M., et al., D eep ROC analysis and AUC as ba lanced av er age accuracy , for impr oved classifier selection, audit and explanation. IEEE T ransactions on Pattern Analysi s and Machine Intelligence, 2022. 4 5(1): p. 329-341. 39. Huang, Y . and A.C. Chung, Disease pr ediction w it h edge- variational graph convo lutional networks. Medica l Image A nal ysis, 2022. 7 7: p. 102375. 40. Pellegrini, C ., N. Navab, and A. Kazi, Unsup er vised pr e-training of graph transformers on pat ient population graphs. Med ical Image Analysis, 2023. 8 9: p. 102895. 41. Parisot, S., et al. S pectral graph convolution s for popu lation-based dise ase pr ediction . in International confer ence on medical image computing and computer-ass isted intervention . 2017. Springer . 42. Kazi, A., et al. I nceptionG CN: r ec eptive field awar e graph convolutional network for disease pr ediction . in International confer ence on information pr ocessing in medical imaging . 2019. Springer .
Original Paper
Loading high-quality paper...
Comments & Academic Discussion
Loading comments...
Leave a Comment