Translating Dietary Standards into Healthy Meals with Minimal Substitutions
An important goal for personalized diet systems is to improve nutritional quality without compromising convenience or affordability. We present an end-to-end framework that converts dietary standards into complete meals with minimal change. Using the…
Authors: Trevor Chan, Ilias Tagkopoulos
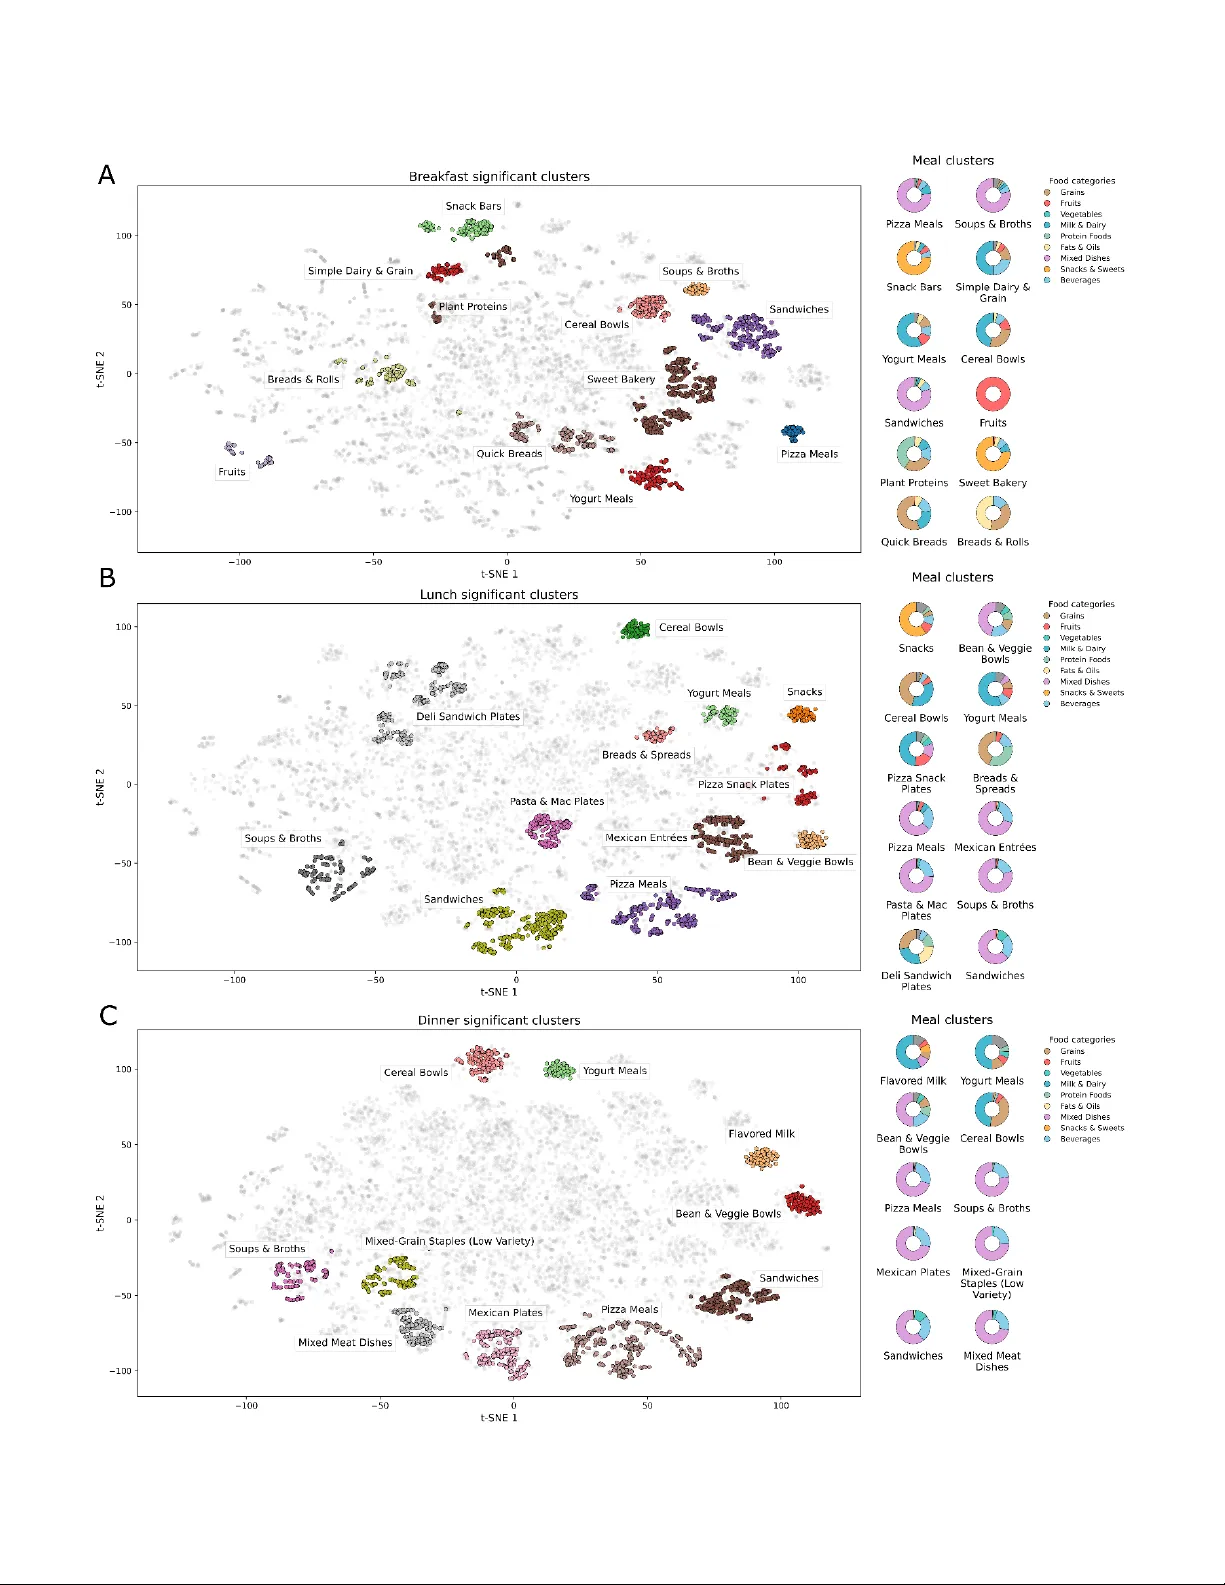
Translating Dietary Standards into Healthy Me als with Minimal Substitutions Trevor Chan 1,2,3 and Ilias Tagkopoulos 1,2,3* 1 Department of Computer Science, Univer sity of California, Davis , Davis, California 95616, USA 2 Genome Center, University of California, Davis, Davis, California, 95616, U SA 3 USDA /NSF AI Instit ute for Next Gen eration Food Systems (AIFS ), University of California, Davis, Davis, California, 95616 USA *Corresponding author (itagkopoulos@ucdavis.edu) Keywords: diet recommendation, public health, machine learning, nutrition, m eal generation ABSTRACT An important goal for personalized diet systems is to improve nutritional qu ality without compromising convenience or afford ability. We pr esent an end- to -end framework that converts dietary standards int o complete me als with mi nimal change. Using the What We Eat in Ame rica (WWEIA) inta ke data for 135,491 me als, we i dentify 34 interpretable me al arc hetypes tha t we then use to condition a generative model a nd a portion predictor to m eet USD A nutritional t argets. In comparisons within archetypes , generated meals a re be tter at fol lowing recommended daily intake (RDI) ta rgets by 47.0%, while remaining compositionally close to real meals . Our results show that by allowing one to three food substitutions, we were able to create m eals that w ere 10% more nutritious, while reducing costs 19-32%, on a verage. By turning dietary guidelines int o realistic, budge t-aware m eals a nd simple swaps, this framework can underpin c linical decision support, public-health progra ms, and consumer apps that deliver scalable, equitable improvements in everyday nutrition. INTRODUCTION Diet i s one of the most powerful , modifiable drive rs of obe sity, diabetes, cardi ovascular disease, and ot her non -communicable condi tions, yet translating nutrition science i nto day - to -day meals remains difficult for most people 1 . Personalized diet recommendation systems promise sca le and individualization, but m any tools still opti mize a single goal (taste, calories, or convenience), lack strict sta ndards-based evaluation, and provide limited guidance on how to change as little a s possible to eat better 2 . Consequently, there remains a gap betw een guideline -concordant diets and what re commenders reliably generate in practice 2 . Rule-based and expert -curated systems hel ped encode guidelines bu t often sacrificed adaptability and user fit 3 . Subsequent machine-learning approaches - cl inical opt imization for chronic disease (e.g., DietOS) and IoMT -assisted personalization - improved ta rgeting, yet frequent ly treated he alth met rics i n isolation and ra rely reported controlled benchmarking against USDA nut rient standards 3,4 . Many- objective/evolutionary methods began balancing adequacy, preferences, and dive rsity, and clustering/classification pipelines introduced segmentation, but most do not close the loop from what t o eat (composition) to how much to e at (portions), a t rad eoff which is a key determinant of adequacy, balance, and moderation in re al meals 5,6 and knowledge graph, heal th -aware recommenders 7 . Generative modeling has ac celerated progress towards t his goal. Systems , such as Yum- Me , explicitl y model both nutrient goals and taste 8 , while recent pipelines levera ging methods like variational autoencoders pro duce plausible meal plans 9 . More prevalen t LLM-based approaches also expl ore more interactive suggestions 10 . However, systema tic revi ews highlight inconsistency and factual errors in LL M -generated nutrition, underscoring the need for domain constraints a nd transpare nt, multi -objective e valuation 11 – 14 . For real -world impact in nutrition science and c linical i nformatics, tools must embe d dietary standards, quantify uncertainty, and deliver actionable and m inimal-change recom mendations t hat us ers can im plement w ithout overhauling habits 15,16 . Figure 1 | End- to -e nd me al gener ation, RDI-aware portioning, and substitution e valuation. (A) We start from c urated meals and train a c onditional variational autoencoder (CVAE) that samples realistic food combinations for a chosen archetype (e.g., breakfast) from a structured latent space. A portion assigner initializes standard servings a nd then a djusts grams to meet USDA RDI/AMDR targets while preserving t he combination. Downstream, we evaluate m inimal -change substitutions by searching a learned replaceability graph to find swaps that improve nutrition at lower or comparable cost under a portion-based re staurant pricing model. (B) Da ta and nutrie nts used for trai ning a nd e valuation . Counts of mea ls per tim e -of-day, the numbe r of foods availa ble for each meal type, and the nutrient panel (4 macronutrients, 11 micronutrients, a nd 5 diet quality metrics). (C) T he encoder/decod er of the C VAE a re conditioned on meal type and ca lorie band via Feature-wise Linear Modulation (FiL M ) layers. T he dec oder outputs food -presence proba bilities which feed the portion assignment module . Here, we pre sent an end - to -end fra mework for mea l generation, a nd substitution ( F igure 1A ) designed for public-health impact. We use a trai ning set of 65,202 meals, c onsisting of 2,019 foods (1,475 of them unique) , each associated with 20 nutrients and other nutri ent -metrics ( Figure 1B ), and we partition them into 34 a rchetypes (e.g. protein and grains) based on food categories and nutritional content. Then we train a Conditional V ariational A utoencoder (CVA E) , conditioned to these archetypes to generate representative meal s that a re sub sequently compared to real meals ( Figure 1C ). METHODS Data description. The USDA “W hat We Ea t i n America” (WWEIA) c omponent of the National Health and Nutrition Examination Survey ( NHANES) was t he pri mary source for all analyses 17 – 20 . We used six survey waves (2013 – 202 0), comprising 55,228 re spondents and 135,491 meals ( Supp lementary Table 1 ). WWE IA provide s a hiera rchical taxonomy of ingredients, foods, and meals inde xed by U SDA codes. Foods are c onstructed from ingredients and m eals are cons tructed from foods. We sta ndardized food c odes across survey waves using USDA’s disconti nuation and renumbering documen tation and retained dropped or revised codes where mapping was unambiguous. The final corpus contained 8,650 food codes a nd 2,94 0 i ngredient codes. We excluded pre -2013 surveys beca use di scontinuation ma ppings were incomplete, pre venting reliable c ode ha rmonization. Definitions for t erms used throughout a re gi ven in Su pplementary Table 2 . The pseudocode for the c omplete framework, which includes the data pr eprocessing, meal clustering, conditional meal generation, RDI portion ass ignment, a nd s ubstitution optimization is provided in the Section 4 of the Supp lementary Mate rial . Data Proc essing. T he W WEIA dataset underwent com prehensive preprocessing to e nsure dat a quality and reduce dimensionality. For surveys with discontinued food code documentation, we created a comprehensive dataset based on the discontinuation code given ( Supplementary Table 3 ). For expande d, consolidated, and renumbered food codes, a ll pre vious food code s affected w ere replaced with the most recent food codes. Dropped and re vised food c odes were kept i n the dataset. This yielded a d ataset with 120,375 meals and 6,212 foods. Of these meals, 39,749 were breakfast meals, 37,397 were lunch meals, and 43,229 w ere dinner meals. Data was org anized into time -of- day m eal- to -food data subsets with corres ponding gra m amounts. These datasets were furthe r reduced to binary da ta that repr esented t he presence or absence of food pe r time -of-day meal. Local Outlier Factorization (LOF) 21 was conducted a nd the top-0.3 percent of foods were removed based on negative outlier factorization score, resulting in the removal of 120 breakfast meals, 113 lunch meals and 130 di nner meals. To address the sparsity presented in the data s et, i.e. many foods but only several foods per meal , we created a prototype mapping system using a nutrient -aware aggregation algorithm ( Supplementary Section 1.1 ). T his approach reduced the food spac e by 87.5% while maintaining nutritional rep resentation, enabling more e ffective model tr aining. Finally, we constructed bootstrap confidence intervals for the mean of each food in each meal - to - food data subset to reduc e t he l ist of ingredients to only those ingredien ts that were r epresentative of the set of foods consumed. The lower bound of the confidence interval was used as a threshold for ingredi ent removal. T his resulted in the filtered data subsets of 528, 627, a nd 686 foods to 39,435, 37,024, and 42,831 meals for breakfast, lunch, and dinner, respectively. Clustering Analysis. We cluste red meals separately by time -of-day (breakfast, lunch, dinner) to preserve meal-specific structure. Each meal was embedde d in a hybrid, high -dimensional fea ture space that combined: (i) nut ritional composition (m acronutrients, fiber, energy, macro balance/density ratios) and (ii) categorical food composition (gram amounts per WWEIA main and subcategories, e.g., grains, fruits, vegetables, dai ry, mixed dishes, snacks/sweets, beverage s). Features were z-score standardized w ithin me al type. We t hen applied an enhanced HDBSCAN 22,23 proce dure with meal -type-specific parameters and pos t -proces sing cluste r merging for stability and coverage. To profi le c lusters, we contrasted with in -cluste r vs. complement feature means and control led multiple t esting wit h Benja mini – Hochberg c orrection 24 . We required an absolute mean diff erence ≥ 0.10 for significance and l abeled fe atures "distinctive" at | Δ| ≥ 0.20, reporti ng Cohe n's d for effe ct sizes 25 . Detailed fe ature extraction, clustering parameters, stat istical validation procedures, and cluster naming a lgorithms are de scribed i n Supp lementary Secti on 1.2 . T his process produc ed stable, interpretable cluster archetyp es for each meal type that were used as conditio ning varia bles for gen eration and evaluation. Meal Generation. Meal generation consisted of two stages: (1) a CVAE 26 that generates food combinations c onditioned on meal clusters and meal types (brea kfast/lunch/dinner), and (2) a simple RDI‑per‑kcal portion assignment that converts presence probabilities to portions for USDA ‑aligne d reporti ng while preserving t he m odel’ s food c ombinations. In the case of CVAE, the model uses dual condi tioning on cl uster and meal type (see Supplementary Information for architecture and hyperparameter choices). Portion Assignment. Meals are gene rated directl y in gram units using an RDI -per-kilocalorie strategy implemented within the generator module . Each meal type (breakfast, lunch, dinner) is assigned 25%, 35%, and 40% of a 2,000-k cal daily target , respectively (see Su pplementary Table 8 ). The generator computes per -kcal nutri ent densities from the daily RDI vector and optimizes food portions to minimize signed log₂ deviations fro m th ese p er -kcal t argets while enforcing total- energy balance a nd realistic gra m - level constraints (≤ 9 00 g per mea l, ≤ 25 % kcal from beverage s). Additional soft caps limit unrealistic com ponent ma sses ( Supp lementary Table 9 ). Evaluation frame work. We c onducted a head - to -head evaluation of generated meal s across 19,013 meals ( 6,268 breakfast, 6,393 lunch, a nd 6,352 dinner meals per significa nt clusters in Supp lementary Table 6 ), assessing establ ished nutritional adequacy a nd diversity metrics 27 – 32 . Table 1 show s t he metrics us ed in greater detail. For analysis, Cohen’s d was used for effect sizes. Bootstrap resa mpling (200 iterations) g enerated confidence in tervals. F DR correction was applied for multiple comparisons. Model stability was assess ed by 5 -fold cross-validation. Table 1 | P rimary e valuation metrics for generate d meal assessment . Summary definitions and mathematical forms for the five principal metrics used to eval uate generated meals: Mean Exc ess Ratio (MER), Mean Adequacy Ratio (MAR), AMDR composite, di etary Dive rsit y (Hill index), and Energy Density. Meal sub stitution analysis. For each generated meal, we identify a small set of simi lar r eal me als to serve a s candidat e substitutions. Similarity i s ba sed on overa ll it em overlap a nd compositi on, while requiring com parable meal energy and a simil ar number of items. We also c onsider simple single‑item replacements within the same food category. We define k as t he number of items replaced. For e ach candidate, we compute nutritional improvement as the reductio n in a verage absolute deviation from per‑meal Reco mmended Daily Intake (RDI) ta rgets (25%/35%/40% of daily RDI for breakfast/lunch/dinner). Cos t cha nge is calculated from a price‑per‑100g map derived from re tail price listings and ca teg ory‑specific multipliers are applied. We select winning substitutions using a simple tra de‑off between im provements in nutritional adequ acy and cost increases, wi th optional budget and “no co st increa s e” constraints. Portions in candidate r eal‑meal matches are taken a s observed; for single ‑it em swaps, the grams of the removed item are reassigned to the added item. RESULTS Meal clusters capture core U.S. meal archetypes across breakfast, lunch, and d inner. We retained 34 i nterpr etable clusters that map ont o common U.S. meal archetypes (i.e. general meal patterns) and differ meaningfully i n nutri tion ( Figure 2 ). Several clusters reve al behavioral trade-offs. For e xample a lunch breads & spreads pat tern ( Figure 2B ) pairs breads with a ve ry high fruit share (fruit ratio Cohen’s d = +12.41, q < 10⁻²⁷¹) a nd greater macro -diver sity ( Cohen’s d = +1.97, q < 10⁻¹¹⁴) but scores lower on overall meal balance (d = −2.05, q < 10⁻¹⁰³), s uggesting that meals within ha ve more snack-li ke plate s rather tha n balanced entrée plates. Conversely, Mexican entrées concentrate on the main dish and trim t he sides (ingredient count Cohen’s d = −0.74, q < 10⁻⁵²; porti on variability d = −0.66, q < 10⁻³⁷), with strong mixed -dish enric hmen t ( Cohen’s d = +4.47, q < 10⁻³⁰⁰). Toge ther, t hese nutrit ion -anchor ed cont rasts show that the ret ained clusters for training r epresent robus t meal arc hetypes spanning en ergy-de nse plat es (pizza dinners, sandwich l unches, cereal breakfasts), leaner/fi ber-posit ive options (yogurt across meal types , soups), and snack-style patterns (breads & spreads). Figure 2 | Meal archetypes across time-of-day in embedd ing s pace. t-SNE maps of meals from the hybrid feature space (nutrients and WWEIA category grams) show interpretable, compact clusters for brea kfast (top), lunch (mi ddle), and dinner (bottom). Grey points are background meals , and col ored islands are clusters tha t pass fa lse discovery rate ( FDR )-cont rolled distinctiveness tests. L abels re flect the most distinctive food -group and nutri ent signals (e.g., Cereal Bowls, Sandwic hes, Pizza Meals, Soups & Brot hs). Donut chart s at right summa rize each cluster’s food -group composition (WWEIA mai n cate gories), il lustrating the food -forward basis of the archetypes used for conditional gen eration and like - for -like evaluation. Generating realistic, uncompromised meals that improve RDI alignment. Figure 3 | Ge nerated meals improve nutritional targets while preserving variety. A) Similarity – di versity map , with generated me als c luster within their archetypes yet remain widely distributed, indicating pr eserved variety and real ism when matc hed by archetype a nd calorie band . (B) Nutritiona l shifts by m eal type . R elative to ma tched real meals, MAR (ade quacy) increases, AMDR c omplianc e (ba lance) improves, and energy density inc reases; selected micronutrients (e.g., vi tamin C) and pro tein adequacy rise, whil e sodium moderates. Points /boxes sh ow bootstrap means and 95% CIs (1,000 re samples) , FDR -corre cted for multiple comparisons. (C) Devi ation from USDA targe ts. Absolute per -meal media n RDI de viation drops by 47.0% overal l (43.2% breakfast; 52.1% lunch; 46.0% dinner), with significant improvements a cross most nutrients. We com pared generated a nd real meals within each meal‑archetype cluster using nonpara metric bootstrap re sampling (1,000 iterations per nutrie nt per c luster), counting an improvement when the 95% bootstrap interval for gene rated − re al lay below ze ro. Ge nera ted meals concentrate in the high‑similarity region while preserving dispersion across cl usters ( Figur e 3A ), w hile nutrition- related characteris tics are substantially improving ( Figure 3B ): adequacy inc reas es across meal types (MAR: + 7.8% breakfast; + 51.3% lunch; +14.4% dinner), median energy density is higher (+104.1%, +57.1%, +31.9% for breakfast, lunch, dinner), and micronutrient coverag e strengthens (e.g., vit amin C + 26.1%, +1 36.2%, +94.2% ). Concomitantly, 97.1% of c lusters show lower median deviation with respect to RDI recommendations for generated meals when c ompared to real same-cluster meals ; the median percent r eduction in cluster‑lev el medians is 43.2% (breakfast), 52.1% (lunch), and 46.0% (dinner) (overal l median 47.0% ; Figure 3C ). T he l argest improvements to RD I score are in the Dinner Cereal Bowls (−80.1% redu ction to t he RDI deviation ), Bre akfast Ce real Bowls (−73.0%), and Lunch Deli Sandwich Plates (−67.6%); the only case where deviation was increased was in the Bre akfast Pizza Mea ls (+50.8%). To evaluate the performance of our framework against sta te-of-the-art La rge Language Models, we compa red 3,400 m eals (1,000 meals per 34 signifi cant clusters) generated by our fra mework vs. simi larly ge nerated by GPT 4o ( Supplementary Mate rial ). Results show that in all metrics except d iversity, our fr amework over -perf ormed GPT -4o, w hich is the most powerful LLMs a t the time of the study , likely due to the high complexity and multi -obj ective nature of t he ta sk. More specifically, AMDR complia nce was higher for the CVAE when compared to the LLM methods, with 18.9 % vs 11.9%, re spectively, of meals generated being AMDR c ompliant . Aggrega ting macronutrient composition across meals, our fra mework averaged 12.7% protein, 27.7% fat , and 61.6% carbohydrate, wher eas GPT -4o averaged 16.8%, 39.4%, and 43.5%, and as su ch, GPT- 4o’s meals were bo th high-fat (>35% fat content) and low-carb (<45%). Interestingly, G PT-4o produced m ore diverse m eals (84%) t han our fra mework (78%) , which was not one of the objectives for this s tudy. Overall, our framework better satisfies RDI/AMD R-ba sed adequacy and macronutrient b alance in th e aggre gate, while GPT -4o te nds to em phasize compositional diversity. Food subs titutions can mak e meals 10% healthier for 32% less cost Can we improve existing m eals both nutritionally and cost -wise with minimal change? To answer this question, w e analyzed 13,656 generated m eals th at were one -substitution ( 3,858), two- substitutions (7,103), or thre e -substitution s (2,340) away from the total of 1,475 unique real foods . Figure 4A illustrates the p er‑meal accounting us ed throughout (nutrient d i fference and cost) for a specific me al with one a nd two substitutions (hops). At t he kne e of the cost – benefit frontier, substitutions deliver me aningful health improvements at lower c ost a cross all hop settings. The representative knee points i ndicate nutrition gains of 5.7% with 19.4% savings for 1‑hop, 8.1% with 30.2% savings for 2‑hop, and 10.7% with 32.9% savi ngs for 3‑hop ( Fig ure 4B ). T he composition of gains shifts systematically with hop c ount , with the number of hops correlating with t he across-category by intra-c ategory substitution per meal ratio, suggesting that the method has to resort to solutions from other categories to ma ximize benefit when multiple substitutions are allowed ( Fig u re 4C ). Wit h one ‑hop substitutions, improvements are nutrition‑led, accompanied by moderate cost relief and sma ll adjustments t o items/portions. Allowing t wo ‑ hop substitutions m aintains strong nutrition contribution and raises ease of a doption, indicating many options that stay close t o the original pl ate. Under three ‑ hop, the center of mass pivots toward savings whil e nutrition’s share mode rates ; ease remains compara ble. In ot her words, expa nding flexibility widens access to dee per discounts while still improving nut rition, whereas ti ghter constraints emphasize nutrition‑fi rst improvement s with smaller changes. Trade ‑off dia gnostics are consistent with these patterns. Together, the se results show that a long the e mpirical frontier there are two practical operating modes , name ly a local, nutrition‑forward improvement with meaningful but moderate savings, to a more far-reaching, budget ‑forward improvements that achieve larger discounts while still movin g nutrition upward. Figure 4 | Cost – benefit of machine -guided meal subs titutions . ( A) A real meal (top) and two of its generated one-hop (bottom left) and two-hop (bottom right) substitutes. The middle plot shows pe r-nutrient rat ios (substitute/original; log scale) with the vertical li ne at parity. Green points to the right i ndicate i ncreased pr ogress toward daily targets; re d to the left indi cate decreases. Inset s show be nefits of 2 -hop sw aps inc lude a reduction in cholesterol and a n i ncrease in vitamins. (B) Popula tion-level cost – benefit curve s summarizing, for one-, two-, and three-hop substitutions, t he trade -off between he al th gain (percent re duction in absolute pe r -meal RDI deviation) and cost savi ngs as the policy para meter θ varies. Stars indi cate the selected operating points. (C) Category t ransition heat maps for e ach sta rred operating poi nt. Ea ch cell shows the probability th at the row ca tegory is s wapped for th e co lumn category. Warme r colors de note more frequent di rected swaps. Marginal summaries i ndicate net adds/re moves, and cluste ring exposes motifs (e.g., more additions from vegetables /grains and fewer removals from high cost/low value categories), consistent with the cost – benefit gains. (D) Category -level swap scatters at the same operating points. Ea ch point is a category, with x-axis and y-axi s denoti ng the probability for t he added and removed category, respectively. Points on the di agonal reflect in -kind replacement; right/down shifts indicate net addi tions, up/ left indicate net removals. With higher hop c ount s, patterns conc entrate in add -heavy, easy- to -apply substitutions, consistent with an improved cost – benefit . DISCUSSION In this work, we present a meal generation and substitut ion framework that aims to create practical, realistic meals that optimize nutrition and c ost, while imposing small changes t o exi sting meal choices. T here a re several m ethodological advance s that facilitate i ts improved p erformance. First, segmenting the meal spac e in to meal archetypes based on nut ritional and co -occurrence embeddings has been key to a llowing the focused t raining of the machine learning engine (the conditional variational au toencoder). Similarly , separating the me al generatio n from port ion prediction improv ed nutritional a lignment while preserving food di versity. Without these two architecture design changes , t he F1-score from reconstructing the meal inputs in the autoencoder deteriorates from 0.99 to 0.64. T o quantify me al quality, we constructed multi-objective me trics to e valuate both real and generated meals based on their nut ritional alignment (RDI/AM DR), realism, and cost, a nd found t hat generat ed meals reduced the median deviation from pe r -meal RDI targe ts by 47.0% while remaining compositionally close to observed meals. Also, key to the whole design process was to start with combinations and servings tha t are curr ently a nd frequently consumed, rather t han ab i nitio plate and portion sizes. For example, to pre dict portion size s that are optimized for RDI, we sample within re al portion distributions pe r food, providing small, interpretable adj ustments t hat c orrect nutrient macro - and micro- imbalances without distorting t he underlying j oint food combinations. S imilarly, framing substitutions as a m ulti-objective trade-off, revealed opera ting points that can be tuned to user or program priorities – for example an interplay between hea lth, affordability, or compromise to pre ferred choices. Hea d- to -head benchma rking against a LLM baseline further supports the value of embedding domain constraints dire ctly into the generative process, a nd demonstrates higher standards-based performance (RDI/AMD R) than a free-form LLM approach. Furthermore, since recommendations are derived from codified standards, the system can surface meal options as point -of-care clinical decision support, with per-nutri ent deviations and a conc ise “why thi s meal” rationale (archetype match, portion adj ustments, and specific swaps) to enable transparency and interpretability. In additi on, expanding this frame work wit h a human- in -t he-loop step, will allow it to learn and adapt to prefere nce signals and feedback, while kee ping hard constraints, such as food allergies or clinical restrictions, in pla ce. Similarly, guardrails can be included for populations at risk or with special nutritional needs (as for example, during pregnancy), and disease-specific re commendations, by adding extra terms a nd inequa lity constraints on the multi -objective optimiz ation f ramework, and optimizing the weights for each such terms. Since one of the most importa nt fac tors in whether a recommendation w i ll be adopt ed both once and rout inely is how difficult and di fferent it is from the curre nt practice, just - in -time adaptive interventions a nd a very well calibrated preference system that tunes in the difficulty grade of a substitut ion will be important. Our current work performs the first step, by minim izing and keeping t rack of the number of hops, however, not al l substitutions are e qual, and integrating a “penalty” or “effort” matrix with both a genera l and personal i z ed component is likely t o increase the adherence to the proposed meals by minimizing the us er burden. Future work will extend th is NH ANES/WWEIA-based a nalysis, w hich relies on self-re ported U.S. intake, to broader cultural settings an d recipe -lev el granularity. Price s were estimated from publicly available retail listings w ith category -level restaur ant multipliers , and while appropriate for population -level analysis, a single, consistent pricing source would improve i ndi vidual-level budgeting accuracy. Finally, we evaluate nutriti onal alignm ent and modeled costs rather than long-term adherence or clinical outc omes . Prospective , user- in -the-loop studies — po tentially integrated with EHR/clinical decision sup port — should assess adherence, Healthy Eating Index change, and condition-specific outcomes to establish real-world impact and sustainability. These findings indicate a clear p ath toward actionable, guideline-c onsistent di et recommendations that respect preferences, budgets, and clinical constraints , a nd are suitabl e for scalable deployment across clinical and public-health settings. ACKNOWLEDGEMENTS We would like to thank th e members of the Tagkopoulos Lab for h elpful dis cussions and comments. T.C. designed and performed preliminary ana lysis, perform ed all computationa l analysis and created figures. T.C. and I.T . contributed to the critical analysis and wrote the paper. I.T. conceived and supervised all aspects of the project. Funding : T his work was supported by the USDA-NIFA AI Institute for Next Gen eration Food Systems (AIFS), USDA- NIFA award number 2020-67021-32855, as well as the N SF HDR:TRIPODS grant CCF -1934568. Data Availability: This study uses publicly available, de-identified intake data from the National Health and Nutrition Examination Survey (NHANES) “What We Eat i n America” (2013 – 2020). Raw files can be obtained from the official repositories. Any additional data produced in this study are available from the corresponding auth or upon reasonable request. Code Availability: All analysis and modeling c ode , and recreation of proce ssed datasets t hat support the findings (cluster lab els, eva luation outputs, and figure source da ta) are pr ovided in the Supplementary Information and in our repository ( htt ps://github.com/A I-Instit ute-Food- Systems/Diet_Recommendation_System ). Competing Interests: The authors declare no competing interests. REFERENCES 1. A fshin, A. et al. Heal th effects of dietary r isks in 195 countries, 1990 – 2017: a systematic analysis for the Global Burden of Disease S tudy 2017. The Lancet 393 , 1958 – 1972 (2019). 2. Trattner, C. & Els weiler, D. Food Recommender Systems: Important Contribu tions, Challenges and Future Research Direction s. Preprint at https://doi.org/10.48550/arXiv.1711.02760 (2017). 3. A gapito, G. et al. DIETOS: A dietary recommender system for chron ic diseases monitoring and management. Computer Methods and Programs in Biomedicine 153 , 93 – 104 (2018). 4. Iw endi, C., Khan, S., Anajemba , J. H., Ba shir, A. K. & Noor, F. Realizing an Efficient IoMT-Assisted Patient Diet Recommenda tion System Through Machine Learning Model. IEEE Access 8 , 28462 – 28474 (2020). 5. Zhang, J., Li, M., Liu, W., Lauria, S. & L iu, X. M any -objec tive optimization me ets recommendation systems: A food recommendation scenario. Ne urocomputing 503 , 109 – 117 (2022). 6. P hanich, M., Pholkul, P. & Phimoltares, S. F ood Recomm endation System Us ing Clustering Analysis for Diabetic Patients. in 2010 International Conference on Inform ation Science and Applications 1 – 8 (IEEE, Seoul, Korea (South), 2010). doi:10.1109/ICISA.2010.5480416. 7. Chen, Y., G uo, Y., Fan, Q., Zhang, Q. & Dong, Y. Health-Aware Food Rec ommendation Based on Knowledge Graph and Multi-Task Learning. F oods 12 , 2079 (2023). 8. Y ang, L. et al. Yum-Me: A Personalized N utrient -Based Meal Recommender System. ACM Trans. Inf. Syst. 36 , 1 – 31 (2018). 9. P apastrati s, I., Konstantinidis, D., D aras, P. & Dimitropoulos, K. AI nutrition recommendation using a deep generative model and ChatGPT. Sc i Rep 14 , 14620 (2024). 10. Khamesia n, S., Arefeen, A., Carpenter, S. M . & Ghasemzade h, H. NutriG en: Personalized Meal Plan Generator Leveraging Large La nguage Models to Enhance Dietary and Nutritional Adherence. Preprint at https:// doi.org/10.48550/arXiv.2502.20601 (2025). 11. Guo, P., Liu, G., Xiang, X. & An, R. From AI to the Table: A Sys tematic Review of ChatGPT’s Potential and Performance in M eal Planni ng and Dietary Re commendations. Dietetics 4 , 7 (2025). 12. Ponzo, V. et al. Is ChatGPT an Effective Tool for Providing Dietary Advice? Nutrients 16 , 469 (2024). 13. Haman, M., Školník, M. & Lošťá k, M. AI dietician: Unveiling the accuracy of Chat GPT’s nutritional estimations. Nutrition 119 , 112325 (2024). 14. O’Hara, C., Kent, G., Flynn, A. C., Gibney, E. R. & Timon, C. M. An Evaluation of ChatGPT for Nutrient Content Estimation from Meal Photographs. Nutrients 17 , 607 (2025). 15. Liu, X., Xu, M., Wang, H. & Zhu, L . Inte grating Precision Medicine and Digital He alth i n Personalized Weight Management: The C entral Role of Nutrition. Nut rients 17 , 269 5 (2025). 16. Dietary Guidelines for Americans, 2020 – 2025 (9th Ed.) . https://www.dietaryguidelines.gov/resources /2020 -2025-die tary-guidelines-online-m aterials (2020). 17. NHANES Overvie w . https://www.dietaryguidelines.gov/s ites/default/files/2020 - 12/Dietary_Guidelines_for_Americans_2 020 -2025.pdf. 18. WWEIA (What We Eat in America) . https://www .ars.usda.gov/northea st-area/beltsville- md - bhnrc/beltsville-huma n-nutrition-research-center/food-surveys-research-group/docs/wweia- documentation -and-data-sets/. 19. FNDDS : USDA ARS. https://www.ars.usda.gov/northeast -area/beltsville- md - bhnrc/beltsville-huma n-nutrition-research-center/food-surveys-research-group/docs/fndds 20. FPED overview : USDA ARS. https://www.ars.usda.gov/northeast -area/beltsville- md - bhnrc/beltsville-huma n-nutrition-research-center/food-surveys-research-group/docs/fped- overview 21. Breunig, M. M., Kriegel, H. -P., Ng, R. T. & Sander, J. LOF: identifying density-based local outliers. in Procee dings of the 2000 ACM SIGMOD international c onference on Management of data 93 – 104 (ACM, Dalla s Texas USA, 2000). doi:10.1145/342009.335388. 22. McInnes, L., Heal y, J. & Astels, S. hdbsca n: Hierarchical density based clustering. JOSS 2 , 205 (2017). 23. Campe llo, R. J. G. B., M oulavi, D., Zimek, A. & Sander, J. Hierarchical Density Esti mates for Data Clustering, Visualization, and Outlier Detec tion. ACM Trans. Knowl. Disco v. Data 10 , 1 – 51 (2015). 24. Benja mini, Y. & Hochberg, Y. Controlling the False Discovery R ate: A Practical and Powerful Approach to Multiple Testing. Journal of the Royal Statistical Society Seri es B: Statistical Methodology 57 , 289 – 300 (1995). 25. Cohen, J. Stati stical Power Analysis for th e Behavioral Sciences . (Routledge, 2013). doi:10.4324/9780203771587. 26. Sohn, K., Lee, H. & Yan, X. Lea rning Str uctured Output Representation using Deep Conditional Generative Models. in A dvan ces in Neural Information Processing Systems vol. 28 (Curran Associates, Inc., 2015). 27. Hill, M. O. Diversity and E venness: A U nifying Notation and Its Consequences. Ecology 54 , 427 – 432 (1973). 28. Madden, J. P. & Yoder, M. Program evaluation : food stamps and commodity distribution in rural areas of central Pennsylvania. https://worldcat.org/oclc/1312681 (1972). 29. Vieux, F., Soler, L. -G., Touazi, D. & Darmon, N. H igh nutriti onal quality is not associated with low greenhouse gas emissions in self-selec ted diets of F rench adults. The American Journal of Clinical Nutrition 97 , 569 – 583 (2013). 30. Rolls, B. J. Dietary e nergy density : Applying behavioural science to weigh t management. Nutrition Bulletin 42 , 246 – 253 (2017). 31. Trumbo, P., Schlic ker, S., Yates, A. A . & Poos, M. Dietary Reference Intakes for Energy, Carbohydrate, Fiber, Fat, Fatty Acids, Cholesterol, Protein and Amino A cids. J ournal of the American Dietetic Association 102 , 1621 – 1630 (2002). 32. Panel on Mac ronutrients et al. Dietary Reference Intakes for En ergy, Carbohydrate, Fiber, Fat, Fatty Acids, Cholesterol, Protein, an d Amino Aci ds . 10490 (National Academi es Press, Washington, D.C., 2005). doi:10.17226/10490. Translating Dietary Standards into Healthy Me als with Minimal Substitutions Trevor Chan 1,2,3 and Ilias Tagkopoulos 1,2,3* 1 Department of Computer Science, Univer sity of California, Davis , Davis, California 95616, USA 2 Genome Center, University of California, Davis, Davis, California, 95616, USA 3 USDA /NSF AI Instit ute for Next Generation Food Systems (AIF S), University of California, Davis, Davis, California, 95616 U SA *Corresponding author (itagkopoulos@ucdavis.edu) Supplementary materials and results 1. DATA ANALYSIS 1.1 Data Preprocessing We processed each meal type indepe ndently from ingestion t hrough filtering, di mensionality reduction, and modeling. We reconciled, expa nded, consoli dated, and renumbered USDA food codes to t heir most recent identifiers using the published disconti nuation m a ppings for 2013 – 2020 1 . Records from earlier years were e xcluded du e to incomplete mappings. Dropped or rev ised codes were retained when the ir usage coul d be consistently int erpreted across waves. This yielded a dataset with 120,375 meals a nd 6,212 foods across al l meal types 2,3 . Within each meal -type, we applied Local Outlier Factor ization 4 with a ne ighborhood size appropriate for de nse presence/gram matrices and a contamination rate of 0.3%. Scores were thresholded a t the 99.7 th percentile to remove only t he most extreme composition profiles. This step removed 120 breakfast, 11 3 l unch, and 130 dinner m eals, respectively, while preserving c entral structure and variance. T o mitigate sparsity and improve model tracta bility without sacrificing nutritional signal, we merged foods into prototypes us ing an aggregation m ethod guided by nutri ent prof ile s. The method used dynamic K allocation across W WEIA sub cate gories with meal -type- specific parameters (α=0.10, K_max=8 per subcategory, minimum subcategory size=6). Four criteria were applied to selec tion and assignment: 1. Mass cove rage ≥ 90% of t otal consumed gram s t o ensure prot otypes represent what people actually eat, 2. Nutrient fidelity with a ≤ 7% weighted me an absolute relative error across the nutrient panel used downstream; 3. Dynamic allocation of prototype counts across WWE IA subcategories (more capacity where heterogeneity is high) , 4. Assignment quality w ith a cosine-similarity floor of 0.70 between a food and its prototype. This proc edure redu ced th e number of foods by 87.5% (6,212 foods to 777 foods ) while maintaining macro- and m icro-nutrient dis tributions a t the meal type level. For each meal type, we computed the binary presence of each food across meals and constructed nonparametric confidence intervals for t he mean food presence in meals using 1,000 bootstrap resamples with replacement. We retaine d foods whose empirical mean exceeded the lower 95% confidence boun d and rem oved foods be low that bound as non -repre sentative. Meals t hat became all -zero a fter filtering were dropped. T his yiel ded 39,435 breakfa st meals with 528 foods, 37,02 4 lunc h me als with 627 foods, and 42,831 dinner meals with 686 foods. 1.2 Clustering Analys is 1.2.1 Feature Extrac tion. For each meal type (breakfast, lunch, dinner), we constructed a hybrid feature set t hat includes (a) nutrient tot als (prote in, carbohydrate, total fat, fiber, ene rgy), macronutrient perc ent -of-energy ratios and balance scores, log -transformed versions of s kewed nutrients, a nd simple macro -interaction t erms; and (b) gram am ounts pe r WWEIA cat egory and subcategory (15 main groups a nd 40+ subgroups; e.g., pi zza, soups, cereals, savory snacks, sweetened beve rages). We also included mea l-level c omposition i ndicators (e.g., item count, portion variability, calorie density, food -category di versity). T he c ompl ete feature set comprised 84 fea tures pe r me al, including 5 core nutritional features, 16 derived nutritional feature s, 53 WWEIA c ategory gram am ounts (24 main categories and 29 subcategories), 5 enhanced composition metrics, and 5 tra nsformed feat ures ( Supplementary Table 5 ) All features were standardized by z- scoring within meal type prior to clustering. 1.2.2 Enhanced HDBSCAN Clustering. We used HDBSCAN 5 with a Euclidean m etric a nd excess-of-mass (E OM) cluster selection me thod. Be fore clustering, we removed feature s with near-zero variance and those t hat were > 95% z ero across me als to re duce noise. To favor generalizable clusters, we set meal -type-specific p arameters: bre akfast (m in_clus ter_size=50, min_samples=25, alpha=1.0, cluster_selection_epsilon=0.1), lunch (min_clu ster_size=40, min_samples=20, alpha=1.0, c luster_selection_epsilon=0.08), and dinner (min_cluster_size=35, min_samples=18, a lpha=1.0, cluster_selection_epsilon=0.06). These parameters were adjusted t o reflect distributional differences (breakfast is typicall y more diverse while dinner is more homogeneous). After clustering, small clusters were merged int o the most similar larger cl uster using centroid similarity (merge when cosine similarity exc eeded 0.7; otherwise assign to the nearest l arge cluster by Euclidean di stance). This post -proce ssing ste p increa sed coverage while preserving separability of dominant meal patterns. 1.2.3 Statistical V alidation. For ea ch cluster, we compared feature distributions against the complement set using a two -part hurdle approach: a prevalence test (non -zero vs. zero; Fisher's exact 6 w here appl icable) and a n int ensity test on non -zeros (two-sided M ann – Whitney 7 ). F or each feature, we retained t he p-val ue, then applied Benjamini –Hochbe rg FDR control at q ≤ 0.01 8 across all cluster – feature pairs. W e required a minimum absolute me an difference of 0.15 to decla re significance a nd flagged distinctive fe atu res at |Δ| ≥ 0.20. We report Cohen's d 9 to summarize effect sizes. Cl usters domi nated by beverages or exhi biting ultra -sparse compositions were deprioritized during interpretation to maintain food -forward, practically actionable a rchetypes. Cluster nam es were manually annotated by observing significant de scriptors of ea ch cluster. These clusters serve as conditioning variables in the generative model and as s trata for evaluation . 2. MEAL GENERATION PIPELINE 2.1 Food Composition Generation We use a conditional VAE (CVAE) 10 t o predict t he presence of foods, joi ntly conditioned on cluster and meal type. The encoder is an MLP (ReLU, 0.1 dropout ) producing a 64‑dimensional Gaussian late nt z. The decoder is a presenc e hea d with FiL M modulation 11 : 3 Dense(512, GELU 12 ) blocks, e ach FiLM‑conditioned by the concatenated c luster and meal embeddings (32‑dim each). Two structural priors are installed: (i) a learned pair‑specifi c prior that boosts li ke ly foods per (meal, cl uster), a nd (ii) a hard allowed‑foods ga te t hat zero es disallowed items (also appli ed as a hard mask a t inference). Training uses Adam 13 (l earning ra te of 0.0005) a nd a batch size of 128 over 50 epochs. The l oss is weighted bi nary cross‑entropy with dynamic positive ‑cl ass weighting plus K L with free‑bits 14 and an ann ealed β s chedule 15 (l inear w armup to 0.01, then li ght triangular cycling). 2.2 Portion Assignment For portion a ssignment, w e e mploy ed a n RDI-per-ki localorie opt imization. For each ge nerated meal from th e CV AE , foods with predicte d presence prob abilities above a thr eshold (p ≥ 0.02) are retained up to a maximum of 12 items. From t he daily RDI vector , we c ompute per-kcal nutr ient densities where kcal . Ea ch me al receives a fractional energy allocation , giving meal -scaled targets Vitamin D units are au to- converted (IU to µ g) before normalization. We l et denote per- gram nutrient densities and the portio ns(g) of selected foods. The optimization minimizes asymmetric log₂ deviations fro m meal -scaled targets: where and weight under - and over-consumption pe nalties (de faults liste d in Sup plementary Table 10 ). High-priority adequacy nut rie nts (e nergy, protein, fiber, potassium) recei ve greater weights (2.0), while moderati on nutrients (sodium, added sugars, saturated fat ) receive stronger penalties (3 to 4). Portions are constrained by: • Total grams: ≤ 900 g per meal; soft downs caling if exceed ed • Beverages: ≤ 25% kcal of meal energy, with per -meal c aps 300 g/350g/350g (breakfast/lunch/dinner ) • Component caps: Sugars ≤ 12g, Fats/Oils ≤ 20g, Condi ments/Sauces ≤ 20g, Snac ks/S weets ≤ 60g • Per- item bounds: Solid foods ≤ 300 g each; minimum solid items = 2 /3/ 3 (breakfast/lunch/dinner ) Optimization proceeds until the me al energy target i s matc hed . Nutrient totals a re re -projected if group caps bi nd. The final portion vector defines a nu tritionally coherent meal in grams. Derived nutrients are reported as . 2.3 Comparison agains t state-of-the-art LLM We evaluated our CVAE a gainst a stat e-of-the -art larg e langu age model, GPT-4o for meal recommendation. An exam ple of a prompt that was used to generate breakfast meal s is the following: where we limited GPT- 4o’s cont ext to include only the inputs provided to our gene rator, i.e. only foods c onsidered within cluster were used by GPT -4o in its meal generation process, as well as the constraints, i.e. nutritional targets, pro vided to our port ion assignment module. 3. FOOD SUBSTITU TION 3.1 Pricing Data. We price meals using a portion-ba sed restaurant model deriv ed from public menu listings and industry guides. For each item , we speci fy a grams-per-portion and a price -per-portion . Given the meal’s actual grams , we compute a capped portion multiplier where is a category-dependent cap that limits how many port ions of an item can be charged within a single meal. The meal cost is the n with a confi gurabl e overhead pa rameter , in expe riments it was set to $2. Certain categories were capped, for example soups and fruit-salad ; sides ; m ain entrees and mixed dishes . W e used a GPT -5 deep-researched grocery pricing matrix per-100 grams of food for any uncategorized foods. We also applied cross-item caps (e.g., at most one soup bowl and one fruit-salad serving per meal) for a dde d meal practicality. 3.2 Evaluation . We treat food substitutions in a meal a s a constrain ed nearest- neighbor problem 16 over real meals. From the real meal dataset, we an alyzed 13,656 meals for which a generated substitute could be found, dra w n from 1,475 unique real foods (Breakfast 455, Lunch 493, Dinner 527; rows by type: Breakfast 4,275, Lunch 4,625, Dinner 4,756). For each generated meal, we form a candidate pool by retrieving the k -nearest real meals usin g a similarity that mixes presence Jaccard 17 and portion-cosine 18 (weight 0.7/0.3), unde r energy and item count. Similarity c ombines item over lap and portion c omposition; we require comparable energy (±5%) and similar item count (±1). For each candidat e pair we compute edits and define sub added remove d . Analyses are run separately at sub by enforcing e xac t sub at selection time. Subs equently, we define • Nutrition gain as the positive change in percent of daily targets ach ieved. We us e so that negative changes do not contribut e to “gain.” • Cost saving as the positive percent reduction in price, • Swap effort as the behavioral burden of the substitution, if taken. We combine (i) portion shift - the L 1 chang e in ingredient weights, normalized by the meal’s total weight - and (ii) com position ch ange - the larger of “added ” or “removed” ingredients . Effort is sub ‑ aware - we norm alize portion an d composition changes against k‑based baselines, and set , with . 3.3 Winner Selection. For a tra de-off preference , we ma p to a health we ight . Each candidate receives a value CI where • RDI is the health gain in percentage points (red uction in mean absolute deviation from per-meal RDI targets). • Cost real Cost sub Cost real is cost saving (non -negative by construction). • CI Cost sub Cost real Cost real is the c ost-increase penalty (zero when th e substitute is cheaper or equal). We omit candidates that add or remove items from bevera ges or other main categories; pure portion-only edits are allowed but treated as within-category. Substitution winning candidates with the highest are chosen in two stages: 1. Withi n-category stage. If any candidates k eep the WWEIA main category matched between added and removed items (or onl y change portions), we shortlist them and pick the top by the value score below. 2. Cross-category challenge. A cross-ca tegory candidate may over take the provisional within-category winner only if it is clearly better. If it adds any mixed dishes, it must exceed the within-cate gory score by both a relative margin and an absolute buffer ; otherwise a ≥ 20% relative uplift is required. If no within -category options exist, we select from the pooled set. Ties are broken by (i) smaller portion -shift percentage, then (ii) larger health increas e, then (iii) smaller cost savings. We ignore candidates with negative health change and drop negative overall scores when considering substitution candidates. 3.4 Cost – benefit aggregation. Sweeping a cross a grid spanning health-tilted to cost-tilted regimes, we select per-meal winners with , report the median nutrition gain and median savings across meals, and form 95% bootstrap CIs over meals (1,000 re samp les). 4. ALGORITHMIC IMPLEMENTATION Putting everything together, our fra mework, executes the following workflow. REFERENCES 1. 2019-2020 F ood and Nutrient Database for D ietary Studies Documentation. 2. NH ANES Overvie w . https://www .dietaryguideli nes.gov/s ites/default/files/2020 - 12/Dietary_Guidelines_for_Americans_2 020 -2025.pdf. 3. WWEIA (What We Eat in America) . https://www .ars.usda.gov/northeast -area/beltsville- md - bhnrc/beltsville-huma n-nutrition-research-center/food-surveys-research-group/docs/wweia- documentation -and-data-sets/. 4. Breunig, M. M ., Kriegel, H. -P., Ng, R. T. & Sander, J. LOF: identifying density-based local outliers. SIGMOD Rec. 29 , 93 – 104 (2000). 5. M cInnes, L., Healy, J. & Astels, S. hdbscan: Hierarchical density based clustering. JOSS 2 , 205 (2017). 6. F isher, R. A. On the Interpretation of χ 2 from Contingency Tables, and th e Calculation of P. Journal of the Royal Statistical Society S eries A (Statistics in Society) 85 , 87 – 94 (2018). 7. M ann, H. B. & Whitne y, D. R. On a Test of Whether one of Two Random Variables is Stochastically Larger than the Other. Ann. Math. Statist. 18 , 50 – 60 (1947). 8. Benjamini, Y. & Hochberg, Y. Controllin g the False Discovery Rate: A Practical an d Powerful Approach to Multiple Testing. Journal of the Royal Statistical Society Seri es B: Statistical Methodology 57 , 289 – 300 (1995). 9. Cohen, J. Statistical Power Analysis for the Behavioral Sciences . (Routledge, 2013). doi:10.4324/9780203771587. 10. Sohn, K., Lee, H. & Yan, X. Lea rning Str uctured Output Representation using Deep Conditional Generative Models. in A dvan ces in Neural Information Processing Systems vol. 28 (Curran Associates, Inc., 2015). 11. Perez, E ., Strub, F., Vries, H. de, Dumoulin, V . & Courville , A. FiLM: Visual Reaso ning with a General Conditioning Layer. Prepri nt at https://doi.org/10.48550/arXiv.1709.07871 (2017). 12. Hendrycks, D. & Gimpel, K. Gaussian Error Linear Units (GELUs). Preprint at https://doi.org/10.48550/arXiv.1606.08415 (2023). 13. Kingma, D. P. & Ba, J. Adam: A Method for Stochastic Optimization. Preprint at https://doi.org/10.48550/arXiv.1412.6980 (2017). 14. Kingma, D. P. et al . Improving Variationa l Inference with Inverse Autoregressive Flow. Preprint at https://doi.org/10.48550/arXiv.1606.04934 (2017). 15. Chen, X. et al . Variational Loss y Autoencoder. Preprint at https://doi.org/10.48550/arXiv.1611.02731 (2017). 16. Cover, T. & Hart, P. Nearest neighbor pat tern classification. IEEE Trans. Inform . Theory 13 , 21 – 27 (1967). 17. Jacca rd, P. Étude compara tive de la distribution florale dans une portion d es Alpes et du Jura. https://doi.org/10.5169/SEALS- 266450 (1901) doi:10.5169/SEALS-266450. 18. Manning, C. D., Raghava n, P. & Schütze, H. Introduct ion to Information Retrieval . (Cambridge University Press, 2008). doi:10.1017/CBO9780511809071. SUPPLEMENTARY TABLES Number of Records Number of Respond ents Number of Meals Breakfast Lunch Dinner NHANES 2013-2014 Day 1 131,394 8,661 21,331 7,019 6,594 7,718 NHANES 2013-2014 Day 2 112,578 7,573 19,250 6,367 6,074 6,809 NHANES 2015-2016 Day 1 121,481 8,505 20,501 6,789 6,298 7,414 NHANES 2015-2016 Day 2 100,680 7,027 17,539 5,827 5,538 6,174 NHANES 2017-2020 Day 1 183,910 12,632 30,242 9,914 9,210 11,118 NHANES 2017-2020 Day 2 149,495 10,830 26,628 8,865 8,244 9,519 Total 799,538 55,228 135,491 44,781 41,958 48,752 Supp lementary Table 1 | Tabl e showing the number of records, responden ts, and meals per NHANES survey from 2013-2020. Term Definition Nutrients the atomic units of meals e.g. vitamin C, I ron Ingredients composed of multiple nutrients, has a USDA ingredient code e.g. rice, seaweed Food composed of multiple ingredients, has a US DA food code e.g. sushi, sake Meal composed of multiple foods e.g. sushi with s ake Real Meal meal that is consumed by real people (ground truth) Practical Meal meal that resembles a meal that is consumed by the population Time -of-day the eating occasion of a given mea l e.g. breakfast, lunch, dinner Healthy as nutritionally close to USDA nutritional guidelines as possible Recipe ingredients with a list of instructions on h ow to cook them to become foods Supp lementary Table 2 | Definitions of me al composition framework Discontinued Food C ode Description 1 – Dropped Products no longer on the market; codes rarely used in the survey; items better coded using individual components as a combination. The specific products represented by some deleted codes have changed and no longer represent the food/beverage as described; however, sim ilar products may be present within new/existing codes. 2 – Expanded New codes were created and the original code was discontinued. Modifications eliminat ed - products expanded to include presence/typ e of fat; codes expanded to designate source (restaurant, fast food, school); codes expanded by different ingredients. Code s representing more than one product or variety were expanded to individual codes. 3 – Consolidated Multiple codes now captured under a new/existing single code. The original codes were discontinued. 4 – Renumbered A food code was assigned a different 8 -di git number yet represents the same product. Main food description may have been revi sed. 5 – Revised Codes received extensive revisions, includ ing expansion and consolidation. Supp lementary Table 3 | FNDDS disconti nued food codes. Number of Meals Number of Uniqu e Foods Breakfast Lunch Dinner Breakfast Lunch Dinner Raw Dataset 135,491 7,679 44,781 41,958 48,752 4,346 6,063 6,633 Food code standardization and filtration of unusable data 134,457 6,599 44,440 41,628 48,389 3,881 5,361 5,804 Outlier Filtration 134,052 6,599 44,306 41,503 48,243 3,881 5,361 5,804 Bootstrap Confidence Intervals 134,052 6,591 44,306 41,503 48,243 3,872 5,356 5,788 Food composition Filtration 65,202 2018 25,675 19,674 19,853 378 794 846 Supp lementary Table 4 | The data visualizati on of the dataset size in terms of meals and their corresponding foods at each preprocessing step. Table showing the preproces sing steps and resulting data dimensionality Feature Category Count Reformatted Feature Names Description Core Nutritional Features 5 Protein (g), Carbohydrate (g), Fat (g), Fiber (g), Energy (kcal) Basic macronutrients and energy Derived Nutriti ona l Features 16 Protein Ratio, Carbohydrate Ratio, Fat Ratio; Protein Level, Carbohydrat e Level, Fat Level, Energy Level; Protein – Carbohydrate Bal ance, Protein – Fat Balance, Carbohydrate – Fat Balance ; Meal Balance Score, Nutritional Bala nce; Grain Ratio, Vegetable Rat io, Fr uit Ratio, Dairy Ratio Macronutrient and meal bala nce indicators WWEIA Main Categories 24 Milk/Dairy, Mixed Dishes, Gra ins, Snacks/Sweets, Fruits, Veget ables, Beverages , Alcoho lic Bevera ges, Water , Co ndiments/Sauces, Sugars, Baby Foods, Other; Milk, Flavored Milk, Dairy Drinks, Cooked Grains, Savory Snacks, Diet Beverages , Sweetened Bevera ges, P lain Water, Flavored Water, Baby Beverages, Human Milk Main WWEIA categories WWEIA Subcategories 29 Protein Foods, Fats/Oil s, Cheese, Yogurt, Meats, Poultry, Seafood, Eggs, Cured Meats, Plant Proteins; Mixed Meat Dis hes, Mixed Bean Dishes, Mixed Grai n Dishes, Asian Dishes, Mexican Dishes, Pizz a, Sandwiches, Soups; Breads/Rolls, Quick Breads, Cereals, Crackers, Snack Bars, Sweet Bakery, Candy, Desse rts; Juice, Coffee/Tea , Infant Formulas Protein, mixed dish, grain/snac k, and beverage subcategorie s Composition Features 5 Macronutrient Divers ity, Food Category Diversity, Ingredient Count, Portion Variabil ity, Calorie Density Meal-level composition indicators Transformed Features 5 log Protein (g), log Carbohydrate (g), log Fat (g), log Energy (kcal) , log Fiber (g) Log -tra nsformed nutritional fea tures Supp lementary Table 5 | Summary of engineere d meal -level feature categories used in th e analysis. This table lists all features derived from USDA and WWE IA mappings, grouped into six major categories. Core Nutritional Features capture basi c macronutrient quantities and energy values. Derived Nutritional Features inclu de macronutrient ratios, balance s cores, and food group proportions. WWEIA Main and Subcategories represent hier archical food groupings s panning milk, grain, fruit, vegetable, protein, and beverage doma ins. Composition Features quantify meal -level div ersity, portion variability, and calorie density, while Transformed Fe atures provide log-scaled nutrient representations for nor malized statistical modeling. Meal Type Cluster Name Number of Meals Number of Foods Top Categories Max Absolute Cohen's d Breakfast Pizza Meals 238 59 Pizza; Mixed dishes; Flavored milk; Sweetened beverages; Diet beverages 43.32 Soups & Broths 223 59 Soups; Mixed dishes; Plain water; Condiments sauces; Flavored milk 14.19 Snack Bars 549 56 Snack bars; Snacks sweets; Plain water; Yogurt; Mixed bean dishes 15.57 Simple Dairy & Grain 277 49 Other; Milk; Milk dairy; Plain water; Mixed bean dishes 8.25 Yogurt Meals 590 51 Yogurt; Milk dairy; Fruits; Plain water; Cereals 9.77 Cereal Bowls 508 50 Dairy drinks; Cereals; Milk dairy; Grains; Fruits 8.23 Sandwiches 1122 55 Sandwiches; Mixed dishes; Sweetened beverages; Beverages; Coffee tea 8.66 Fruits 301 12 Fruits; Mixed bean dishes; Flavored water; Savory snacks 12.89 Plant Proteins 213 41 Plant proteins; Breads rolls; Protein foods; Grains; Coffee tea 4.36 Sweet Bakery 1871 45 Sweet bakery; Snacks sweets; Coffee tea; Mixed bean dishes 4.22 Quick Breads 711 38 Quick breads; Grains; Sugars; Milk; Mixed bean dishes 3.04 Breads & Rolls 396 35 Breads rolls; Fats oils; Coffee tea; Sugars; Grains 1.92 Lunch Snacks 247 69 Snack bars; Snacks sweets; Fruits; Cracke rs; Plain water 16.53 Bean & Veggie Bowls 278 66 Mixed bean dishes; Mixed dishes; Plain water; Meats; Cooked grains 15.13 Cereal Bowls 271 67 Cereals; Milk; Grains; Milk dairy; Sugars 11.85 Yogurt Meals 218 61 Yogurt; Milk dairy; Plain water; Cooked grains; Fruits 8.85 Pizza Snack Plates 465 51 Flavored milk; Milk dairy; Pizza; Poultry; Fruits 5.6 Breads & Spreads 210 40 Sugars; Plant proteins; Breads rolls; Grains ; Protein foods 4.28 Pizza Meals 1242 49 Pizza; Mixed dishes; Sweetened beverage s; Milk; Beverages 5.46 Mexican Entrées 767 41 Mexican dishes; Mixed dishes; Sweetened beverages; Plain water; Beverages 4.26 Pasta & Mac Plates 527 38 Mixed grain dishes; Mixed dishes; Plain water 3.91 Soups & Broths 761 38 Soups; Mixed dishes; Plain water 4.34 Lunch Dinner Deli Sandwich Plates 703 44 Cheese; Breads rolls; Cured meats; Grains ; Milk dairy 2.05 Sandwiches 1124 38 Sandwiches; Mixed dishes; Sweetened beverages; Beverages; Condiments sauces 4.02 Flavored Milk 352 70 Flavored milk; Milk dairy; Sweet bakery; Pizza; Desserts 24.54 Yogurt Meals 304 72 Yogurt; Milk dairy; Cooked grains; Plant proteins; Plain water 17.4 Bean & Veggie Bowls 369 64 Mixed bean dishes; Mixed dishes; Plain water; Beverages; Mixed meat dishes 10.8 Cereal Bowls 551 61 Cereals; Milk; Milk dairy; Grains; Sugars 9.54 Sandwiches 884 44 Sandwiches; Mixed dishes; Sweetened beverages; Beverages; Condiments sauces 4.93 Pizza Meals 1715 43 Pizza; Mixed dishes; Sweetened beverage s; Snack bars 4.99 Soups & Broths 578 36 Soups; Mixed dishes; Plain water; Snack bars 3.82 Mexican Plates 850 37 Mexican dishes; Mixed dishes; Sweetened beverages; Plain water; Snack bars 3.72 Mixed Meat Dishes 537 38 Mixed meat dishes; Mixed dishes; Plain w ater; Snack bars 2.92 Mixed- Grain Staples (Low Variety) 504 31 Mixed grain dishes; Mixed dishes; Plain water; Snack bars 2.59 Supp lementary Table 6 | Meal distributions per cluster. The number of meals and unique foods per significant cluster, a nd the top c ontributing food categories. These meals form the basis for the training of the meal generation model (CVAE), and upon generation the sa me number of meals per cluster was used for evaluation. Metric Breakfast Lunch Dinner F 1 (micro) 0.9967 ± 0.0008 0.9969 ± 0.0007 0.9975 ± 0.0004 F 1 (macr o) 0.8337 ± 0.0396 0.8417 ± 0.0328 0.8486 ± 0.0342 Precision (micr o) 0.9967 ± 0.0008 0.9969 ± 0.0007 0.9975 ± 0.0004 Precision (macro) 0.8393 ± 0.0441 0.8564 ± 0.0410 0.8877 ± 0.0149 Recall (micro) 0.9967 ± 0.0008 0.9969 ± 0.0007 0.9975 ± 0.0004 Recall (macro) 0.8291 ± 0.0397 0.8287 ± 0.0278 0.8189 ± 0.0473 AUROC 0.9844 ± 0.0022 0.9834 ± 0.0024 0.9740 ± 0.0023 AUPRC 0.7317 ± 0.0893 0.7447 ± 0.0764 0.7532 ± 0.0734 Brier score 0.00235 ± 0.00047 0.00223 ± 0.00040 0.00195 ± 0.00035 Count R² 0.7689 ± 0.0179 0.8562 ± 0.0289 0.7593 ± 0.0441 Count Bias 0.0763 ± 0.0077 0.0746 ± 0.0109 0.1198 ± 0.0204 True count (mean) 2.530 ± 0.014 2.480 ± 0.025 2.254 ± 0.016 Pred count (mean) 2.606 ± 0.007 2.555 ± 0.027 2.374 ± 0.029 Supp lementary Table 7 | Perfor mance o f the presence-only CV AE model under five- fold cross-validation, reported as mean ± standard d eviation acr oss folds for each meal type . Metrics include classification fidelity (F 1 , precision, reca ll), calibration (AUROC, AUP RC, Brier), and quantitative agreement in predicted food counts (R², Bias). P resence thresholds denote optimal probability cut- offs per fol d, while “True” and “Pred count” indicate average numbers of foods per meal in ground -truth and model predictions, respectively. Meal Type Energy Fraction Energy Target (kcal) Description Breakfast 0.25 500 Represents 25% of daily 2000 kcal target Lunch 0.35 700 Represents 35% of daily 2000 kcal target Dinner 0.4 800 Represents 40% of daily 2000 kcal target Supp lementary Table 8 | Meal energy-fraction assignments used for RDI-per-k cal portioning. The fractional distribution of daily energy across breakfast, l unch, and d inner under a 2000 kcal pattern (0.25 / 0.35 / 0.40). These fractions are appli ed to both total caloric and per - kcal nutrient targets in the RDI-per-kcal optimization. The allocation reflects typical US DA dietary guidance and ensures that each ge nerated meal represents its proportional sh are of daily intake. Category / Subgroup Cap (g) Condition / Rule Rationale Total meal weight ≤ 900 per meal Limit total grams for realistic plate size Beverages (total) ≤ 25 % kcal or ≤ 300 / 350 / 350 g (B/L/D) per meal Avoid excessive beverage volumes Added sugars ≤ 12 g absolute Approx. 10 % kcal soft cap (per 2000 kcal diet) Fats / Oils ≤ 20 g absolute Prevent over-representation of oils/fats Condiments / Sauces ≤ 20 g absolute Maintain realistic side condiment levels Snacks / Sweets ≤ 60 g absolute Limit sweet or discretionary foods Solid food items (per item) ≤ 300 g per item Avoid unrealistic single-item servings Minimum # solid items 2 (B) / 3 (L) / 3 (D) per meal Ensure variety and realism Fluid dairy count as beverage – inclusion rule Included in beverage cap Supp lementary Table 9 | Group- and per -item gram caps enforced during RD I-per- kcal optimization. Gram-level caps and qu alitative rules used to bound mea l size, beverage volume, and individual component weights. These constraints prevent unrealistic portions w hile preserving dietary realism and nutrient feas ibility. Beverage energy is limited to ≤ 25 % of mea l kcal (300 / 350 / 350 g for breakfast, lunch and dinner), total meal mass is capped at ≤ 900 g, and per- item solids at ≤ 300 g. Additional limits on s ugars, fats/oils, condiments, and snacks constrain discretionary energy. All caps ar e enforced so ftly via proportional rescaling when totals exceed limits. Nutrient Default RDI RDI -per-kc al Weight (Under) wₖ Weight (Over) vₖ Constraint Type Energy (kcal) 2,000 1 2 2 Equality (fixed) Protein (g) 50 0.025 g/kcal 2 1.5 Adequacy Carbohydrate (g) 275 0.138 g/kcal 1.5 1.5 Adequacy Total Fat (g) 78 0.039 g/kcal 1.5 1.5 Adequacy Fiber (g) 28 0.014 g/kcal 2 1 Adequacy Sodium (mg) 2,300 1.15 mg/kcal 1 3 Upper bound Saturated Fat (g) 20 (10 % kcal) 0.010 g/kcal 1 3 Upper bound Added Sugars (g) 50 (10 % kcal) 0.025 g/kcal 1 3 Upper bound Potassium (mg) 4,700 2.35 mg/kcal 2 1 Adequacy Calcium (mg) 1,300 0.65 mg/kcal 2 1 Adequacy Iron (mg) 18 0.009 mg/kcal 2 1 Adequacy Vitamin D (µg / IU) 20 µg (800 IU) 0.010 µg/kcal 1.5 1 Adequacy Others (if present) 1 1 Neutral Supp lementary Table 10 | Nutrient weights and per-k cal target values used in RDI-per-kcal optimization. Nutrie nt- specific we ights (wₖ, vₖ) and normalized RDI -pe r-kcal targets us ed in the generator’s objective function. Weights e mphasize adequacy for key nutrients (energy, protein, fiber, potassium) and moderation for over-consumed ones (sodium, saturated fat , add ed sugars). RDI values correspond to FDA/USDA Dai ly Values for a 2 ,000 kcal reference diet. P er -kcal targets are scaled by meal -energy fraction s before optimization. Together, these p arameters guide the convex nutrient-anc hored portioning that yields ba lanced, guideline -consistent meals.
Original Paper
Loading high-quality paper...
Comments & Academic Discussion
Loading comments...
Leave a Comment