SciFlow-Bench: Evaluating Structure-Aware Scientific Diagram Generation via Inverse Parsing
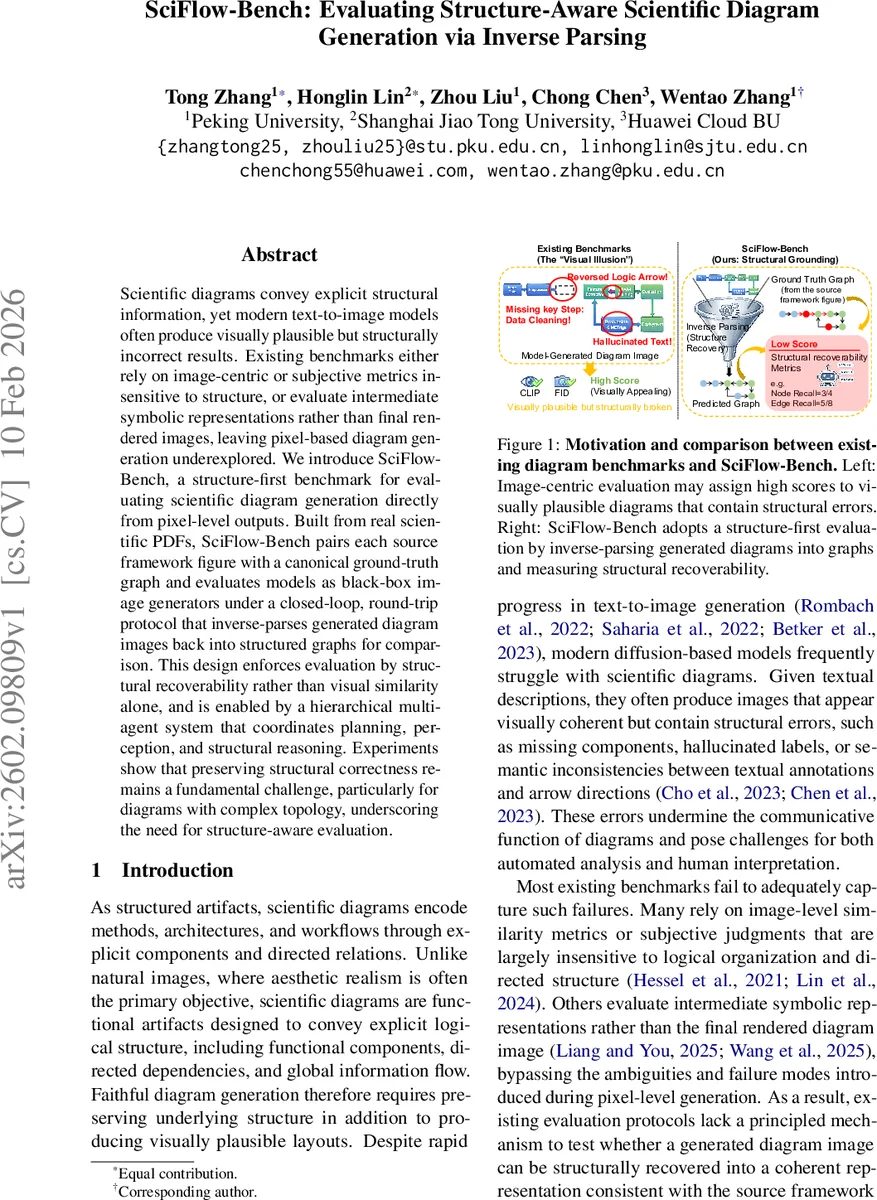
Scientific diagrams convey explicit structural information, yet modern text-to-image models often produce visually plausible but structurally incorrect results. Existing benchmarks either rely on image-centric or subjective metrics insensitive to structure, or evaluate intermediate symbolic representations rather than final rendered images, leaving pixel-based diagram generation underexplored. We introduce SciFlow-Bench, a structure-first benchmark for evaluating scientific diagram generation directly from pixel-level outputs. Built from real scientific PDFs, SciFlow-Bench pairs each source framework figure with a canonical ground-truth graph and evaluates models as black-box image generators under a closed-loop, round-trip protocol that inverse-parses generated diagram images back into structured graphs for comparison. This design enforces evaluation by structural recoverability rather than visual similarity alone, and is enabled by a hierarchical multi-agent system that coordinates planning, perception, and structural reasoning. Experiments show that preserving structural correctness remains a fundamental challenge, particularly for diagrams with complex topology, underscoring the need for structure-aware evaluation.
💡 Research Summary
SciFlow‑Bench addresses a critical gap in the evaluation of scientific diagram generation: existing benchmarks focus on image‑level similarity or on intermediate symbolic representations, ignoring whether a generated diagram faithfully preserves the underlying logical structure. The authors propose a “structure‑first” benchmark that evaluates text‑to‑image models directly on their pixel‑level outputs by measuring how well the generated image can be inverse‑parsed back into a structured graph that matches a ground‑truth graph derived from the original paper’s framework figure.
The benchmark is built from 500 real scientific figures extracted from 2025 arXiv papers across five domains (Computer Vision, NLP, Machine Learning Theory, Integrated Circuits, Robotics). For each figure, a canonical ground‑truth graph G* is automatically constructed using a hierarchical multi‑agent system (HMAS). HMAS consists of three layers:
-
Cognitive Planning – a Methodologist extracts method‑related text passages, and a Visual Translator converts them into a structured visual prompt that specifies components, relations, and style constraints.
-
Fine‑Grained Perception – three parallel agents (Environment Curator, Shape Hunter, Text Spotter) analyse either the source figure (during dataset construction) or a generated diagram (during evaluation). The Environment Curator infers global layout flow, Shape Hunter performs hierarchical segmentation to locate node regions, and Text Spotter applies OCR to capture textual labels. All outputs are written to a shared blackboard and merged by a Fusion Arbiter that resolves overlaps and grounds identities.
-
Structural Reasoning – a Topology Coder emits a Mermaid‑style intermediate representation, and a Graph Architect parses it into a concrete graph with nodes, directed edges, hierarchical groups, and layout metadata. This pipeline yields G* for the dataset and a predicted graph Ĝ for each generated image.
Evaluation proceeds in a closed‑loop “round‑trip” fashion: a model receives the structured visual prompt and generates an image I; the same HMAS pipeline inverse‑parses I into Ĝ; Ĝ is compared to G* using a suite of metrics. Graph‑level metrics compute node and edge precision, recall, and F1, with node matching based on textual similarity and fallback type matching. Text‑level metrics assess alignment with the original prompt and penalise hallucinated elements. Image‑level metrics (CLIP similarity, LPIPS, and a vision‑language model for arrow direction consistency) capture visual fidelity not explained by topology. The final leaderboard aggregates these scores, giving the highest weight to graph‑level correctness.
Human verification on 100 sampled figures shows the automated HMAS pipeline achieves high reliability (node F1 ≈ 0.91, edge F1 ≈ 0.71), confirming the feasibility of large‑scale automatic graph construction.
Experiments benchmark several state‑of‑the‑art diffusion models (e.g., SDXL, PixArt‑Σ) and code‑driven diagram generators. While these models attain high CLIPScore and low LPIPS (indicating good visual realism), their structural metrics drop dramatically on complex diagrams: edge F1 often falls below 0.45, with frequent errors such as missing components, reversed arrows, and incorrect hierarchical grouping. The gap widens with diagram complexity; low‑complexity figures see modest structural performance (≈ 0.7 F1), whereas high‑complexity ones suffer severe degradation.
The paper’s contributions are threefold: (1) introducing structural recoverability as the primary evaluation criterion, exposing a “visual illusion” where aesthetically pleasing outputs are structurally broken; (2) providing a fully automated, reproducible benchmark pipeline that constructs ground‑truth graphs and performs inverse parsing using the same multi‑agent system; (3) empirically demonstrating a pronounced decoupling between visual fidelity and structural reasoning, especially for diagrams with rich topology.
Limitations include residual errors in the inverse‑parsing stage (OCR failures, difficulty handling complex mathematical symbols) and the focus on 2‑D static diagrams, leaving 3‑D or interactive scientific visualisations unaddressed. Future work may improve parsing accuracy, integrate structure‑aware pre‑training for generation models, and extend the framework to support user‑defined evaluation metrics as plug‑ins.
Overall, SciFlow‑Bench establishes a rigorous, structure‑centric benchmark that pushes the community toward generating scientifically useful diagrams rather than merely photorealistic images.
Comments & Academic Discussion
Loading comments...
Leave a Comment