A Multiliteracy Model for Interactive Visualization Literacy: Definitions, Literacies, and Steps for Future Research
This paper presents a theoretical model for interactive visualization literacy to describe how people use interactive data visualizations and systems. Literacies have become an important concept in describing modern life skills, with visualization literacy generally referring to the use and interpretation of data visualizations. However, prior work on visualization literacy overlooks interaction and its associated challenges, despite it being an intrinsic aspect of using visualizations. Based on existing theoretical frameworks, we derive a two-dimensional model that combines four well-known literacies with five novel ones. We found evidence for our model through analyzing existing visualization systems as well as through observations from an exploratory study involving such systems. We conclude by outlining steps towards measuring, evaluating, designing for, and teaching interactive visualization literacy.
💡 Research Summary
The paper addresses a notable gap in the visualization literature: while visualization literacy (VL) has been widely studied, most existing work focuses on static visualizations and neglects the interactive dimension that is intrinsic to modern data analysis tools. To fill this void, the authors propose a comprehensive definition of Interactive Visualization Literacy (IVL) as the ability to explore data through interactive visualizations, engaging with data at multiple abstraction levels in an iterative cycle of goal formulation, interaction, and evaluation.
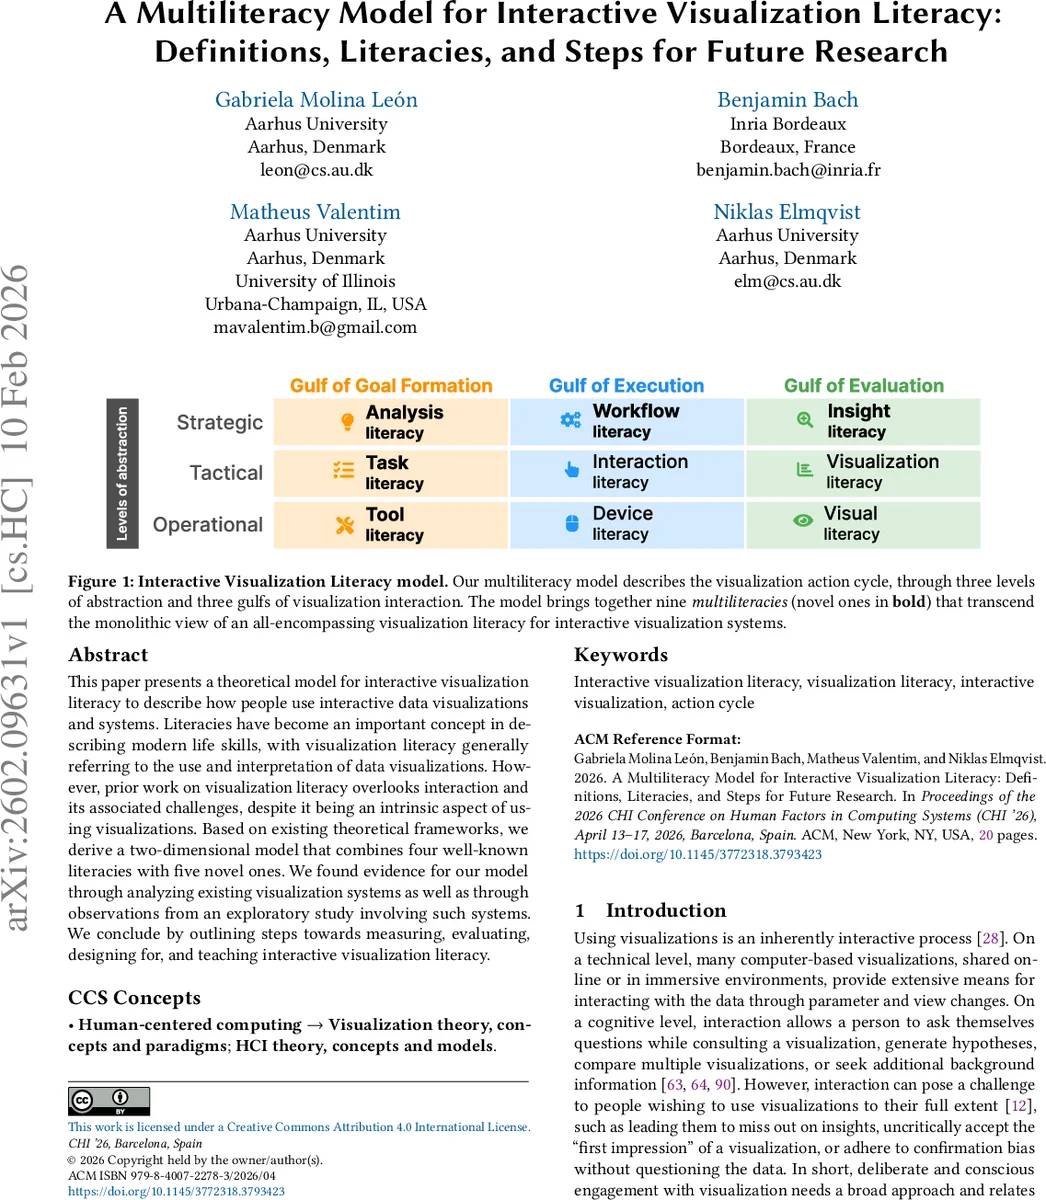
Building on Norman’s human‑action cycle, Lam’s interaction‑cost framework, and the multiliteracies concept from education theory, the authors construct a two‑dimensional 3 × 3 model. One axis captures three Levels of Abstraction—Gulf of Execution, Gulf of Goal Formation, and Gulf of Evaluation—representing the stages where users recognize possible actions, set analytical goals, and interpret outcomes. The other axis represents three “gulfs” (execution, evaluation, goal formation) that denote gaps between user intent and system response. The intersection of these axes yields nine distinct “multiliteracies”: four well‑established (Visualization, Insight, Workflow, Interaction) and five newly articulated (Device, Analysis, Task, Tool, Work) literacies. Each literacy corresponds to a concrete skill set, such as interpreting visual encodings (Visualization Literacy), generating novel insights from interaction (Insight Literacy), or mastering input hardware (Device Literacy).
To validate the model, the authors adopt a dual approach. First, they map existing systems from data‑driven storytelling, visual analytics, and immersive/multimodal analytics onto the nine literacies, revealing that most commercial tools explicitly support only a subset (typically 4‑6) while users implicitly draw on the remaining literacies during real‑world use. Second, they conduct an exploratory observational study with nine participants who interact with a selection of these systems. Qualitative analysis of think‑aloud protocols and post‑session interviews shows participants continuously shifting among the nine literacies, especially leveraging Analysis and Work literacies to bridge the Gulf of Goal Formation.
The paper culminates in a research agenda comprising four interrelated thrusts: (i) Assessment – extending existing VL tests with interaction‑centric tasks, metrics for execution latency, error types, and insight generation; (ii) Evaluation – quantifying the relationship between interaction costs (the three gulfs) and specific literacies to identify which skills most effectively reduce cognitive load; (iii) Design – providing design guidelines that embed literacy support (e.g., affordance cues for execution, goal‑setting scaffolds, feedback loops for evaluation) and proposing adaptive interfaces that surface the appropriate literacy support on demand; (iv) Education – integrating IVL into curricula through hands‑on labs, reflective metacognitive exercises, and diagnostic tools that let learners self‑assess their literacy profile.
Overall, the work reframes interactive visualization users as “multiliterate” agents, offering a structured lens to understand the diverse competencies required for effective data exploration. By articulating a clear model, empirical validation, and a concrete roadmap, the paper lays a solid foundation for future research on measuring, evaluating, designing for, and teaching interactive visualization literacy.
Comments & Academic Discussion
Loading comments...
Leave a Comment