RAPID: Risk of Attribute Prediction-Induced Disclosure in Synthetic Microdata
Statistical data anonymization increasingly relies on fully synthetic microdata, for which classical identity disclosure measures are less informative than an adversary's ability to infer sensitive attributes from released data. We introduce RAPID (R…
Authors: Matthias Templ, Oscar Thees, Roman Müller
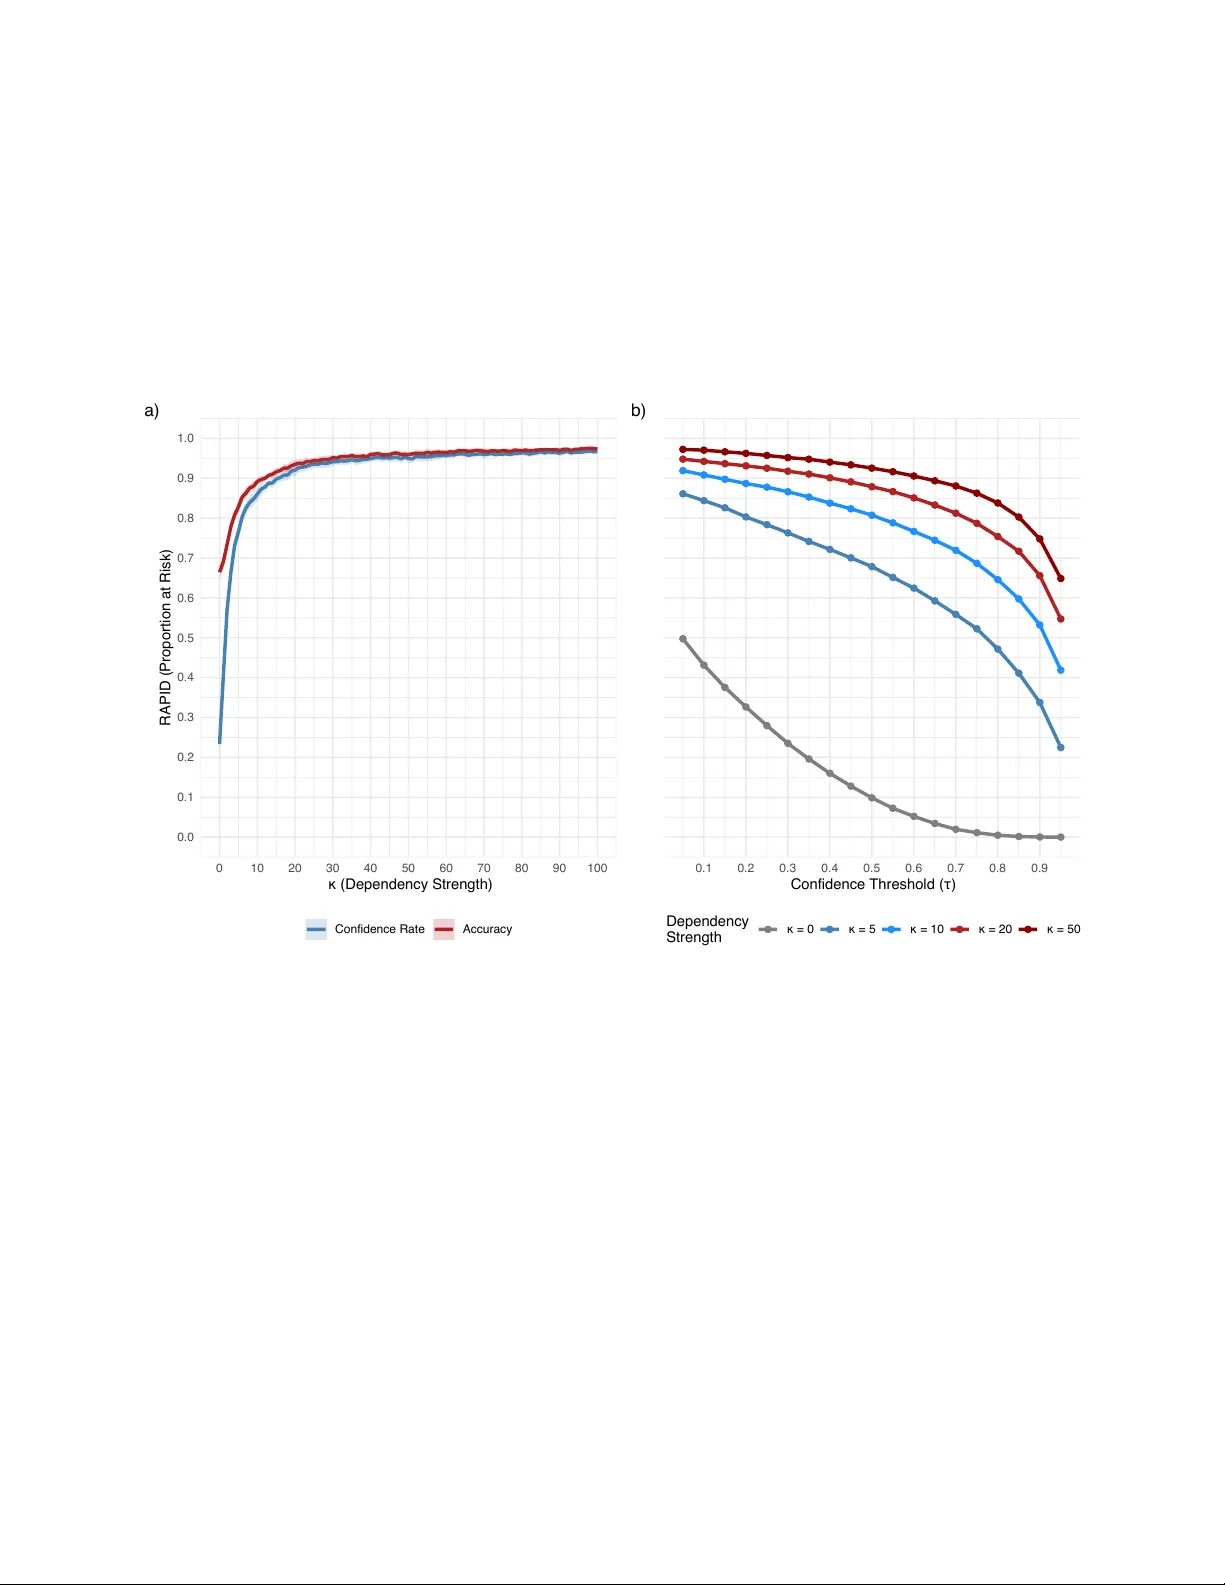
RAPID: Risk of A ttribute Prediction-Induced Disclosure in Syn thetic Micro data Matthias T empl ∗ † Oscar Thees † Roman Müller † Abstract Statistical data anon ymization increasingly relies on fully synthetic microdata, for whic h classical identit y disclosure measures are less informative than an adv ersary’s ability to infer sensitiv e attributes from released data. W e in tro duce RAPID (Risk of A ttribute Prediction–Induced Disclosure), a disclosure risk measure that directly quan tifies inferential vulnerability under a realistic attack mo del. An adversary trains a predictive mo del solely on the released synthetic data and applies it to real individuals’ quasi-iden tifiers. F or contin uous sensitiv e attributes, RAPID rep orts the prop ortion of records whose predicted v alues fall within a specified relativ e error tolerance. F or categorical attributes, we prop ose a baseline-normalized confidence score that measures ho w muc h more confiden t the attack er is ab out the true class than would b e exp ected from class prev alence alone, and w e summarize risk as the fraction of records exceeding a p olicy-defined threshold. This construction yields an in terpretable, b ounded risk metric that is robust to class imbalance, indep enden t of any sp ecific synthesizer, and applicable with arbitrary learning algorithms. W e illustrate threshold calibration, uncertain ty quantification, and comparative ev aluation of syn thetic data generators using sim ulations and real data. Our results sho w that RAPID provides a practical, attack er-realistic upp er b ound on attribute-inference disclosure risk that complements existing utility diagnostics and disclosure control frameworks. Keyw ords: synthetic data, disclosure risk, attribute inference, statistical disclosure control, priv acy 1 In tro duction Op en researc h data (ORD) are increasingly recognized as essential for scientific transparency and repro ducibilit y [Nosek et al., 2015]. Y et the prop ortion of shared datasets remains low: for instance, only 23% of pro jects funded b y the Swiss National Science F oundation currently provide ORD [Swiss National Science F und (SNSF), 2024]. Legal constraints and contractual usage restrictions often hinder the release of micro data, while technical barriers to anonymization remain substantial for many research teams. F ully synthetic micro data [Rubin, 1993] – datasets in which all records are simulated rather than p erturbed copies of real individuals – offer a promising solution to this problem. Ho wev er, syn thetic data also raise an immediate question for data stew ards: ho w should disclosure risk b e quantified when the primary threat is no longer re-identification, but an adversary’s abilit y to infer sensitiv e attributes from the released data? 1.1 The user p ersp ectiv e: data utility F rom the user’s p ersp ectiv e, syn thetic data must satisfy tw o core requiremen ts: statistical similarity to the original data and structural plausibility . Bey ond repro ducing marginal distributions and asso ciations, synthetic data m ust resp ect domain-sp ecific constraints – such as realistic household comp ositions, non-negative exp enditures (e.g., on medication), internally consistent demographic characteristics (e.g., no underage individuals with adult c hildren), and v alid even t sequences (e.g., a PhD obtained after a master’s degree). Violations of such constraints can severely limit the credibility and usabilit y of synthetic datasets, ev en when distributional similarity is high. Figure 1 illustrates a general w orkflow for generating synthetic data and assessing its fitness for use. Analysts t ypically aim to (i) answer predefined research questions b y fitting statistical or machine learning mo dels and (ii) explore the data to identify new patterns and relationships. These ob jectiv es are attainable only when the syn thetic data approximate the original data not merely in distribution, but also in structure. ∗ Corresponding author: matthias.templ@fhnw.c h † School of Business, Universit y of Applied Sciences and Arts Northw estern Switzerland (FHNW), Olten, Switzerland 1 Synthetic Data Generator Acceptable Risk and Data Utility? Original Data Synthetic Data generate fit no yes Result of Analysis Data User recalibrate release data edit analyse Figure 1: Syn thetic data generation and ev aluation workflo w. Original data is used to train a synthetic data generator, which pro duces synthetic records. These records are ev aluated for priv acy risk and statistical utility . If acceptable, the syn thetic data is released to data users for analysis; otherwise, the generator is recalibrated or the data is edited. Ho wev er, high analytical utility alone do es not guarantee safe data release. F rom the data provider’s p erspective, increasing utility often en tails preserving strong dep endencies among v ariables – precisely the information that ma y enable an adv ersary to infer sensitive attributes. Disclosure risk therefore does not necessarily decrease as syn thetic data b ecome more useful; in fact, it may increase. In practice, this tension is commonly conceptualized using Risk – Utility (R U) maps [Duncan et al., 2001] and more recent multiv ariate extensions [Thees et al., 2025], whic h supp ort informed decisions ab out acceptable trade-offs b et ween analytical v alue and disclosure protection. Assessing inference disclosure risk in a wa y that is commensurate with mo dern, high-utilit y synthetic data remains a key metho dological challenge. 1.2 Ov erview of syn thetic data generation metho ds Since Rubin [1993] introduced syn thetic data as sim ulated draws from predictiv e distributions, a v ariety of generation metho ds hav e emerged. Conditional mo deling approac hes synthesize v ariables sequentially , with each v ariable generated conditional on those already pro duced; implemen tations such as synthpop [Now ok et al., 2016] and simP op [T empl et al., 2017] use tree-based metho ds, regression, or other learners. Joint mo deling approac hes, including GANs and deep generative models, attempt to capture the full joint distribution sim ultaneously but require large datasets, careful tuning, and substantial computational resources [Mekonnen, 2024, Miletic and Sariy ar, 2024], and may struggle with complex tabular structures [Thees et al., 2024, W ard et al., 2025]. Crucially , the same fidelity that makes synthetic data analytically useful also preserves the predictiv e relationships that enable attribute inference attacks. High-utilit y syn thesis faithfully repro duces cov ariate – outcome asso ciations; an attac ker can exploit these asso ciations to infer sensitive attributes from quasi-identifiers. This tension b et ween utility and priv acy motiv ates the measure we prop ose. While this pap er fo cuses on syn thetic data, the inferential disclosure risk framework applies equally to traditionally anonymized data or any released dataset: given the release, how accurately can an adversary infer sensitiv e attributes from quasi-identifie rs? 1.3 Disclosure risk measures Classical statistical disclosure control (SDC) distinguishes (i) identit y disclosure (i.e., linking a record to a sp ecific individual); (ii) attribute disclosure (i.e., correctly learning sensitive v alues); and (iii) membership disclosure (i.e., learning whether an individual’s data is part of a dataset) [Hundep o ol et al., 2012]. F or fully synthetic micro data, identit y disclosure risk is typically lo w [T empl, 2014, El Emam et al., 2020], as synthetic records are not literal representations of individuals. As a result, most attention shifts tow ard analytical v alidity and attribute disclosure risk. Existing attribute-disclosure diagnostics. Existing attribute-disclosure diagnostics fall into t wo broad categories: • Matc h-based measures, which ev aluate how often synthetic v alues exactly match original v alues [T aub et al., 2018]. Examples include DiSCO [Raab et al., 2025], whic h flags records as at-risk when a quasi-identifier com bination in the original data app ears in the synthetic data with the same sensitive v alue. Suc h approac hes are transparent and integrate naturally with classical SDC concepts, but they may b e sensitive to class imbalance and do not directly mo del the inference pro cess. 2 • Mo del-based measures, which train a predictiv e mo del on syn thetic data and assess its p erformance on the original data. Hittmeir et al. [2020] prop osed comparing prediction accuracy against a baseline that represents the attac ker’s prior kno wledge (e.g., marginal class frequencies), thereby quan tifying the additional risk introduced b y the syn thetic release. This baseline-comparison principle – measuring ho w m uch b etter an attack er can do with the released data than without it – is central to the approac h w e dev elop in this pap er. A ttack er scenario. F or mo del-based measures, the threat mo del assumes an attack er who trains a predictiv e mo del on the released syn thetic data and applies it to individuals whose quasi-iden tifiers are known. Figure 2 illustrates this scenario. If a mo del trained solely on synthetic data can reliably predict confidential attributes in the real data, the syn thetic release carries priv acy risk [T aub et al., 2018, Barrientos et al., 2018, Kw atra and T orra, 2024]. Inferen tial disclosure. The risk measure prop osed here fo cuses on inferential disclosure risk – also referred to as predictive disclosure [Willen b org and de W aal, 2001] – which o ccurs when the publication of micro data enables more accurate or more confiden t inferences ab out sensitive attributes than would hav e b een p ossible without the release [Duncan and Lambert, 1989, Hundep ool et al., 2012]. This concept builds on Dalenius’s foundational definition: “If the release of the statistic S mak es it p ossible to determine the v alue [of a sensitive attribute] more accurately than is p ossible without access to S , a disclosure has taken place. ” [Dalenius, 1977, p. 432] Imp ortan tly , inferential disclosure can affect individuals who were not part of the original dataset and may concern information of which the affected individual is not ev en aw are. F or example, if the released data reveal a strong asso ciation b et ween lifestyle indicators and disease risk, an attac ker could infer elev ated risk for a similar individual outside the dataset. Although eliminating inferential disclosure entirely would require destroying all meaningful relationships b et w een sensitive and non-sensitive v ariables [Dwork and Naor, 2010], we argue that inferential risk warran ts increased attention in the era of big data and artificial intelligence. Mühlhoff [2021] notes that predictive priv acy is violated when sensitive information is statistically estimated against an individual’s will, provided that these predictions lead to differential treatment affecting their wellbeing or freedom. The need for record-lev el assessment. While existing mo del-based measures typically provide aggregate, dataset-level risk summaries, we argue that record-lev el assessment is essential for targeted risk mitigation. Iden tifying which sp ecific individuals face elev ated disclosure risk enables data custo dians to apply selective protections rather than uniform measures that may unnecessarily degrade utility . This motiv ates our prop osed measure, RAPID, which w e introduce after discussing the role of differential priv acy . 1.4 Differen tial priv acy and attribute inference A natural question is whether differential priv acy (DP) already addresses the disclosure risks w e aim to measure. W e argue that DP and RAPID address complementary concerns. Differen tial priv acy [Dwork et al., 2006] provides a formal guarantee of output stability: the probability of an y particular output changes by at most a multiplicativ e factor exp ( ε ) when a single individual’s data is added to or remov ed from the dataset [Domingo-F errer et al., 2021]. This guaran tee is indep enden t of the in truder’s bac kground knowledge and do es not rely on assumptions ab out data distributions or attac ker capabilities. Crucially , DP do es not claim that an attack er cannot learn sensitive information ab out an individual. Rather, it guarantees that the attac ker’s information gain is essentially the same whether or not a sp ecific individual’s data are included in the dataset [Muralidhar and Ruggles, 2024]. The rationale is that if inclusion do es not matter, then no individual-sp ecific priv acy breach can o ccur. This makes DP particularly effective at preven ting memb ership infer enc e attacks , where the adversary tries to determine whether a sp ecific individual was present in the training data. Ho wev er, attribute infer enc e attacks exploit a differen t mechanism. Rather than asking “W as this p erson in the dataset?”, the attack er asks “What is this p erson’s sensitive attribute, giv en the released data and what I kno w ab out them?” DP do es not directly limit the accuracy of such inferences, b ecause the risk stems from p opulation-lev el patterns that the data preserve, not from any individual’s participation. If strong correlations 3 exist in the p opulation – e.g., b et ween age, education, and disease status – then data released under DP (or an y other anonymization method) may still enco de those relationships, enabling accurate attribute inference [Blanco-Justicia et al., 2022, Muralidhar and Domingo-F errer, 2023]. This limitation is not unique to DP . T raditional anonymization metho ds face the same fundamen tal tension: preserving analytical utility requires preserving statistical relationships, but those same relationships enable inferen tial attac ks. The question of whether releasing data increases an attack er’s ability to infer sensitive attributes – relative to what could b e inferred from background knowledge alone – applies regardless of the anon ymization technique used. Moreov er, DP faces a practical dilemma: stringent priv acy guarantees (small ε ) require noise lev els that can render outputs analytically useless, while relaxed guarantees (large ε ) offer little meaningful protection [Domingo-F errer et al., 2021]. F or this reason, DP (and anonymization more broadly) should b e complemented with explicit, scenario-based disclosure risk assessments that directly measure attribute-inference vulnerability . As Domingo-F errer et al. [2025] argue, empirical disclosure risk assessmen t remains as unav oidable for synthetic or DP-protected data as it was under traditional utility-first approac hes. RAPID addresses this need by quantifying how accurately an attack er could infer sensitive attributes from the released data, providing a practical complement to formal priv acy guarantees. Relation to membership disclosure and DP baselines. Recen t work on memb ership disclosur e situates attribute-inference risk within a differential priv acy framework b y comparing tw o anonymized datasets that differ only in the presence of a single individual – a “member” and a “non-member” version – and measuring the marginal improv emen t in inference accuracy when the individual is included [e.g., F rancis and W agner, 2025]. These approaches aim to quantify p er-person privacy loss due to inclusion , grounded in DP’s stability guaran tee. RAPID addresses a different question. While membership-based ev aluations focus on individual-level stability (“Do es my inclusion c hange the risk?”), RAPID fo cuses on p opulation-level vulnerability (“How often could an attack er b e confidently correct?”). Both approac hes contribute to understanding disclosure risk, but they serv e distinct purp oses: mem b ership-fo cused metho ds are suited to certifying DP-style guarantees, while RAPID supp orts practical risk–utility assessment for public-use data releases. What RAPID is and is not. T o av oid misin terpretation, we state explicitly what RAPID provides and what it do es not claim. RAPID is a scenario-based, attack er-realistic, empirical diagnostic that quantifies realized inferential vulnerability under a sp ecified predictive mo del. It measures how often an attack er could confidently infer sensitive attributes from released data, conditional on the predictive structure those data preserve. RAPID is not a formal priv acy guaran tee, a differen tial priv acy analogue, or a worst-case b ound. Rather, RAPID complements formal guarantees b y offering transparent, actionable risk assessment that supp orts informed release decisions – answ ering the practical question of whether released data enable inference attac ks that data custo dians would consider unacceptable. 1.5 Con tributions This pap er makes the following contributions. 1. A new disclosure risk measure under a realistic threat mo del. W e prop ose RAPID (Risk of A ttribute Prediction–Induced Disclosure), a measure of attribute-inference disclosure risk for anonymized micro data, with a fo cus on fully synthetic data. RAPID quantifies the prop ortion of records for which an attac ker can confidently infer sensitive attributes. Unlike differential priv acy , which pro vides a worst-case b ound on how muc h an individual’s inclusion can influence the released data, RAPID measures how often inference succeeds across the released dataset – a practical summary of disclosure vulnerability that data custo dians can directly interpret and compare. Our threat mo del assumes an intruder who has access only to the released data and to quasi-identifiers of target individuals, but no auxiliary sample of real data for v alidation or calibration. This reflects the conditions faced by external analysts of public-use files and av oids the practical limitations of holdout-based ev aluations, whose conclusions dep end heavily on holdout size and representativ eness [Hittmeir et al., 2020, Platzer and Reutterer, 2021]. When ev aluating risk, the data custo dian adopts a conserv ativ e worst-case assumption: that the attack er knows the quasi-identifiers of all individuals in the original dataset (but 4 not their sensitive attributes). RAPID then quantifies how often the attack er could successfully infer those attributes using only the released synthetic data. This worst-case framing means that if RAPID indicates acceptable risk, the risk is acceptable for any realistic attack er who knows fewer individuals. Whether these risk estimates generalize b eyond the original sample to a broader p opulation is a question of representativ eness – a consideration common to all empirical analyses, not a limitation specific to RAPID. RAPID directly op erationalizes the attack er’s ob jective: confiden tly inferring sensitive attributes of real individuals using mo dels trained solely on the released data. This prediction-based vulnerability corresp onds to infer ential disclosur e in the classical SDC taxonom y [Duncan and Lam b ert, 1989, Hundep ool et al., 2012]. (See Section 2.) 2. Baseline-normalized confidence scoring for categorical attributes. W e introduce a normalized gain measure that compares an attac ker’s predicted probability for the true class to a baseline determined b y class prev alence in the original data (cf. Slok om et al., 2022). This yields a calibrated notion of c onfidenc e b eyond chanc e that explicitly accounts for class imbalance and av oids o verstating risk in skew ed distributions. By fo cusing on confidence-adjusted correctness rather than ra w accuracy , RAPID captures the extent to which released data enable me aningful inference ab out sensitiv e attributes. (See Section 2.2 and Section 3.) 3. A unified framew ork for categorical and contin uous sensitive attributes. RAPID pro vides a consisten t formulation for b oth discrete and contin uous confidential v ariables. F or categorical attributes, inference risk is quantified via baseline-normalized prediction confidence; for contin uous attributes, it is defined through tolerance-based relative prediction error. This unified framework allows inference risk to b e assessed consistently across v ariable types without discretizing contin uous outcomes, introducing arbitrary binning, or requiring counterfac tual datasets that compare member versus non-member scenarios. (See Sections 2.2 – 2.3 and Section 3.) 4. Threshold-based, p olicy-in terpretable risk summaries. By summarizing disclosure risk as the prop ortion of records exceeding a confidence or accuracy threshold, RAPID yields interpretable, b ounded metrics that are easy to communicate and tunable to institutional or regulatory risk tolerances. This form ulation aligns naturally with risk–utility decision frameworks commonly used in statistical disclosure con trol and supp orts consistent comparison across different synthesizers, parameter settings, and data releases. (See Algorithm 1 and Section 2.6.) 5. Record-lev el risk indicators enabling diagnostic analysis. Although RAPID rep orts an aggregate disclosure metric, it is constructed from p er-record risk indicators. This design enables granular analyses of inference vulnerability , including the identification of high-risk records, subgroup-sp ecific risk patterns, and com binations of quasi-identifiers that disprop ortionately con tribute to disclosure risk. These record-level signals help data curators understand the drivers of risk and apply targeted mitigation strategies. (See Section 5.5 and Figure 5.) 6. Empirical v alidation and robustness analysis. Through simulation studies and real-data illustrations, w e demonstrate ho w RAPID scales with dependency strength betw een quasi-identifiers and sensitive attributes, how threshold choice affects risk classification, and how results remain stable across a range of attack er mo dels. W e also show ho w RAPID can b e combined with holdout-based assessments when auxiliary real data are av ailable, supp orting internal b enc hmarking without altering the core threat mo del. (See Sections 4 and 5.) 7. Op en-source implementation. RAPID is implemen ted in R and integrates with existing synthetic data generation pip elines. The implementation supp orts multiple attack er mo dels, b o otstrap confidence in terv als, and diagnostic outputs. By fo cusing on p opulation-lev el vulnerability rather than p er-individual priv acy loss, RAPID complements formal priv acy frameworks suc h as differen tial priv acy and is particularly suited to ev aluating public-use micro data releases. (See Section 3.1). 1.6 Motiv ating example T o illustrate the inference threat RAPID addresses, we conducted a simple attack exp erimen t. Using the eusilc public-use file – a close-to-reality syn thetic p opulation based on the Europ ean Union Statistics on Income and Living Conditions (EU-SILC), which contains complex household structures and a rich set of demographic and 5 so cioeconomic v ariables [Alfons et al., 2011] – we generated a fully synthetic dataset with synthpop [No wok et al., 2016]. W e then trained random forest mo dels [W righ t and Ziegler, 2017] on the synthetic data to predict t wo sensitive attributes: the categorical v ariable marital_status and the con tinuous v ariable income . Applying these synthetic-trained mo dels to real cov ariate v alues reveals meaningful disclosure risk. F or marital_status , the classifier achiev ed 82% accuracy on real data despite never seeing true lab els during training. F or income , many predictions fell close to true v alues, indicating that an attac ker could approximate real incomes within a practically relev an t range. This exp erimen t demonstrates that standard metrics like accuracy or mean squared error, while useful for ev aluating predictive performance, do not adequately characterize disclosure risk. They ignore the attack er’s c onfidenc e in correct predictions, are sensitive to class imbalance, and provide no p olicy-in terpretable threshold. These limitations motiv ate the formal developmen t of RAPID in the following section, which provides a unified framew ork for b oth categorical and con tinuous sensitive attributes. 2 The RAPID measure This section formalizes RAPID (Risk of A ttribute Prediction–Induced Disclosure). Recall that our threat mo del assumes an attack er who trains a predictive mo del on the released data and applies it to individuals whose quasi-iden tifiers are known (cf. Figure 2). RAPID quantifies ho w often suc h an attack er can make c onfidently c orr e ct inferences ab out a sensitive attribute. The key idea is to compare the attac ker’s prediction performance against a baseline that ignores quasi- iden tifiers entirely . F or categorical attributes, this baseline is the marginal frequency of each class in the original data – the probability an attack er would assign to the correct class by simply knowing class prev alences without using any quasi-identifier information. F or con tinuous attributes, the baseline is a reference prediction error. A record is flagged as at-risk only when the attack er’s p erformance substantially exceeds this baseline, ensuring that RAPID captures gen uine information leakage rather than artifacts of class imbalance or distributional prop erties. 2.1 Setup and notation Let the original micro data b e denoted by Z = [ X Q , X U , y ] , where X Q ∈ R n × p Q represen ts quasi-identifiers kno wn to an attack er, X U ∈ R n × p U denotes additional attributes not av ailable to the attack er, and y ∈ R n is the confidential sensitive attribute. The released (e.g., synthetic) dataset is Z ( s ) = [ X ( s ) Q , X ( s ) U , y ( s ) ] . An attack er observes the released data Z ( s ) together with quasi-identifiers X Q of target individuals (e.g., from external sources), but has no access to X U or y . The attack er trains a predictive mo del M on ( X ( s ) Q , y ( s ) ) to obtain parameter estimates ˆ Θ ( s ) , then applies this mo del to X Q to pro duce predictions ˆ y of the sensitive attribute. F or notational simplicity , we write Z = [ X , y ] , where X denotes quasi-identifiers, since X U pla ys no role in risk estimation. By default, we ev aluate risk across all n records in the original data. How ever, RAPID’s record-lev el design allows risk assessment for an y target set – a specific subp opulation, a sample, or even individuals not in the original data whose quasi-identifiers are known. Figure 2 illustrates this threat mo del from a data custo dian’s viewp oin t. 2.2 RAPID for a categorical sensitiv e attribute When y is categorical, we define risk in terms of the mo del-assigned probability to the true class lab el. F or each record i , the attack er’s mo del assigns probability g i = Pr( ˆ y i = y i | x i , ˆ Θ ( s ) ) 6 Data Custodian SDG Generate Original Data Quasi IDs - Age ___ - Zip code ... Sensitive Attribute - Income - Disease ... Synthetic Data Quasi IDs Sensitive Attribute - Income - Disease ... Adversary T rains model: Infers sensitive attribute: Released External Information - Public DBs - QIs ______ ... - Age ___ - Zip code ... Uses Figure 2: Inferential disclosure threat mo del. A data custo dian releases synthetic data [ X s , y s ] generated from original data containing quasi-identifi ers ( X ) and a sensitive attribute ( y ). An adversary with access to the released synthetic data and external knowledge of individuals’ quasi-identifiers ( ˜ X , whic h may or may not include individuals from the original sample) trains a predictive mo del to infer sensitive attributes. 7 to the true class y i . T o ev aluate whether this confidence is unusually high, we compare it against a baseline b i defined as the marginal prop ortion of class y i in the original data: b i = 1 n n X j =1 I ( y j = y i ) This baseline represents the prediction confidence achiev able by simply guessing according to the marginal class distribution, without using any quasi-iden tifier information. W e use the original marginals (rather than synthetic marginals) to ensure a meaningful, consistent baseline: RAPID measures impro vemen t ov er the true p opulation rates, not ov er p oten tially distorted syn thetic marginals. This makes risk estimates comparable across different syn thesizers and av oids conflating p o or marginal preserv ation with low disclosure risk. W e compute a normalized gain score, r i = g i − b i 1 − b i that measures the improv ement in prediction confidence o ver baseline, normalized by the maximum p ossible impro vemen t (reaching p erfect confidence g i = 1 ). The score satisfies: • r i < 0 : mo del p erforms worse than baseline • r i = 0 : mo del p erforms at baseline (no information gain) • 0 < r i < 1 : partial information gain from quasi-identifiers • r i = 1 : p erfect prediction (complete disclosure) A record is considered at risk if r i > τ , where τ ∈ (0 , 1) is a p olicy-defined threshold. W e recommend τ = 0 . 3 as a default, meaning a record is flagged when the attack er ac hieves at least 30% of the maximum p ossible impro vemen t o ver baseline. This threshold balances sensitivity (detecting meaningful inference gains) with sp ecificit y (av oiding false p ositiv es from minor improv emen ts); Section 5 provides empirical guidance on threshold selection. The categorical RAPID metric is then: RAPID cat ( τ ) = 1 n n X i =1 I ( r i > τ ) represen ting the prop ortion of records for which the released data enable inference substan tially b etter than the baseline rate. 2.3 RAPID for a contin uous sensitiv e attribute When the confidential attribute y is contin uous, we assess whether the mo del prediction ˆ y i is sufficiently close to the true v alue y i . This is op erationalised via a prediction error e i , whic h is compared to a fixed global threshold ε . A record i is considered at risk if at-risk i = I ( e i < ε ) , where ε is a fixed tolerance level reflecting how close a prediction must b e to the true v alue to constitute a disclosure risk. Sev eral error metrics can b e used, dep ending on the application con text. T able 1 summarises suitable ch oices. Imp ortan tly , all prop osed error measures are dimensionless and comparable, such that a single threshold ε can b e applied consistently across all records and v ariables. In all cases, the contin uous RAPID metric is: RAPID cont ( ε ) = 1 n n X i =1 I ( e i < ε ) represen ting the prop ortion of records where predictions fall within the sp ecified error tolerance. Note that while aggregate error metrics (MAE, RMSE) are insufficient for disclosure assessmen t – as they do not identify whic h records are at risk – they can inform the choice of ε by characterizing t ypical prediction accuracy . 8 T able 1: Error metrics for contin uous sensitiv e attributes. Records are flagged as at risk if e i < ε , where ε is a user-sp ecified threshold. The smo othing constant δ > 0 prev ents division by zero (default: δ = 0 . 01 , or scaled to the data range). Error metric e i Description, usage, and examples Symmetric relativ e error (de- fault) 2 | y i − ˆ y i | | y i | + | ˆ y i | + 2 δ Robust to scale, accounts for b oth true and predicted v alues in error calculation. Example: F or income data with ε = 0 . 05 (5%), a record with true income $50,000 and predicted income $52,000 has error ≈ 3 . 9% and is flagged as at risk. U se when: Default c hoice for p ercen tage-based error measure- men t. Stabilised relative error | y i − ˆ y i | | y i | + δ Simpler formula than symmetric. Pro duces similar results for most v alues but larger errors for very small true v alues. Example: F or income data with ε = 0 . 10 (10%), a record with true income $500 and predicted income $450 has error ≈ 10% and is at risk. U se when: T raditional in some fields or when simpler formula is preferred. Absolute error | y i − ˆ y i | No p ercen tage interpretation; errors measured in original units of y . Threshold ε must b e on the same scale. Example: F or age data with ε = 2 years, a record with true age 65 and predicted age 66 has error 1 year and is flagged as at risk. U se when: The meaningful threshold is "within X units" rather than "within X%" (e.g., age within 2 years, temp erature within 1 ° C, dates within 7 days). 9 2.4 Computation Algorithm 1 formalizes the RAPID ev aluation proto col: train a predictive mo del on the released data, apply it to target quasi-identifiers, compute p er-record risk scores, and aggregate to obtain RAPID. Algorithm 1 RAPID Ev aluation Proto col Require: Original data Z = [ X , y ] ; released data Z ( s ) Require: Thresholds τ ∈ (0 , 1) (categorical; default τ = 0 . 3 ) and ε > 0 (contin uous; default ε = 10% ) 1: Fit predictiv e mo del M on Z ( s ) to obtain ˆ Θ ( s ) 2: Compute predictions ˆ y = M ( X ; ˆ Θ ( s ) ) 3: for i = 1 , . . . , n do 4: if y is categorical then 5: g i ← Pr( ˆ y i = y i | x i ) 6: b i ← n − 1 P n j =1 I ( y j = y i ) 7: r i ← ( g i − b i ) / (1 − b i ) 8: I i ← I ( r i > τ ) 9: else 10: e i ← 2 | y i − ˆ y i | / ( | y i | + | ˆ y i | + 2 δ ) 11: I i ← I ( e i < ε ) 12: Output: record-level risks { r i } or { e i } , indicators { I i } , and RAPID ← 1 n n X i =1 I i RAPID is thus an empirical estimate of the probability that a randomly selected record is sub ject to successful attribute inference under the sp ecified attack er mo del. When ev aluating multiple mo dels M ∈ S , rep ort b oth the av erage and conserv ativ e env elop e: RAPID ( · ) = 1 |S | X m ∈S RAPID ( m ) ( · ) , RAPID max ( · ) = max m ∈S RAPID ( m ) ( · ) 2.5 Implemen tation considerations RAPID is applicable to any algorithm pro ducing class probabilities or p oin t predictions. T o reflect a strong attac ker, we recommend ev aluating p o werful learners (e.g., random forests, gradient b oosting) and rep orting the maximum observ ed risk. When multiple released datasets are av ailable, risk can b e a veraged across them or rep orted as the worst-case v alue, dep ending on desired conserv ativ eness. Thresholds τ and ε should reflect p olicy requirements; we recommend defaults of τ = 0 . 3 and ε = 10% , which we v alidate empirically in Section 5. F or data-driven selection, one can p erm ute y , recompute RAPID, and choose the threshold placing observed risk ab o ve the 95th p ercen tile of the resulting null distribution. Uncertain ty can b e quantified via b ootstrap resampling or, treating RAPID as a binomial prop ortion, using Wilson score [Wilson, 1927] or Clopp er–P earson confidence interv als [Clopp er and Pearson, 1934]. Ev aluating syn thetic data generators. T o assess the general disclosure risk of a syn thetic data generator (SDG), we recommend k -fold cross-v alidation: partition the original data into k folds (stratified b y y if categorical), generate synthetic data from k - 1 folds, and ev aluate RAPID on the held-out fold. Aggregating across folds yields the exp ected risk E [RAPID] with confidence in terv als, providing a robust assessment of the SDG’s av erage disclosure risk. This approach is implemented via the rapid_synthesizer_cv() function and is particularly useful for selecting b et ween alternativ e synthesis metho ds (e.g., CAR T vs. parametric) or optimizing hyperparameters. Once a metho d is selected, standard RAPID should b e applied to the final synthetic data pro duct to obtain record-level risk assessments prior to the data release. 10 Computational complexity . The computational cost of RAPID is dominated by the mo del training step (line 1 in Algorithm 1), with subsequen t prediction and risk ev aluation requiring only O ( n ) operations. F or random forests, training complexity is O ( n · p · T · log n ) where n is the num b er of records, p the num ber of quasi-identifiers, and T the num ber of trees; prediction scales as O ( n · T · d ) where d is tree depth. Gradien t b oosting machines exhibit similar O ( n · p · T ) training complexity . Linear mo dels and logistic regression require O ( n · p 2 ) op erations via the normal equations or iterative fitting, while CAR T trees scale as O ( n · p · log n ) . In practice, RAPID ev aluation completes within seconds for datasets of 10,000 records and remains tractable for n > 100 , 000 with default random forest settings ( T = 500 trees). Memory usage is dominated b y the fitted mo del ob ject; random forests with many trees on high-dimensional data may require several hundred megabytes. When ev aluating multiple attack er mo dels or b o otstrap replicates, computations are embarrassingly parallel across mo dels, enabling efficient use of m ulti-core systems. 2.6 Prop erties RAPID has several structural prop erties that follow directly from its definition. First, it targets successful and confident attribute inference even ts rather than aggregate predictive accuracy , aligning the risk measure with inferential disclosure in the classical SDC taxonomy . Second, the normalization b y the empirical base rate ensures that categorical risk scores are inv ariant to class imbalance, so that common outcomes do not spuriously inflate disclosure risk. Third, RAPID is b ounded in [0 , 1] , as it is defined as the empirical mean of record-level disclosure indicators. This facilitates comparison across datasets, synthesizers, and attack er mo dels. F ourth, the construction is flexible with resp ect to the attack er mo del: an y predictive mo del capable of pro ducing p oin t predictions or class probabilities may b e used, allowing RAPID to b e ev aluated under strong and adaptive attack er assumptions. Finally , RAPID is monotone in the decision thresholds τ and ε , resp ectiv ely . Increasing the categorical threshold τ or decreasing the contin uous tolerance ε can only reduce the num b er of records classified as at risk. This monotonicit y supp orts transparent sensitivity analysis and makes RAPID well suited for practical disclosure con trol. Because RAPID op erates at the record lev el, it also enables subgroup-sp ecific and conditional risk analysis b y restricting the indicator av erage to subsets of the quasi-identifier space (see, e.g., Figure 5). 3 T o y example W e demonstrate the categorical RAPID metric on a simple example. Consider a dataset with 100 records where class healthy has 60% prev alence (marginal prop ortion). A mo del trained on released data is applied to three original records, all truly b elonging to class healthy : • Record 1: g 1 = Pr( ˆ y 1 = health y | x 1 ) = 0 . 70 • Record 2: g 2 = Pr( ˆ y 2 = health y | x 2 ) = 0 . 85 • Record 3: g 3 = Pr( ˆ y 3 = health y | x 3 ) = 0 . 55 The baseline is the marginal frequency of class healthy in the original data: b i = 0 . 60 for all three records (same class) W e compute the normalized gain for each record: r 1 = 0 . 70 − 0 . 60 1 − 0 . 60 = 0 . 10 0 . 40 = 0 . 25 r 2 = 0 . 85 − 0 . 60 1 − 0 . 60 = 0 . 25 0 . 40 = 0 . 625 r 3 = 0 . 55 − 0 . 60 1 − 0 . 60 = − 0 . 05 0 . 40 = − 0 . 125 In terpretation: 11 • Record 1: 25% of maxim um improv ement o ver baseline • Record 2: 62.5% of maxim um improv ement (high confidence!) • Record 3: Below baseline (mo del worse than guessing) Using the default threshold τ = 0 . 3 , w e flag records where r i > 0 . 3 : I { r 1 > 0 . 3 } = 0 , I { r 2 > 0 . 3 } = 1 , I { r 3 > 0 . 3 } = 0 The RAPID metric is: RAPID cat (0 . 3) = 1 3 (0 + 1 + 0) = 0 . 33 This indicates that 33% of records ha ve predictions substantially b etter than the baseline rate. Record 2, with 62.5% normalized gain, represen ts a high disclosure risk: the released data enables confident inference b ey ond what marginal class frequencies alone would allow. This example illustrates how RAPID identifies records where quasi-iden tifiers provide meaningful information gain, rather than merely measuring prediction accuracy . Example (contin uous attribute): No w consider the case where the sensitiv e v ariable is contin uous, such as income. Supp ose an attack er trains a regression mo del on released data and applies it to the original cov ariates of three individuals. Let the true incomes and the mo del’s predictions b e: • Record 1: y 1 = 50 , 000 , ˆ y 1 = 47 , 000 • Record 2: y 2 = 35 , 000 , ˆ y 2 = 39 , 000 • Record 3: y 3 = 80 , 000 , ˆ y 3 = 90 , 000 The stabilised relative prediction errors (as p ercen tages of true v alues (assuming δ = 0 ) are: e 1 = | 50 , 000 − 47 , 000 | 50 , 000 × 100 = 6% e 2 = | 35 , 000 − 39 , 000 | 35 , 000 × 100 = 11 . 4% e 3 = | 80 , 000 − 90 , 000 | 80 , 000 × 100 = 12 . 5% Using a threshold of ε = 10% , we flag records where predictions fall within 10% of the true v alue: I { e 1 < 10% } = 1 , I { e 2 < 10% } = 0 , I { e 3 < 10% } = 0 The contin uous RAPID metric is: RAPID cont (10%) = 1 3 (1 + 0 + 0) = 0 . 33 This indicates that for one-third of individuals, the attack er’s mo del predicted income within 10% relative error. Record 1, with only 6% error, represents a disclosure risk: the released data enables an attack er to infer income with high precision. This form of attribute disclosure is directly relev an t for risk assessment but would not b e captured by aggregate metrics lik e mean absolute error alone. 3.1 Soft w are and defaults The prop osed risk measure is implemented in the R package RAPID , publicly av ailable on GitHub [Thees et al., 2026]. The package builds on well-established libraries: ranger [W right and Ziegler, 2017] for random forests, whic h pro vides native parallelization and memory-efficient storage, glm for logistic regression, and xgboost [Chen and Guestrin, 2016] for gradient b o osting. It provides functions for computing RAPID for b oth categorical and con tinuous sensitive attributes, including baseline normalization, threshold calibration, and b ootstrap-based uncertain ty quantification. 12 Unless otherwise noted, we adopt the following default settings in our exp eriments: the attack er mo del M is a random forest with 500 trees and probabilistic outputs enabled. F or categorical attributes, we use the default threshold τ = 0 . 3 ; for contin uous attributes, we use the default relativ e error tolerance ε = 0 . 10 . Uncertain ty is quantified via a nonparametric b o otstrap ov er the original dataset (500 replicates), with p ercen tile-based confidence interv als. 4 Real data illustration: UCI A dult (Census Income) W e illustrate the workflo w on the training p ortion of the A dult dataset (UCI Machine Learning Rep ository; 32,561 rows, 15 attributes; binary confiden tial attribute y = I ( income > $50 K ) ) [Beck er and Koha vi, 1996]. The cov ariates, X , include age, education, hours-p er-w eek, marital status, etc. W e treat y as the confidential, sensitiv e v ariable and X as p oten tially known quasi-iden tifiers. Pre-pro cessing. W e remov ed the census sampling weigh t ( fnlwgt ) and the redundant categorical education v ariable (retaining education.num ) and conv erted c haracter v ariables to factors. Syn thesizers. W e consider a CAR T-based tabular synthesizer (as implemented in synthpop [No wok et al., 2016]), which is trained solely on Z and pro duces M = 5 synthetic replicates. A ttack mo dels. W e ev aluate an attack er suite S = { RF, GBM, ℓ 1 -logistic } , trained on each syn thetic replicate and scored on the real cov ariates X . Metrics and rep orting. W e compute RAPID cat ( τ ) across a range of threshold v alues and visualize the results as a threshold curv e (Figure 3). F or each synthetic replicate, w e av erage RAPID across the M = 5 replicates and rep ort 95% b ootstrap confidence interv als. W e additionally stratify RAPID by true class y to reveal whether disclosure risk differs across outcome categories – for example, whether high-income individuals are more identifiable than low-income individuals. Sensitivit y and diagnostics. T o understand how RAPID responds to threshold c hoices, w e plot RAPID cat ( τ ) across a grid of τ v alues (Figure 3), visualizing how disclosure risk decays as stricter normalized gain thresholds are imp osed. Practitioners may consider additional diagnostics: • Class balance: Rep orting the baseline probability b k for each class k exp oses the influence of class prev alence on the normalized gain. • Join t utility–risk view: T o con textualize disclosure risks, utility metrics such as predictive accuracy of mo dels trained on Z ( s ) but ev aluated on Z can b e rep orted alongside RAPID. T o assess attribute inference risk, we applied RAPID to the training p ortion of the UCI Adult dataset using the binary v ariable income as the sensitive attribute. Five syn thetic datasets were generated via the CAR T syn thesizer ( synthpop pac kage). F or each replicate, we trained a random forest attack er mo del on the synthetic data to infer the sensitive attribute from quasi-identifiers, then ev aluated the mo del’s predictions on the original dataset. W e computed RAPID across a range of threshold v alues τ ∈ [0 , 1] to examine how disclosure risk v aries with the stringency of the threshold. T o quantify uncertain ty , we p erformed non-parametric b ootstrapping with R = 1000 resamples from the original dataset, providing robust p ercentile-based confidence interv als. The RAPID score was calculated based on random forest predictions, reflecting a strong attack er mo del. Figure 3 shows ho w RAPID v aries with the normalized gain threshold τ . As τ increases from 0 to 1, fewer records exceed the threshold, demonstrating the monotonicity prop erty discussed in Section 2.6. This threshold curv e enables the data provider to calibrate disclosure risk according to their priv acy requirements. T able 2 rep orts RAPID v alues at the default threshold τ = 0 . 3 for each of the five syn thetic replicates. The narro w confidence interv als, obtained via non-parametric b ootstrapping with R = 500 resamples, indicate stable 13 τ = 0.3 0.0 0.1 0.2 0.3 0.4 0.5 0.6 0.7 0.8 0.9 1.0 0.00 0.05 0.10 0.15 0.20 0.25 0.30 0.35 0.40 0.45 0.50 0.55 0.60 0.65 0.70 0.75 0.80 0.85 0.90 0.95 1.00 Normalized Gain Threshold τ RAPID (propor tion at risk) Figure 3: Threshold sensitivity curve for the UCI Adult dataset. RAPID (prop ortion of records at risk) as a function of the normalized gain threshold τ , av eraged across 5 synthetic replicates generated via CAR T synthesis using synthpop [Raab et al., 2024]. The vertical dashed line marks the default threshold ( τ = 0 . 3 ). The curv e demonstrates ho w disclosure risk decreases as stricter thresholds are imp osed, with approximately 70% of records flagged at τ = 0 . 3 and less than 5% at τ = 0 . 9 . Shaded region indicates range across replicates. 14 risk estimates across replicates. Appro ximately 72% of records exhibit normalized gains exceeding the threshold, suggesting substantial attribute-inference risk for this dataset under the CAR T synthesizer. T able 2: RAPID estimates at default threshold τ = 0 . 3 for the UCI Adult dataset ( n = 32 , 561 ). Eac h row corresp onds to one syn thetic replicate generated via CAR T. Confidence interv als (95%) obtained via non- parametric b o otstrap ( R = 500 ). Replicate RAPID 95% CI (Low er) 95% CI (Upp er) n at risk 1 0.719 0.715 0.725 23,453 2 0.720 0.714 0.723 23,454 3 0.722 0.717 0.727 23,513 4 0.720 0.715 0.725 23,447 5 0.726 0.720 0.730 23,645 Is 72% attribute-inference risk “to o high”? The answ er is con text-dep enden t. The Adult dataset exhibits strong predictive structure: income category is well-predicted by education, o ccupation, hours work ed, and other quasi-identifiers. Any syn thesizer that preserves this structure for analytical utility will inevitably also preserv e the relationships that enable inference attacks. Datasets with weak er cov ariate–outcome relationships will typically yield low er RAPID v alues. Whether a given risk level is acceptable dep ends on the sensitivity of the attribute, the intended use case, and institutional risk tolerance. A data custo dian observing high RAPID migh t consider several resp onses: (i) applying a different syn thesizer with stronger priv acy guarantees, (ii) suppressing or coarsening quasi-iden tifiers that drive predictiv e accuracy (see Section 5.5 for diagnostic to ols), (iii) restricting access to the synthetic data, or (iv) accepting the risk for use cases where the sensitive attribute is not particularly confidential. RAPID do es not prescrib e a univ ersal threshold for acceptability; rather, it pro vides the empirical foundation for informed, context-specific release decisions. 5 Sim ulation study 5.1 Ov erview and design T o v alidate RAPID and inv estigate factors influencing attribute-inference risk, we conducted three simulation studies: 1. Dep endency strength: Ho w do es disclosure risk scale with the strength of the relationship b et ween quasi-iden tifiers (QIs) and sensitive attributes? ( κ ∈ [0 , 100] ) 2. Threshold sensitivity: Ho w do es τ affect risk across dep endency regimes? (5 κ levels × 19 τ v alues) 3. QI attribution: Whic h quasi-identifiers drive risk? (Regression-based analysis) All simulations use synthetic health micro data with six v ariables (gender, age, education, income, health score, and disease status). W e control dep endency strength via a global parameter κ ≥ 0 , with full details in A. 5.2 Data generation pro cess W e simulate n = 1 , 000 indep endent records with six v ariables: gender ( G ), age ( A ), education ( E ), income ( I ), health score ( H ), and disease status ( D ), where D serv es as the sensitive attribute. The design enco des realistic dep endencies through a latent so cioeconomic status (SES) v ariable, with dep endency strength controlled by parameter κ ≥ 0 . Signal and noise weigh ts are derived from κ as: w signal = r κ 1 + κ , w noise = r 1 1 + κ . 15 A t κ = 0 , relationships are purely noise-driven ( w signal = 0 ); at κ ≫ 1 , dep endencies approac h deterministic strength ( w signal → 1 ). The v ariable age follo ws a truncated normal; education is ordinal deriv ed from a laten t v ariable; income is log-linear; health score uses sigmoid transformation; disease status is generated via m ultinomial logit with κ -scaled co efficien ts; gender is binary with mild SES dep endency . Complete mathematical sp ecifications app ear in App endix A. 5.3 Dep endency strength W e v aried dep endency parameter κ from 0 to 100 (101 v alues, 10 replications each) to inv estigate how attribute- inference risk scales with quasi-identifier–sensitiv e attribute relationship strength. Subplot (a) in Figure 4 shows an S-shap ed tra jectory: risk escalates rapidly when transitioning from w eak to mo derate dep endencies, then saturates as relationships approach deterministic strength. Saturation near 0.97 rather than 1.0 reflects inherent noise from the CAR T syn thesizer’s sampling. Attac ker accuracy follows a similar tra jectory (0.70 to 0.98), demonstrating that RAPID reliably reflects actual prediction p erformance: datasets with high RAPID face gen uinely elev ated disclosure risk. Ha ving established that risk scales with dependency strength, we next in vestigate how the threshold parameter τ in teracts with this dep endency structure. Simulation 2 addresses this challenge by examining threshold sensitivity across the full dep endency sp ectrum. 5.4 Threshold sensitivity W e examined how the normalized gain threshold τ affects RAPID across five dep endency levels ( κ ∈ { 0 , 5 , 10 , 20 , 50 } ), v arying τ from 0.05 to 0.95 in 0.05 increments (10 replications p er combination). Subplot (b) in Figure 4 reveals a qualitative shift in curve geometry: at low dep endency ( κ = 0 , gray), RAPID decreases conv exly , dropping rapidly from 0.50 to near-zero by τ = 0 . 60 , indicating diffuse attac ker confidence. At high dep endency ( κ ≥ 5 , blue/red), curves remain concav e, staying elev ated until stringen t thresholds ( τ > 0 . 70 ), reflecting concentrated confidence distributions near certaint y . This conv ex-to-concav e transition marks a shift from w eak to strong adv ersarial inference capability . Practically , the choice of τ should b e guided b y the sensitivit y of the attribute rather than the prop ortion of flagged records: stricter thresholds ( τ ≥ 0 . 70 ) are appropriate for highly sensitive attributes where only near-certain inferences constitute unacceptable risk, while lo wer thresholds ( τ ≈ 0 . 30 – 0 . 40 ) provide broader protection when moderately confident inferences also p ose disclosure concerns. The threshold-dependency in teraction reveals that the same τ corresp onds to differen t levels of adversarial certain ty dep ending on data structure, requiring calibration to the sp ecific use case. 5.5 Quasi-iden tifier attribution Figure 5 illustrates the resulting predicted log-o dds across demographic com binations. The analysis reveals strong asso ciations b et ween education and attribute inference risk, with substantial interaction effects–particularly b et w een age and education levels–reflecting the strong quasi-identifi er dep endencies induced by the simulation design ( κ = 10 ). Bey ond these sp ecific patterns, the example demonstrates RAPID’s metho dological adv antage: ro w-wise risk flags enable attribution of inference vulnerability to sp ecific quasi-identifier combinations through standard regression mo deling. In real applications, such analysis could identify high-risk demographic groups for targeted disclosure control, test hypotheses about vulnerabilit y drivers (e.g., do es educational attainmen t moderate age-related risk?), and quantify effect sizes to prioritize mitigation efforts. 16 0.0 0.1 0.2 0.3 0.4 0.5 0.6 0.7 0.8 0.9 1.0 0 10 20 30 40 50 60 70 80 90 100 κ (Dependency Strength) RAPID (Propor tion at Risk) Confidence Rate Accur acy a) 0.1 0.2 0.3 0.4 0.5 0.6 0.7 0.8 0.9 Confidence Threshold (τ) Dependency Strength κ = 0 κ = 5 κ = 10 κ = 20 κ = 50 b) Figure 4: Impact of dep endency strength and normalized gain threshold on RAPID: (a) RAPID and attack er accuracy increase monotonically with dep endency strength κ . RAPID rises from 0.25 at κ = 0 to 0.97 at κ = 100 , with steep est increases at lo w κ v alues ( τ = 0 . 3 ). This S-shap ed growth demonstrates that attribute-inference risk escalates rapidly when transitioning from weak to mo derate quasi-identifier–sensitiv e attribute relationships, then saturates as dep endencies approach deterministic levels. (b) RAPID vs. normalized gain threshold τ for v arying κ . At low dep endency ( κ = 0 , gra y), the curve is conv ex, reflecting diffuse attac ker confidence where most records are filtered out at mo derate thresholds. At high dep endency ( κ ≥ 5 , blue/red), curves b ecome concav e, remaining elev ated until stringent thresholds ( τ > 0 . 7 ) are applied. This transition reflects a qualitative shift in attac ker confidence distributions as dep endencies strengthen. Both panels: Mean ± 1 SD ov er 10 simulations; n = 1000 records, CAR T syn thesizer, Random F orest attack er. 17 0 1 0 2 0 3 0 4 0 F e m a l e M a l e M a r g i n a l L o g - O d d s G e n d e r - 5 0 5 1 0 L o w M e d i u m H i g h E d u c a t i o n - 8 - 4 0 A g e ( p e r 1 0 y ) A g e E f f e c t - 5 0 5 F e m a l e L o w F e m a l e M e d i u m F e m a l e H i g h M a l e L o w M a l e M e d i u m M a l e H i g h P r e d i c t e d L o g - O d d s G e n d e r × E d u c a t i o n ( A g e = 5 0 ) - 2 0 2 3 0 5 0 7 0 A g e F e m a l e M a l e G e n d e r × A g e ( E d u c a t i o n = M e d i u m ) - 1 0 - 5 0 5 1 0 3 0 5 0 7 0 A g e L o w M e d i u m H i g h E d u c a t i o n × A g e ( G e n d e r = F e m a l e ) A g e = 3 0 A g e = 5 0 A g e = 7 0 L o w M e d i u m H i g h L o w M e d i u m H i g h L o w M e d i u m H i g h - 1 0 - 5 0 5 1 0 E d u c a t i o n P r e d i c t e d L o g - O d d s F e m a l e M a l e G e n d e r × E d u c a t i o n × A g e Figure 5: Quasi-iden tifier attribution analysis. Predicted log-odds of attribute inference risk from logistic regression across 50 simulations ( κ = 10 , τ = 0 . 3 , n = 1000 ). T op: Marginal effects. Middle: T w o-w ay in teractions at sp ecified conditioning v alues. Bottom: Three-w ay interaction at three age levels (30, 50, 70). Y-axes individually trimmed to enhance visibilit y; some extreme outliers not shown. 18 6 Discussion RAPID pro vides a mo del-based, attack er-realistic approach to assessing attribute inference risk in released data. In this section, we discuss how RAPID relates to existing disclosure risk measures, address limitations, and offer practical guidance. 6.1 Relationship to existing disclosure measures • Matc h-based ev aluation. RAPID shares the goal of quantifying attribute inference risk with measures lik e DCAP [T aub et al., 2018] and DiSCO [Raab et al., 2025], but differs fundamen tally in approach. DiSCO ev aluates risk by examining contingency tables: records are flagged disclosive when synthetic data within a quasi-identifier cell reveals unanimous sensitiv e attribute v alues, indicating that an attack er kno wing the quasi-identifiers could infer the sensitive attribute with high confidence. DCAP similarly assess how accurately an attack er can predict sensitive attributes, but quantify risk via the attack er’s exp ected prediction accuracy , computed from the synthetic conditional target distributions rather than from an explicit classifier. RAPID diverges from these approaches in three key asp ects. First, it op erates through predictive mo deling rather than contingency table analysis, enabling natural handling of mixed-type data without requiring discretization of contin uous v ariables or explicit enumeration of quasi-identifier cells. Second, RAPID’s threshold-based risk criterion is tunable: for categorical sensitiv e attributes, data curators calibrate the normalized gain threshold τ to reflect attribute sensitivity and acceptable disclosure risk, while for con tinuous attributes, the threshold ε sp ecifies the acceptable p ercen tage relative prediction error. Third, b y incorporating baseline predictability directly into a record-level normalized gain criterion, RAPID ensures that flagged records represent genuine inference adv antages b ey ond what marginal distributions alone would p ermit – addressing the class imbalance problem where rare outcomes might app ear “p erfectly predicted” in small cells simply due to low base rates. These design choic es reflect RAPID’s fo cus on adversarial realism: it mo dels what a sophisticated attack er with machine learning capabilities could achiev e, rather than relying on combinatorial uniqueness criteria. Ho wev er, this approach in tro duces significant limitations. The reliance on mac hine learning mo dels mak es RAPID’s risk assessmen ts opaque and difficult to audit: unlike table-based methods where a data sub ject can verify whether their quasi-identifier cell contains unanimous attribute v alues, RAPID’s predictions emerge from complex ensemble mo dels. This opacity complicates stakeholder communication and regulatory compliance, particularly when data sub jects exercise their righ t to explanation under priv acy regulations. Moreov er, RAPID’s risk estimates are contingen t on mo deling choices – attack er mo del type, h yp erparameters, and the threshold parameters ( τ for categorical, ε for contin uous attributes) – introducing degrees of freedom that require justification but lack established guidelines. The thresholds τ and ϵ , while flexible, are also arbitrary: there is no principled metho d for selecting τ or ε b ey ond domain exp ertise and sensitivity judgments, the same threshold v alues corresp ond to v astly different levels of adversarial certain ty dep ending on data structure. T o explore how risk estimates v ary with threshold choice, the rapid::plot() metho d applied on the rapid::rapid() result generates sensitivity curves sho wing the prop ortion of records flagged as at-risk across different v alues of τ (categorical) or ε (con tinuous). See B for usage examples. RAPID is suited for scenarios with complex quasi-iden tifier spaces, mixed-type data, or where mo deling realistic attack er capabilities is paramount. Other table-based measures are preferable when transparency and alignment with classical SDC frameworks are priorities, or when regulatory or institutional requirements demand interpretable risk assessments. F or critical applications, using b oth approaches in tandem may pro vide complementary p erspectives on disclosure risk. • Holdout-based ev aluation. Holdout-based frameworks assess priv acy via distance-to-closest-record (DCR), measuring whether synthetic records are closer to training than holdout records. While useful for detecting memorization, DCR do es not quantify attribute inference risk (e.g., Y ao et al., 2026): high attribute inference risk can co exist with “safe” DCR v alues if the synthesizer preserves predictiv e relationships without copying records. RAPID directly addresses attribute inference b y training on released data and scoring on original cov ariates. The paradigm of training mo dels on synthetic data and ev aluating on original data is well established for 19 utility assessment – measuring whether synthetic data preserve analytical relationships. RAPID repurp oses this paradigm for risk assessmen t: the same predictiv e accuracy that signals high utility also signals high disclosure risk when the prediction target is a sensitiv e attribute. Unlike DCR, RAPID provides an in terpretable, b ounded metric calibrated to class prev alence. Imp ortan tly , the R implemen tation of RAPID pro vided here supp orts b oth ev aluation mo des: the default match-based approach (training on synthetic data, scoring on all original records) and an optional holdout-based approach (training on synthetic data, scoring only on a holdout subset of original records not used to train the synthesizer). The holdout mo de allo ws practitioners to assess b oth memorization risk and attribute inference risk within a unified framew ork. See Section B for implementation details. • Ba yesian approac hes Bay esian disclosure risk measures [Reiter et al., 2014, Hu et al., 2021] pro vide p osterior probabilities of attribute disclosure by in tegrating ov er uncertaint y in the data-generating pro cess. These approaches offer principled worst-case b ounds but require distributional assumptions and can b e computationally intensiv e. RAPID takes a frequen tist, simulation-based approac h that is computationally efficient and assumption- ligh t. Rather than providing worst-case b ounds, RAPID estimates realized risk under a sp ecified attack er mo del. F or conserv ativ e assessmen ts, practitioners can ev aluate multiple attac ker mo dels and rep ort RAPID max (Section 2). 6.2 Limitations Sev eral limitations should b e ackno wledged: • Threshold selection: The c hoice of τ (categorical) and ε (con tinuous) substantially affects risk estimates and requires domain exp ertise. While threshold choice is not unique to RAPID – similar parameters app ear in k -anon ymity , ℓ -div ersity , DiSCO’s unanimity criterion, and differential priv acy’s ε – there is no univ ersally applicable guidance. The rapid::plot() metho d generates sensitivity curves to explore ho w flagged record prop ortions v ary with threshold c hoice (see App endix B). F or applications where thresholds are difficult to justify , data-driven approaches such as p ermutation tests offer an alternative. • Mo del dep endence: RAPID’s risk estimates dep end on the choice of attack er mo del. Different mo dels ma y pro duce differen t risk assessments for the same record. This is b oth a feature – capturing that differen t attac kers p ose different threats – and a limitation, as it in tro duces am biguity . F or conserv ativ e assessments, practitioners can ev aluate m ultiple attac ker mo dels and report RAPID max , the maxim um risk across mo dels. The inheren t opacity of machine learning mo dels makes RAPID’s assessmen ts harder to audit than relying on combinatorial uniqueness criteria that may underestimate risk. This further complicates regulatory compliance and stakeholder communication. • Single sensitive attribute: The curren t formulation assesses risk for one sensitiv e attribute at a time. In practice, datasets often contain multiple sensitiv e v ariables. Extending RAPID to join t or sequen tial assessmen t of multiple attributes is a direction for future work. 6.3 Practical guidance Based on our empirical results, w e offer the following guidance for practitioners: • Use τ = 0 . 3 as a starting p oin t for categorical attributes and ε = 10% for contin uous attributes. This c hoice is very v ariable dep enden t, for high sensitiv e v ariables, consider stricter thresholds. • Ev aluate RAPID using multiple attac ker mo dels (e.g., random forest, gradient b o osting) and rep ort the maxim um observed risk for a conserv ative assessmen t. • Generate threshold curves (RAPID vs. τ ) using the rapid::plot() metho d to understand sensitivity and guide threshold selection for sp ecific p olicy requirements. • Use p er-record risk flags for attribution analysis: stratify RAPID by subgroups, cross-tabulate risk rates across QI com binations, or fit regression mo dels to identify which quasi-identifier patterns drive disclosure risk. 20 • Con textualize RAPID alongside utility metrics to navigate the priv acy-utilit y trade-off when comparing syn thesizers or anonymization strategies. • Apply mitigation strategies for high-risk records: When RAPID identifies unacceptable risk levels, several in terven tions are a v ailable. Do not simply remov e high-risk records – this shifts the risk distribution and creates new high-risk records in subsequen t ev aluations. Instead, consider: 1. R e duc e quasi-identifier gr anularity through coarsening (binning con tinuous v ariables, merging cate- gories) or formal anonymization metho ds. Use attribution analysis (Section 5.5) to identify which quasi-iden tifiers drive predictive accuracy; 2. Exclude highly pr e dictive quasi-identifiers from the released data if not essential for analytical utility; 3. A dd p ost-pr o c essing noise to sensitive attributes in the synthetic data; 4. R etr ain the synthesizer with stronger priv acy constraints (e.g., differen tial priv acy , restricted conditional sampling); 5. R estrict ac c ess to the synthetic data through controlled environmen ts or data use agreements; 6. A c c ept the risk for use cases where the sensitive attribute is not highly confidential and stakeholders understand the trade-offs. 7 Conclusion Classical statistical disclosure control fo cused on iden tity disclosure and record uniqueness, but mo dern synthetic data generators p ose a differen t threat: high-fidelit y synthesis preserves predictiv e structure so w ell that sensitiv e attributes may b e inferable from quasi-identifiers alone. RAPID addresses this challenge b y directly measuring attribute inference vulnerabilit y under realistic attack er assumptions. Where previous measures asked “whether SDGs replicated iden tifying and sensitive information?”, RAPID asks “can an attack er confidently predict what they should not know?” This reframing enables practical decisions that were previously difficult. Data custo dians can now compare syn thesizers not only on utility but on inferential risk, iden tifying which metho ds leak predictiv e signal and which preserv e priv acy . The p er-record risk scores reveal high-risk subp opulations – combinations of quasi-identifiers where inference succeeds – enabling targeted remediation rather than blank et suppression. P erhaps most imp ortan tly , RAPID helps answ er the question implicit in ev ery high-utility synthetic release: is the utility to o high, reflecting dangerous fidelity to the original data’s predictive structure? W e emphasize what RAPID delib erately do es not claim. It is not a priv acy guarantee in the formal sense of differen tial priv acy , nor do es it provide w orst-case b ounds or eliminate the p ossibilit y of inferential disclosure. Rather, RAPID is a scenario-based empirical diagnostic: it quantifies realized vulnerability under a sp ecified attac ker mo del, conditional on the predictive structure preserved in the release. This p ositions RAPID as a complemen t to – not a replacement for – formal priv acy frameworks. Where differential priv acy offers prov able guaran tees at the cost of utility and interpretabilit y , RAPID offers transparent, actionable risk assessment that supp orts informed release decisions. The timing of this contribution reflects broader trends in data sharing. Op en science mandates increasingly require data av ailabilit y , yet legal and ethical constraints on micro data release remain. Synthetic data hav e emerged as a pragmatic solution, with adoption accelerating across official statistics, health research, and so cial science. Simultaneously , adv ances in machine learning and the growing av ailabilit y of public information ab out individuals hav e substantially increased the feasibility of priv acy attacks. RAPID provides the missing diagnostic: a wa y to assess whether synthetic data that lo ok safe actually ar e safe against inference attac ks that mo dern ML mak es trivial to mount. F uture work includes extensions to multiple sensitive attributes, integration with utility metrics in unified risk-utilit y dashboards, and developmen t of iterative workflo ws where high-risk records identified by RAPID are selectiv ely protected b efore re-ev aluation. The RAPID framework applies in principle to longitudinal data, where temp oral features provide additional quasi-identifiers and risk can b e assessed p er observ ation or aggregated p er individual; adapting the metho dology to account for within-individual correlation is a natural direction for further research. 21 Co de A v ailabilit y The core RAPID Thees et al. [2026] implementation is av ailable at https://github.com/qwertzlbry/RAPID . Complete repro ducibility co de including all simulation scripts (Section 5) and the real data analysis (Section 4) will b e released up on journal publication. A c kno wledgmen ts This work was supp orted by the Swiss National Science F oundation (SNSF) Bridge Disco very grant no. 211751. W e thank Jiří Nov ák for his con tributions to the early implementation of RAPID and discussions. References Andreas Alfons, Stefan Kraft, Matthias T empl, and Peter Filzmoser. Simulation of close-to-reality p opulation data for household surveys with application to EU-SILC. Statistic al Metho ds & Applic ations , 20(3):383–407, 2011. ISSN 1618-2510, 1613-981X. URL https://doi.org/10.1007/s10260- 011- 0163- 2 . Andrés F. Barrien tos, Alexander Bolton, T om Balmat, Jerome P . Reiter, John M. de Figueiredo, Ashwin Mac hanav ajjhala, Y an Chen, Charley Kneifel, and Mark DeLong. Providing access to confiden tial research data through synthesis and verification: An application to data on employ ees of the U.S. federal gov ernment. The A nnals of A pplie d Statistics , 12(2):1124–1156, 2018. URL https://doi.org/10.1214/18- AOAS1194 . Barry Beck er and Ronny Koha vi. Adult [Dataset]. UCI Machine Learning Repository , 1996. URL https: //doi.org/10.24432/C5XW20 . Alb erto Blanco-Justicia, David Sánchez, Josep Domingo-F errer, and Krishnamurt y Muralidhar. A critical review on the use (and misuse) of differen tial priv acy in machine learning. A CM Computing Surveys , 55(8):Article 160, 2022. URL https://doi.org/10.1145/3547139 . Tianqi Chen and Carlos Guestrin. X GBo ost: A Scalable T ree Bo osting System. In Pr o c e e dings of the 22nd A CM SIGKDD International Confer enc e on K now le dge Disc overy and Data Mining , page 785–794, San F rancisco California USA, August 2016. ACM. ISBN 978-1-4503-4232-2. URL https://doi.org/10.1145/2939672. 2939785 . Charles J. Clopp er and Egon S. Pearson. The use of confidence or fiducial limits illustrated in the case of the binomial. Biometrika , 26(4):404–413, 1934. URL https://doi.org/10.2307/2331986 . T ore Dalenius. T o w ards a metho dology for statistical disclosure control. Statistisk Tidskrift , 15:429–444, 1977. ISSN 0039-7261. Josep Domingo-F errer, David Sánchez, and Alb erto Blanco-Justicia. The limits of differential priv acy (and its misuse in data release and machine learning). Communic ations of the A CM , 64(7):33–35, 2021. ISSN 0001-0782. URL https://doi.org/10.1145/3433638 . Josep Domingo-F errer, Da vid Sánchez, and Krishnamurt y Muralidhar. Statistical Disclosure Control: Mo ving F orward. Journal of Official Statistics , 41(3):820–826, 2025. ISSN 0282-423X. URL https://doi.org/10. 1177/0282423X241312023 . George Duncan and Diane Lambert. The risk of disclosure for micro data. Journal of Business & Ec onomic Statistics , 7(2):207–217, 1989. URL https://doi.org/10.2307/1391438 . George Duncan, Sallie Keller-McNulty , and Lynne Stokes. Disclosure risk vs. data utilit y: the R-U confidentialit y map. T ec hnical rep ort LA-UR-01-6428, Los Alamos National Lab oratory , 2001. URL https://www.niss. org/sites/default/files/technicalreports/tr121.pdf . Cyn thia Dwork and Moni Naor. On the difficulties of disclosure preven tion in statistical databases or the case for differential priv acy . Journal of Privacy and Confidentiality , 2(1):93–107, 2010. ISSN 2575-8527. URL https://doi.org/10.29012/jpc.v2i1.585 . 22 Cyn thia Dwork, F rank McSherry , Kobbi Nissim, and Adam Smith. Calibrating noise to sensitivity in priv ate data analysis. In Pr o c e e dings of the Thir d Confer enc e on The ory of Crypto gr aphy , page 265–284, Berlin, Heidelb erg, 2006. Springer-V erlag. URL https://doi.org/10.1007/11681878_14 . Khaled El Emam, Laura Mosquera, and Jason Bass. Ev aluating identit y disclosure risk in fully synthetic health data: Mo del developmen t and v alidation. Journal of Me dic al Internet R ese ar ch , 22(11):Article e23139, 2020. URL https://doi.org/10.2196/23139 . P aul F rancis and David W agner. T ow ards b etter attribute i nference vulnerabilit y measures, 2025. URL https://doi.org/10.48550/arXiv.2507.01710 . Markus Hittmeir, Rudolf Ma yer, and Andreas Ekelhart. A baseline for attribute disclosure risk in synthetic data. In Pr o c e e dings of the T enth A CM Confer enc e on Data and A pplic ation Se curity and Privacy , CODASPY ’20, page 133–143, New Y ork, NY, USA, 2020. A CM. ISBN 9781450371070. URL https://doi.org/10.1145/ 3374664.3375722 . Jingc hen Hu, T errance D. Savitsky , and Matthew R. Williams. Bay esian estimation of p opulation size and o verlap from random samples. Journal of Privacy and Confidentiality , 11(1), 2021. URL https://doi.org/ 10.29012/jpc.748 . Anco Hundep o ol, Josep Domingo-F errer, Luisa F ranconi, Sarah Giessing, Eric Sch ulte Nordholt, Keith Spicer, and Peter-P aul de W olf. Statistic al disclosur e c ontr ol . Wiley series in survey metho dology . John Wiley & Sons, Ltd, 1 edition, 2012. ISBN 978-1-119-97815-2. URL https://doi.org/10.1002/9781118348239 . Saloni Kw atra and Vicenç T orra. Empirical ev aluation of synthetic data created b y generative mo dels via attribute inference attack. In F elix Bieker, Silvia de Conca, Nils Gruschka, Meik o Jensen, and Ina Sc hiering, editors, Privacy and Identity Management. Sharing in a Digital W orld , page 282–291, Cham, 2024. Springer Nature Switzerland. ISBN 978-3-031-57978-3. URL https://doi.org/10.1007/978- 3- 031- 57978- 3_18 . Kidist Amde Mekonnen. Conditioning GAN without training dataset, 2024. URL https://doi.org/10.48550/ arXiv.2405.20687 . Mark o Miletic and Murat Sariyar. Challenges of using synthetic data generation metho ds for tabular micro data. A pplie d Scienc es , 14(14):Article 5975, 2024. ISS N 2076-3417. URL https://doi.org/10.3390/app14145975 . Rainer Mühlhoff. Predictiv e priv acy: T o w ards an applied ethics of data analytics. Ethics and Informa- tion T e chnolo gy , 23(4):675–690, 2021. ISSN 1388-1957, 1572-8439. URL https://doi.org/10.1007/ s10676- 021- 09606- x . Krishnam urty Muralidhar and Josep Domingo-F errer. Database reconstruction is not so easy and is different from reidentification. Journal of Official Statistics , 39(3):381–398, 2023. URL https://doi.org/10.2478/ jos- 2023- 0017 . Krishnam urty Muralidhar and Steven Ruggles. Escalation of commitment: A case study of the united states census bureau efforts to implement differential priv acy for the 2020 decennial census, 2024. URL https: //doi.org/10.48550/arXiv.2407.15957 . B. A. Nosek, G. Alter, G. C. Banks, D. Borsb oom, S. D. Bowman, S. J. Breckler, S. Buc k, C. D. Chambers, G. Chin, G. Christensen, M. Con testabile, A. Dafo e, E. Eic h, J. F reese, R. Glennerster, D. Goroff, D. P . Green, B. Hesse, M. Humphreys, J. Ishiyama, D. Karlan, A. Kraut, A. Lupia, P . Mabry , T. Madon, N. Malhotra, E. May o- Wilson, M. McNutt, E. Miguel, E. Levy P aluck, U. Simonsohn, C. So derberg, B. A. Sp ellman, J. T uritto, G. V andenBos, S. V azire, E. J. W agenmak ers, R. Wilson, and T. Y ark oni. Promoting an op en researc h culture. Scienc e , 348(6242):1422–1425, 2015. ISSN 0036-8075. URL https://doi.org/10.1126/science.aab2374 . Beata Now ok, Gillian M. Raab, and Chris Dibb en. synthpop: Besp oke creation of syn thetic data in R. Journal of Statistic al Softwar e , 74(11):1–26, 2016. ISSN 1548-7660. URL https://doi.org/10.18637/jss.v074.i11 . Mic hael Platzer and Thomas Reutterer. Holdout-based empirical assessment of mixed-t yp e synthetic data. F r ontiers in Big Data , 4:Article 679939, 2021. URL https://doi.org/10.3389/fdata.2021.679939 . 23 Gillian M. Raab, Beata No wok, Chris Dibb en, and Josh ua Snoke. synthp op U ser Guide . Univ ersity of Edin burgh, 2024. URL https://cran.r- project.org/package=synthpop . R package vignette/manual; attribute disclosure to ols incl. DiSCO. Gillian M. Raab, Beata Now ok, and Chris Dibb en. Practical priv acy metrics for synthetic data, 2025. URL https://doi.org/10.48550/arXiv.2406.16826 . Jerome P . Reiter, Quanli W ang, and Biyuan Zhang. Ba yesian estimation of disclosure risks for multiply imputed, synthetic data. Journal of Privacy and Confidentiality , 6(1), 2014. ISSN 2575-8527. URL https: //doi.org/10.29012/jpc.v6i1.635 . Donald B. Rubin. Discussion of statistical disclosure limitation. Journal of Official Statistics , 9(2):461–468, 1993. Manel Slokom, Peter-P aul de W olf, and Martha Larson. When machine learning mo dels leak: An exploration of synthetic training data. In Josep Domingo-F errer and Maryline Laurent, editors, Privacy in Statistic al Datab ases , volume 13463 of L e ctur e Notes in Computer Scienc e , pages 283–296, Cham, Switzerland, 2022. Springer. ISBN 978-3-031-13945-1. URL https://doi.org/10.1007/978- 3- 031- 13945- 1_20 . Swiss National Science F und (SNSF). Op en Research Data: Ein erster Blic k auf die aktuelle Praxis. https: //data.snf.ch/stories/open- research- data- 2023- de.html , 2024. accessed Octob er 15, 2025. Jennifer T aub, Mark Elliot, Maria Pampaka, and Duncan Smith. Differential correct attribution probability for syn thetic data: An exploration. In Josep Domingo-F errer and F rancisco Montes, editors, Privacy in Statistic al Datab ases , page 122–137, Cham, 2018. Springer International Publishing. ISBN 978-3-319-99771-1. URL https://doi.org/10.1007/978- 3- 319- 99771- 1_9 . Matthias T empl. Providing data with high utilit y and no disclosure risk for the public and researc hers: An ev aluation by adv anced statistical disclosure risk. A ustrian Journal of Statistics , 43(4):247–254, 2014. URL https://doi.org/10.17713/ajs.v43i4.43 . Matthias T empl, Bernhard Meindl, Alexander Ko w arik, and Olivier Dupriez. Simulation of synthetic complex data: The R package simPop. Journal of Statistic al Softwar e , 79(10):1–38, 2017. URL https://doi.org/10. 18637/jss.v079.i10 . Oscar Thees, Jiří Novák, and Matthias T empl. Ev aluation of synthetic data generators on complex tabular data. In Josep Domingo-F errer and Melek Önen, editors, Privacy in Statistic al Datab ases , page 194–209, Cham, 2024. Springer Nature Switzerland. URL https://doi.org/10.1007/978- 3- 031- 69651- 0_13 . Oscar Thees, Roman Müller, and Matthias T empl. Beyond the trade-off curve: Multiv ariate and adv anced risk-utilit y maps for ev aluating anonymized and synthetic data, 2025. URL https://doi.org/10.48550/ arXiv.2510.23500 . Oscar Thees, Matthias T empl, and Roman Müller. RAPID: Risk A ssessment thr ough Pr e diction for Infer enc e- b ase d Disclosur e , 2026. URL https://github.com/qwertzlbry/RAPID . R package version 0.1.0. Josh ua W ard, Y uxuan Y ang, Chi-Hua W ang, and Guang Cheng. Ensembling membership inference attacks against tabular generativ e mo dels. In Pr o c e e dings of the 18th A CM W orkshop on A rtificial Intel ligenc e and Se curity , AISec ’25, pages 182–193, New Y ork, NY, USA, 2025. ACM. ISBN 979-8-4007-1895-3. URL https://doi.org/10.1145/3733799.3762977 . Leon Willenborg and T on de W aal. Elements of statistic al disclosur e c ontr ol , volume 155 of L e ctur e Notes in Statistics . Springer, 1 edition, 2001. ISBN 978-1-4613-0121-9. URL https://doi.org/10.1007/ 978- 1- 4613- 0121- 9 . Edwin B. Wilson. Probable inference, the la w of succession, and statistical inference. Journal of the A meric an Statistic al A sso ciation , 22(158):209–212, 1927. URL https://doi.org/10.1080/01621459.1927.10502953 . Marvin N. W righ t and Andreas Ziegler. ranger: A fast implementation of random forests for high dimensional data in C++ and R. Journal of Statistic al Softwar e , 77(1):1–17, 2017. URL https://doi.org/10.18637/ jss.v077.i01 . 24 Zexi Y ao, Nataša Krčo, Georgi Ganev, and Y ves-Alexandre de Montjo ye. The dcr delusion: Measuring the priv acy risk of synthetic data. In Vincent Nicomette, Ab delmalek Benzekri, Nora Boulahia-Cupp ens, and Jaideep V aidya, editors, Computer Se curity – ESORICS 2025 , pages 469–487, Cham, 2026. Springer Nature Switzerland. URL https://doi.org/10.1007/978- 3- 032- 07884- 1_24 . A Sim ulation data generation W e simulate n indep enden t micro data records with six v ariables: gender ( G ), age ( A ), education ( E ), income ( I ), health score ( H ), and disease status ( D ). The design enco des realistic, p olicy-relev an t dep endencies through a latent so cio economic status (SES) v ariable while remaining transparent and tunable via a global dep endency parameter κ ≥ 0 . Throughout, TN ( µ, σ 2 ; [ a, b ]) denotes a normal distribution truncated to [ a, b ] , and we use standardized predictors ˜ X = ( X − µ X ) /σ X when indicated. Dep endency mec hanism. All v ariable dep endencies flow through a shared latent v ariable: SES i ∼ N (0 , 1) , represen ting unobserved so cioeconomic status. The strength of dep endencies is controlled b y signal and noise w eights derived from κ : w signal = r κ 1 + κ , w noise = r 1 1 + κ . A t κ = 0 , relationships are driv en purely by noise ( w signal = 0 , w noise = 1 ). As κ → ∞ , dependencies b ecome deterministic ( w signal → 1 , w noise → 0 ). At the default κ = 1 , signal and noise contr ibute equally ( w signal = w noise = 1 / √ 2 ), yielding approximately 50% explained v ariance. Age. W e draw age from a truncated normal to reflect adult p opulations: A i ∼ TN ( µ A , σ 2 A ; [ a min , a max ]) , defaults: µ A = 45 , σ A = 12 , a min = 18 , a max = 85 . Education. Education is an ordinal categorical v ariable with three levels { 0 , 1 , 2 } corresp onding to low , me dium , and high attainmen t. W e generate E i from a latent contin uous v ariable that dep ends on b oth SES and age: L i = w signal · (0 . 8 · SES i − 0 . 4 · ˜ A i ) + w noise · ε i , ε i ∼ N (0 , 1) , E i = 0 if L i < c 1 , 1 if c 1 ≤ L i < c 2 , 2 if L i ≥ c 2 , c 1 = − 0 . 3 , c 2 = 0 . 7 . The negative age co efficien t reflects the empirical pattern of younger cohorts having higher educational attainment. Income. W e generate log-income using a linear mo del: log I ⋆ i = w signal · (0 . 5 · SES i + 0 . 3 · ˜ A i + 0 . 25 · E i ) + w noise · ε i , ε i ∼ N (0 , 1) , I i = exp(10 + log I ⋆ i ) . The constant 10 centers income around realistic v alues (approximately $20,000–$40,000). Health score. H is a contin uous health measure on [0 , 100] created via sigmoid transformation of a linear predictor: H ⋆ i = w signal · 0 . 6 · SES i − 0 . 5 · ˜ A i + 0 . 2 · E i + 0 . 2 · ] log I i + w noise · ζ i , ζ i ∼ N (0 , 1) , H i = 100 1 + exp( − H ⋆ i ) . The negative age co efficient reflects declining health with age, while p ositiv e SES, education, and income co efficien ts represent protective effects. 25 Disease status. D i ∈ { healthy , diabetic , hypertensive } is sampled via a m ultinomial logit with healthy as the baseline. Unlik e other v ariables, disease dep endencies scale line arly with κ rather than through signal/noise weigh ts: log Pr( D i = diabetic ) Pr( D i = healthy ) = − 1 . 5 + κ · 0 . 8 · ˜ A i − 0 . 3 · ] log I i − 0 . 2 · E i , log Pr( D i = hypertensive ) Pr( D i = healthy ) = − 1 . 3 + κ · 1 . 0 · ˜ A i − 0 . 2 · ] log I i − 0 . 1 · E i . This linear scaling creates stronger dep endency effects at high κ : older age raises risk, while higher income and education are mildly protective. The fixed interce pts ( − 1 . 5 and − 1 . 3 ) induce a baseline class imbalance fav oring healthy outcomes. Gender. Gender is binary with mild dep endency on SES, age, and education: η i = w signal · (0 . 3 · SES i − 0 . 2 · ˜ A i + 0 . 2 · E i ) , G i ∼ Bernoulli logit − 1 ( η i ) , G i ∈ { female , male } . Con trolling dep endence strength. The global parameter κ ≥ 0 con trols the strength of all dep endencies: • κ = 0 : V ariables retain weak dep endencies due to fixed in tercepts in the disease mo del, but signal con tributions v anish ( w signal = 0 ). • κ = 1 (default): Balanced signal-to-noise ratio, yielding mo derate dep endencies. • κ ≫ 1 : Near-deterministic relationships as w signal → 1 and disease co efficien ts grow large. Because disease logits scale linearly with κ while other v ariables use the signal-to-noise transformation, disease dep endencies strengthen more rapidly at high κ . Defaults and realism. With default κ = 1 , the simulation pro duces realistic marginal distributions and mo derate dep endencies: income rises with SES, age, and education; health declines with age but improv es with so cioeconomic status; and the probabilities of diabetic and hypertensive increase with age and decrease with income and education. These defaults can b e adapted to domain-sp ecific baselines by adjusting v ariable-specific parameters without changing κ . B Usage example RAPID [Thees et al., 2026] is implemented as an op en-source R package with S3 metho ds for streamlined analysis. A typical workflo w pro ceeds in tw o stages: first, assess a generated synthetic dataset for p er-record risks; second, if ev aluating multiple synthesis metho ds or seeking robust estimates with uncertaint y quantification, use cross-v alidation for metho d comparison. The primary use case is ev aluating disclosure risk for a sp ecific syn thetic dataset b efore release: # Install and load required packages devtools::install_github("qwertzlbry/RAPID") install.packages("synthpop") library(RAPID) library(synthpop) set.seed(2025) n <- 1000 # Generate independent variables 26 age <- sample(20:70, n, replace = TRUE) education <- factor(sample(c("low", "medium", "high"), n, replace = TRUE)) gender <- factor(sample(c("M", "F"), n, replace = TRUE)) # Generate disease_status with dependencies disease_status <- sapply(1:n, function(i) { probs <- c(0.6, 0.2, 0.2) # Base: healthy, diabetic, hypertensive # Older people more likely diabetic if (age[i] > 55) { probs <- c(0.3, 0.5, 0.2) } # Low education + older → more diabetic if (age[i] > 55 && education[i] == "low") { probs <- c(0.2, 0.6, 0.2) } sample(c("healthy", "diabetic", "hypertensive"), 1, prob = probs) }) disease_status <- factor(disease_status) data_orig <- data.frame(age, education, gender, disease_status) data_syn <- syn(data_orig, method = "cart", seed = 2025)$syn # Assess attribute inference risk result <- rapid( original_data = data_orig, synthetic_data = data_syn, quasi_identifiers = c("age", "education", "gender"), sensitive_attribute = "disease_status", model_type = "rf", cat_tau = 0.3, return_all_records = TRUE ) # View result print(result) # RAPID Assessment # ================ # Method: RCS_marginal # Risk level: 15.5 % # Records at risk: 155 / 1000 # Threshold (tau): 0.3 # Detailed summary with model metrics summary(result) # RAPID Risk Assessment Summary # ============================== # Evaluation method: RCS_marginal # Attacker model: Random Forest # Risk Metrics: # Confidence rate: 0.155 # Records at risk: 155 ( 15.5 %) # Threshold (tau): 0.3 # Model Performance: # Accuracy: 0.599 27 # Visualize threshold sensitivity plot(result) # Identify high-risk records for disclosure control print(result, type = "high_risk") disease_status age edu gender pred_class true_prob baseline normalized_gain cat_tau at_risk 9 diabetic 68 low M diabetic 0.6036335 0.292 0.4401603 0.3 TRUE 14 healthy 42 high F healthy 0.6587221 0.495 0.3242022 0.3 TRUE 26 diabetic 63 low M diabetic 0.5541064 0.292 0.3702068 0.3 TRUE ... and 152 more The package provides three S3 metho ds for result insp ection: print() displa ys a concise summary of risk lev el and threshold; summary() pro vides detailed assessment metrics including mo del p erformance statistics; and plot() generates threshold sensitivity curves showing how risk estimates v ary with τ (for categorical) or ε (for contin uous attributes). The print(result, type = "high_risk") call displays records flagged as at-risk, facilitating targeted disclosure control strategies. When ev aluating m ultiple synthesis metho ds or seeking robust risk estimates with confidence interv als, cross-v alidation provides uncertaint y quantification. The rapid_synthesizer_cv() function implements k -fold cross-v alidation, and results can b e insp ected using print() : # Define synthesizer function cart_synthesizer <- function(data, seed = NULL) { synthpop::syn(data, method = "cart", m = 1, seed = seed, print.flag = FALSE)$syn } # Cross-validation across 5 folds cv_result <- rapid_synthesizer_cv( original_data = data_orig, synthesizer = cart_synthesizer, quasi_identifiers = c("age", "education", "gender"), sensitive_attribute = "disease_status", k = 5, model_type = "rf", cat_tau = 0.3 ) print(cv_result) # RAPID Cross-Validation Results # =============================== # Evaluation method: RCS_marginal # Attacker model: rf # K-folds: 5 # Threshold (tau): 0.3 # Threshold (epsilon): NA # # Risk Estimate: # Mean: 0.118 # SD: 0.03 # 95% CI: [0.092, 0.144] Cross-v alidation is particularly v aluable when syn thesis metho ds in volv e sto c hastic elements, as it quan tifies v ariabilit y in risk estimates across different training-test splits and enables principled comparison of alternative syn thesis approaches. 28
Original Paper
Loading high-quality paper...
Comments & Academic Discussion
Loading comments...
Leave a Comment