Flare: Anomaly Diagnostics for Divergent LLM Training in GPU Clusters of Thousand-Plus Scale
The rapid proliferation of large language models has driven the need for efficient GPU training clusters. However, it is challenging due to the frequent occurrence of training anomalies. Since existing diagnostic tools are narrowly tailored to specific issues, there are gaps in their ability to address anomalies spanning the entire training stack. In response, we introduce Flare, a diagnostic framework designed for distributed LLM training at scale. Flare first integrates a lightweight tracing daemon for full-stack and backend-extensible tracing. Additionally, it features a diagnostic engine that automatically diagnoses anomalies, with a focus on performance regressions. The deployment of Flare across 6,000 GPUs has demonstrated significant improvements in pinpointing deficiencies in real-world scenarios, with continuous operation for over eight months.
💡 Research Summary
The paper presents Flare, a comprehensive diagnostic framework designed to detect and automatically diagnose anomalies that arise during large‑scale LLM training on GPU clusters comprising thousands of devices. The authors begin by outlining the three primary categories of anomalies observed in production at Ant Group: runtime errors, sudden “fail‑slow” slowdowns, and persistent performance regressions. While errors and fail‑slows are typically obvious and handled by operations teams, regressions are subtle, often caused by algorithm‑level code changes or infrastructure‑level operator inefficiencies, and require cross‑team collaboration to resolve.
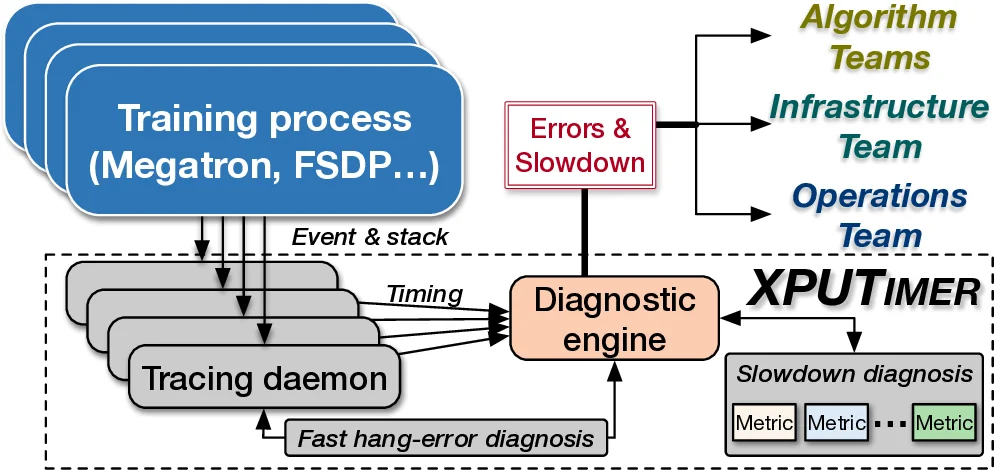
To address these challenges, Flare consists of two tightly coupled components: a lightweight tracing daemon and a diagnostic engine. The tracing daemon attaches to each training process automatically and instruments only a curated set of key APIs across both Python and C++ runtimes. In the Python layer, Flare leverages CPython’s built‑in tracing facilities to capture function entry/exit events and call stacks without modifying the underlying training frameworks (e.g., PyTorch, DeepSpeed). In the C++ layer, it intercepts calls to critical libraries such as cuBLAS, NCCL, FlashAttention, and custom operators, as well as kernel launch events. This selective instrumentation yields a modest data footprint—approximately 1.5 MB of logs per GPU per training step—while still providing the granularity needed for fine‑grained analysis. Crucially, the daemon exposes a plug‑and‑play interface that allows new parallel backends (FSDP, Megatron, etc.) to be added with minimal code changes, satisfying the authors’ “backend‑extensibility” requirement.
The diagnostic engine builds on the real‑time data collected by the daemon. It implements two diagnostic pathways. First, a fast hang‑error detection mechanism identifies communication‑related hangs by inspecting intra‑kernel states and NCCL events, achieving O(1) complexity for faulty‑node identification and avoiding exhaustive blind searches. Second, a performance‑regression detection pipeline monitors a suite of novel micro‑metrics—including issue latency distributions, kernel execution time variance, and Python garbage‑collection frequency—alongside traditional macro metrics such as overall training throughput. By comparing these metrics against historical baselines, Flare can spot regressions that would be invisible to throughput‑only monitoring. When a regression is detected, the engine automatically traces the offending Python API calls and correlates them with recent code changes, routing the root‑cause information to the appropriate algorithm or infrastructure team. Errors and fail‑slows are routed to operations staff.
The authors evaluate Flare on a 1024‑GPU H800 cluster running a variety of LLMs (e.g., Llama‑70B, GPT‑3) and multiple parallel backends. The measured runtime overhead averages 0.43 %, and the tracing logs remain within the 1.5 MB per‑GPU budget, far lower than the multi‑gigabyte logs produced by generic profilers such as CUPTI. Over an eight‑month deployment across more than 6,000 GPUs, Flare has reduced the time to isolate performance regressions from hours to minutes and has lowered the frequency of manual cross‑team investigations. Real‑world case studies show that Flare successfully identified unnecessary synchronizations introduced by algorithm developers and unoptimized kernels in the infrastructure stack, leading to up to 2.66 % throughput improvements in production workloads.
In comparison with prior tools—Greyhound, C4D, Holmes (focused on errors/fail‑slows) and MegaScale (tightly coupled to a single backend)—Flare uniquely offers full‑stack tracing, backend‑agnostic extensibility, and automated regression diagnostics. The framework is open‑sourced as part of the DLRover project and integrated into Ant Group’s production pipeline, with support from the LF AI & Data Foundation.
In summary, Flare demonstrates that a carefully engineered, low‑overhead tracing infrastructure combined with targeted micro‑metric analysis can automate the detection and root‑cause isolation of both acute failures and subtle performance degradations in massive LLM training clusters, thereby accelerating model development and improving overall cluster utilization.
Comments & Academic Discussion
Loading comments...
Leave a Comment