Fields of The World: A Field Guide for Extracting Agricultural Field Boundaries
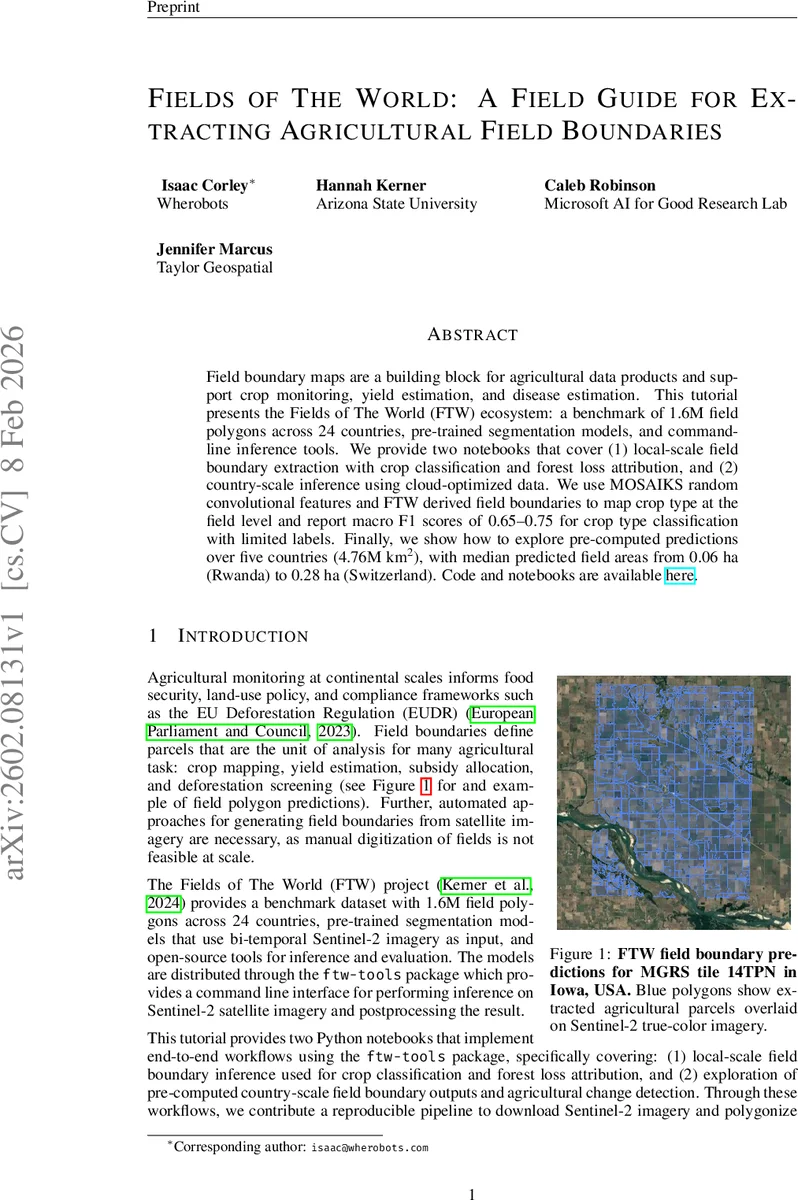
Field boundary maps are a building block for agricultural data products and support crop monitoring, yield estimation, and disease estimation. This tutorial presents the Fields of The World (FTW) ecosystem: a benchmark of 1.6M field polygons across 24 countries, pre-trained segmentation models, and command-line inference tools. We provide two notebooks that cover (1) local-scale field boundary extraction with crop classification and forest loss attribution, and (2) country-scale inference using cloud-optimized data. We use MOSAIKS random convolutional features and FTW derived field boundaries to map crop type at the field level and report macro F1 scores of 0.65–0.75 for crop type classification with limited labels. Finally, we show how to explore pre-computed predictions over five countries (4.76M km\textsuperscript{2}), with median predicted field areas from 0.06 ha (Rwanda) to 0.28 ha (Switzerland).
💡 Research Summary
The paper introduces the “Fields of The World” (FTW) ecosystem, a comprehensive framework for extracting agricultural field boundaries from satellite imagery and integrating those boundaries into downstream agricultural monitoring tasks. FTW provides three core components: (1) a benchmark dataset containing 1.6 million field polygons spanning 24 countries, (2) pre‑trained deep‑learning segmentation models based on a U‑Net architecture with an EfficientNet‑B3 encoder, and (3) an open‑source command‑line toolkit (ftw‑tools) that automates the entire workflow from data acquisition to polygon generation.
The authors describe two end‑to‑end notebooks. The first demonstrates a local‑scale workflow: bi‑temporal Sentinel‑2 Level‑2A imagery (early‑season and late‑season RGB + NIR at 10 m) is retrieved via the Microsoft Planetary Computer STAC API, cloud‑free scenes are composited using median statistics, and the FTU model produces per‑pixel probabilities for field interior, field boundary, and background. Post‑processing applies a 0.5 softmax threshold, morphological opening, and connected‑component labeling, followed by optional land‑cover masking (e.g., ESA WorldCover) and vectorization into GeoPackage polygons.
For downstream analysis, the paper leverages MOSAIKS random convolutional features. Each field’s Sentinel‑2 pixels are filtered through 256 random 3 × 3 Gaussian kernels, ReLU‑activated, and globally average‑pooled to obtain a 256‑dimensional embedding. A simple logistic‑regression classifier trained on USDA Crop Data Layer (CDL) labels achieves macro F1 scores of 0.65–0.75, even when only 10 % of the labeled fields are used for training, demonstrating strong few‑shot capability.
The second notebook showcases a country‑scale pipeline. Pre‑computed predictions for five countries (Japan, Mexico, Rwanda, South Africa, Switzerland) covering 4.76 M km², two seasons, and two years (2023–2024) are stored as cloud‑optimized Zarr archives. Inference is performed with a sliding window (256 × 256 px, 25 % overlap) and Gaussian‑weighted averaging to mitigate edge artifacts. The Zarr files contain both the original Sentinel‑2 mosaics and the raw softmax probability layers, enabling users to apply custom thresholds, watershed segmentation, or other vectorization strategies without re‑running the model. Spatial queries can be executed directly in the cloud, supporting efficient exploration of arbitrary extents.
The authors also integrate Hansen Global Forest Change data to attribute forest loss to individual field polygons. By joining FTW polygons with annual loss‑year rasters, they compute zonal statistics (mean, min, max loss year) per field, highlighting parcels with recent deforestation—a capability directly relevant to compliance with the EU Deforestation Regulation (EUDR).
Results show that the FTW segmentation models generalize across diverse agro‑ecological zones, producing realistic field boundaries from both smallholder (median area ≈ 0.06 ha in Rwanda) and mechanized (median area ≈ 0.28 ha in Switzerland) systems. The MOSAIKS‑based crop classification achieves high accuracy for dominant crops (corn, soybeans) while revealing typical confusion among minority classes, reflecting class imbalance in the CDL labels. Year‑over‑year change detection is demonstrated by differencing the 2023 and 2024 field‑probability maps and flagging pixels exceeding the 99th percentile of absolute change, illustrating potential for monitoring agricultural expansion or abandonment.
In conclusion, the FTW ecosystem delivers a reproducible, scalable solution for global field boundary extraction and its integration with crop type mapping and forest‑loss attribution. By open‑sourcing the dataset, models, and tooling, and by providing cloud‑native pre‑computed products, the authors lower the barrier for researchers, NGOs, and policy makers to conduct large‑scale agricultural monitoring, food‑security assessments, and compliance verification. The combination of robust deep‑learning segmentation, lightweight random‑feature embeddings, and cloud‑optimized data formats positions FTW as a foundational resource for future Earth‑observation‑driven agriculture analytics.
Comments & Academic Discussion
Loading comments...
Leave a Comment