Nonvisual Support for Understanding and Reasoning about Data Structures
Blind and visually impaired (BVI) computer science students face systematic barriers when learning data structures: current accessibility approaches typically translate diagrams into alternative text, focusing on visual appearance rather than preserving the underlying structure essential for conceptual understanding. More accessible alternatives often do not scale in complexity, cost to produce, or both. Motivated by a recent shift to tools for creating visual diagrams from code, we propose a solution that automatically creates accessible representations from structural information about diagrams. Based on a Wizard-of-Oz study, we derive design requirements for an automated system, Arboretum, that compiles text-based diagram specifications into three synchronized nonvisual formats$\unicode{x2013}$tabular, navigable, and tactile. Our evaluation with BVI users highlights the strength of tactile graphics for complex tasks such as binary search; the benefits of offering multiple, complementary nonvisual representations; and limitations of existing digital navigation patterns for structural reasoning. This work reframes access to data structures by preserving their structural properties. The solution is a practical system to advance accessible CS education.
💡 Research Summary
The paper addresses a critical accessibility gap in computer‑science education: blind and visually impaired (BVI) students rely on visual diagrams (arrays, binary trees, flowcharts) to grasp structural concepts, yet current accommodations—primarily alternative‑text descriptions—capture only superficial visual details and ignore the underlying relational and algorithmic properties. The authors observe that modern diagram‑generation tools (Mermaid, Graphviz, PlantUML, d2) already encode the full structural information of a diagram in a textual specification. Leveraging this insight, they propose an automated pipeline that converts such specifications into three synchronized non‑visual representations: a tabular view, a keyboard‑navigable digital view, and a tactile printout.
Before building the system, the authors conducted a Wizard‑of‑Oz study with eight BVI participants to explore trade‑offs among three prototype modalities: (1) a linear ALT‑text description enhanced with a large‑language‑model question‑answering component, (2) a custom‑navigation digital graph that follows the flow direction of a chart, and (3) a tactile diagram printed on swell paper with an accompanying digital legend. Participants reported that no single modality allowed them to form a complete mental model; each had distinct strengths—tactile graphics preserved spatial layout and excelled for complex traversal tasks, while textual/tabular formats facilitated quick look‑ups. The study yielded five design requirements: (a) faithful preservation of structural information, (b) real‑time synchronization across modalities, (c) intuitive directional navigation, (d) low‑cost automated tactile generation, and (e) customizable interaction options.
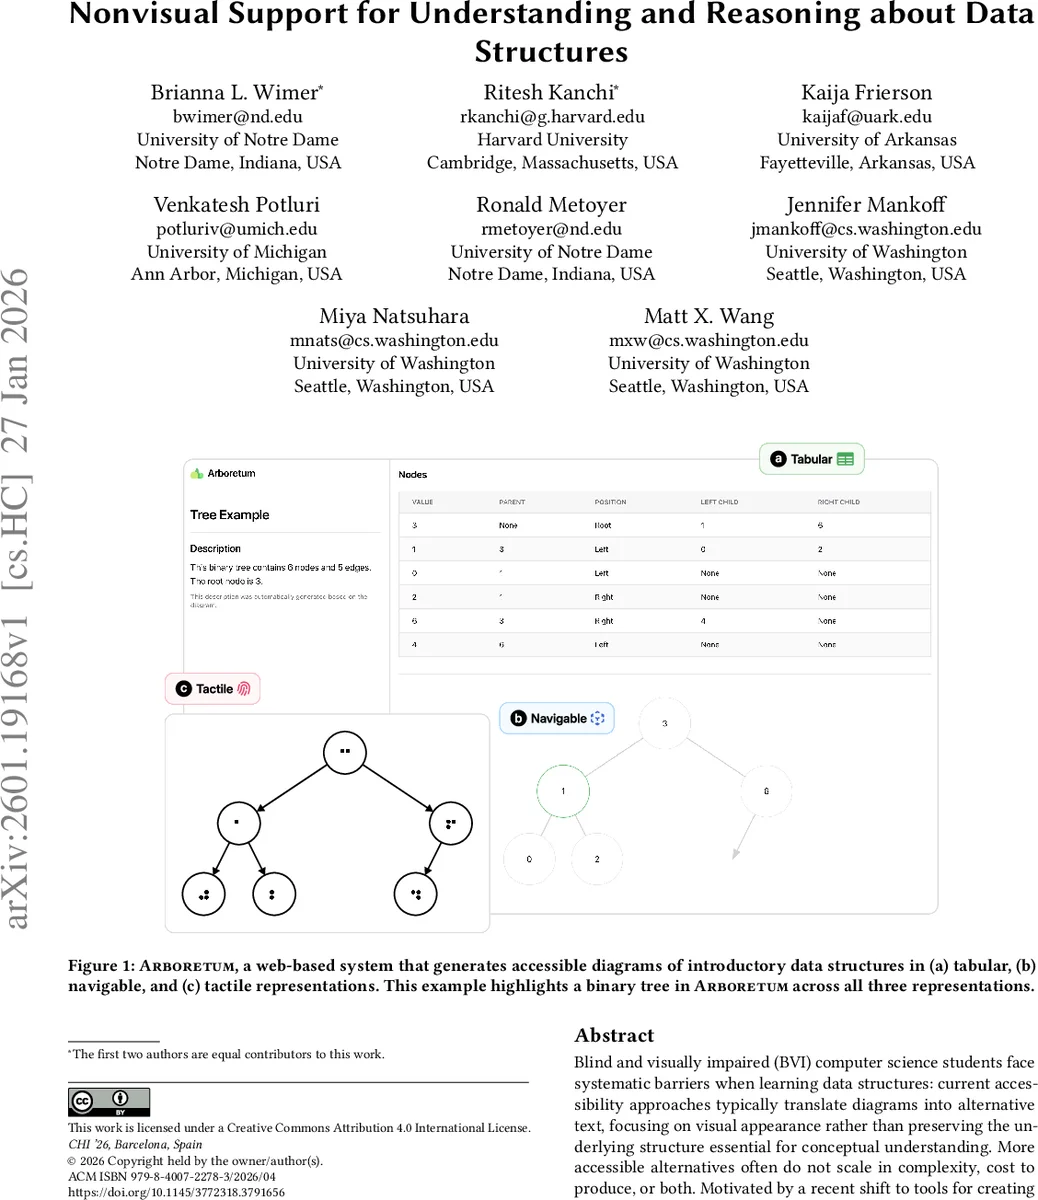
Guided by these requirements, the authors built Arboretum, a web‑based system that accepts a text‑based diagram specification and automatically produces:
- Tabular representation – a screen‑reader‑friendly table where each row encodes a node’s index/value and relational attributes, enabling linear reading and easy searching.
- Navigable representation – a keyboard‑driven interface that lets users traverse the structure using custom commands (e.g., “go to parent”, “next sibling”, “pre‑order”). The current focus is mirrored in the tabular view and highlighted in the tactile legend.
- Tactile representation – an SVG rendered for swell‑paper printing, preserving the exact spatial arrangement of nodes and edges; a digital legend supplies spoken labels for users unfamiliar with Braille.
All three views stay synchronized: moving the focus in one view updates the others instantly, supporting multimodal exploration.
The evaluation involved eight BVI learners performing five task types on arrays and binary trees: locating a specific element, identifying parent‑child relationships, spotting leaf nodes, verifying binary‑search‑tree properties, and executing a binary search. Results showed that the tactile view yielded the highest accuracy and lowest completion time for the most cognitively demanding tasks (binary search and BST verification). The tabular view was fastest for simple lookup and relationship queries. The navigable view, while conceptually promising, suffered from mismatches with existing screen‑reader navigation patterns, leading to higher effort; however, participants noted that a well‑designed custom navigation scheme could mitigate this issue. Importantly, participants consistently reported that having all three representations available simultaneously improved their overall comprehension, confirming the complementary nature of the multimodal approach.
In sum, the paper makes two major contributions: (1) introducing a novel method of preserving and exposing diagrammatic structure for BVI users by converting existing textual specifications into synchronized non‑visual formats, and (2) providing empirical evidence that multimodal non‑visual representations—especially when they include a tactile component—significantly enhance understanding and reasoning about data structures. Arboretum demonstrates a low‑cost, scalable solution that can be extended to more complex data structures and algorithms, offering a concrete pathway toward more inclusive CS curricula and informing future accessibility standards for educational visualizations.
Comments & Academic Discussion
Loading comments...
Leave a Comment