PENGUIN: General Vital Sign Reconstruction from PPG with Flow Matching State Space Model
Photoplethysmography (PPG) plays a crucial role in continuous cardiovascular health monitoring as a non-invasive and cost-effective modality. However, PPG signals are susceptible to motion artifacts and noise, making accurate estimation of vital sign…
Authors: Shuntaro Suzuki, Shuitsu Koyama, Shinnosuke Hirano
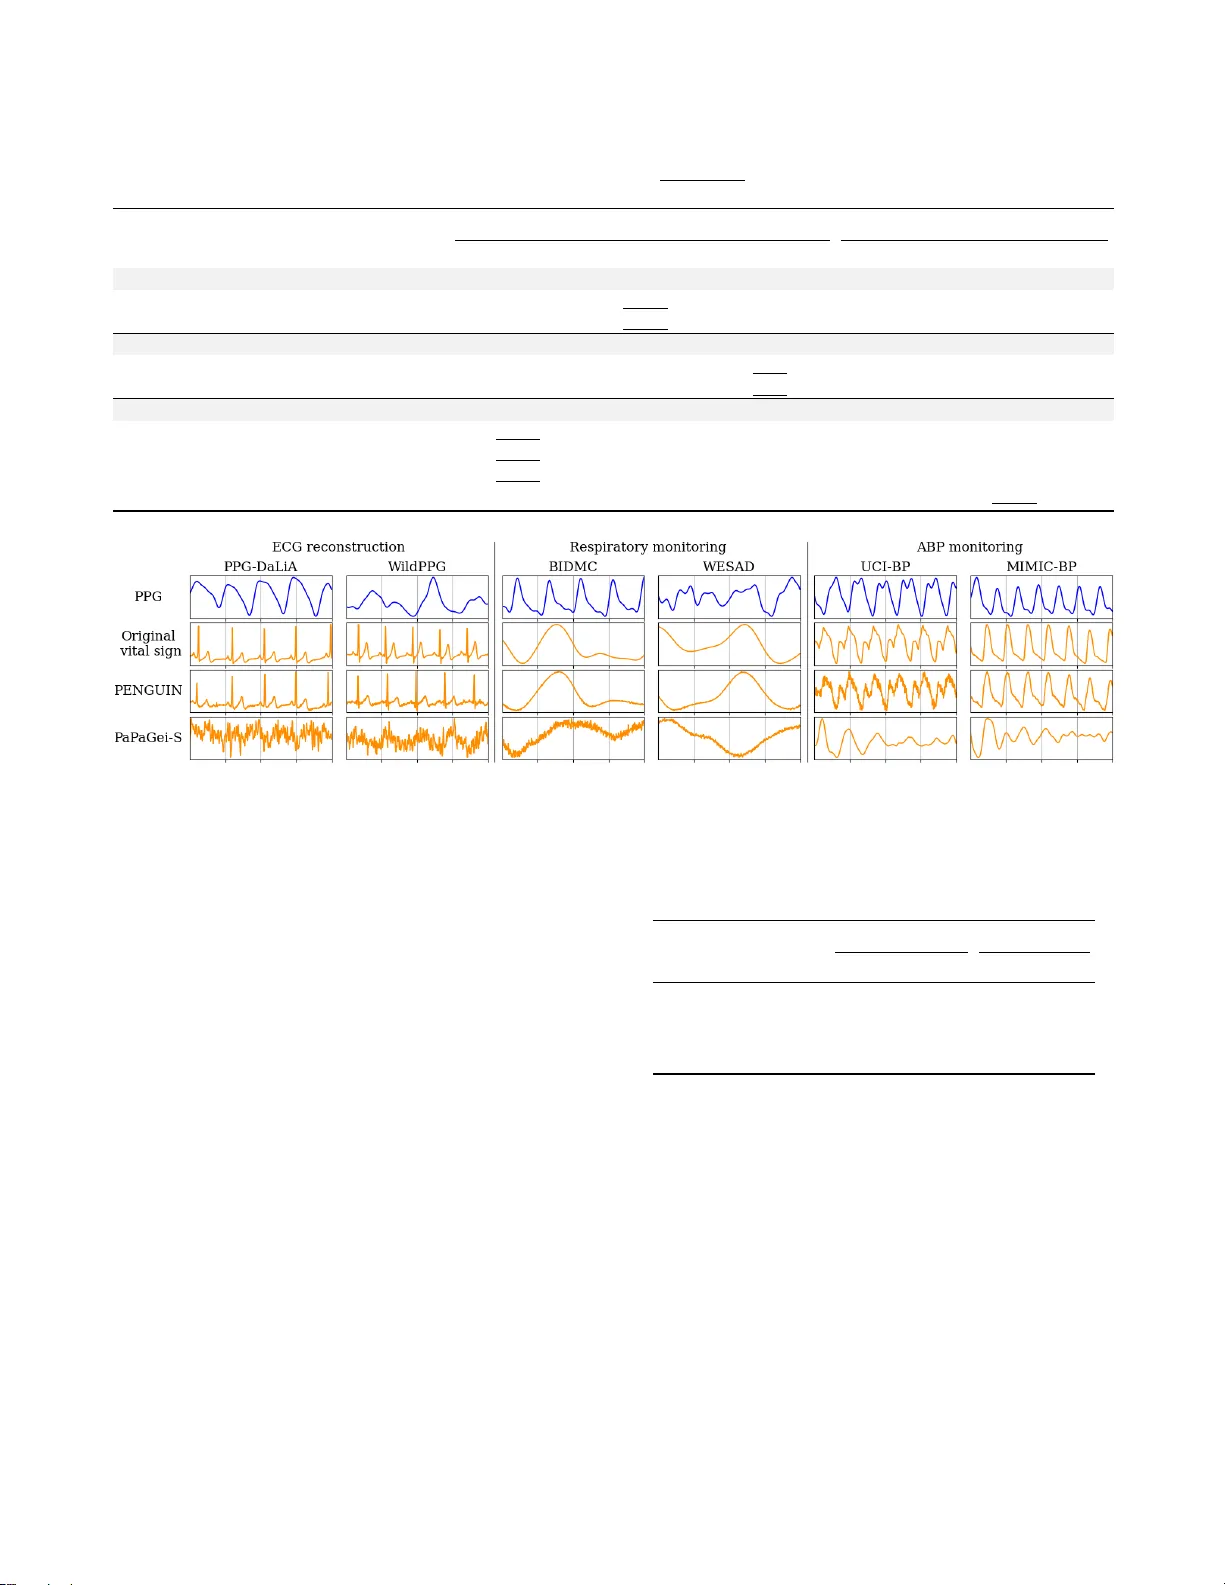
PENGUIN: GENERAL VIT AL SIGN RECONSTR UCTION FR OM PPG WITH FLO W MA TCHING ST A TE SP A CE MODEL Shuntar o Suzuki , Shuitsu K oyama, Shinnosuke Hirano, Shunya Na gashima Neurogica Inc. ABSTRA CT Photoplethysmography (PPG) plays a crucial role in contin- uous cardiov ascular health monitoring as a non-in vasi ve and cost-effecti ve modality . Howe ver , PPG signals are suscepti- ble to motion artifacts and noise, making accurate estimation of vital signs such as arterial blood pressure (ABP) chal- lenging. Existing estimation methods are often restricted to a single-task or environment, limiting their generalizability across di verse PPG decoding scenarios. Moreov er , recent general-purpose approaches typically rely on predictions ov er multi-second intervals, discarding the morphological characteristics of vital signs. T o address these challenges, we propose PENGUIN, a generative flo w-matching framew ork that extends deep state space models, enabling fine-grained conditioning on PPG for reconstructing multiple vital signs as continuous wav eforms. W e e valuate PENGUIN using six real-world PPG datasets across three distinct vital sign recon- struction tasks (electrocardiogram reconstruction, respiratory monitoring, and ABP monitoring). Our method consistently outperformed both task-specific and general-purpose base- lines, demonstrating PENGUIN as a general framew ork for robust vital sign reconstruction from PPG. Index T erms — photoplethysmography , electrocardiogra- phy , arterial blood pressure, respiratory rate, flo w matching 1. INTR ODUCTION Cardiov ascular disease (CVD) is one of the leading causes of mortality and morbidity worldwide, with an estimated 1.28 billion people affected by hypertension, a major risk f actor for CVD [1, 2]. Despite its prev alence, many individuals remain undiagnosed or unaware of their condition, highlighting the critical need for continuous monitoring of rele vant vital signs (e.g., heart rate and arterial blood pressure; ABP) to enable early detection of CVD. T o this end, a variety of measure- ment techniques targeting cardiov ascular metrics hav e been explored, including electrocardiography (ECG), impedance pneumography , and cuf f-based sphygmomanometry . Among various modalities, photoplethysmography (PPG), an optical technique measuring blood flow in the microvas- cular bed of tissue, has attracted considerable attention as Our code is av ailalbe at https://github .com/Neurogica/PENGUIN a non-in vasi ve, cost-effecti ve modality particularly well- suited for continuous, long-term monitoring of cardiov ascu- lar health [3, 4]. Its applications span a wide range, from clinical pulse oximeters to consumer health devices such as smartwatches and smart rings. Howe ver , compared to other monitoring techniques, PPG signals are highly susceptible to noise and motion artifacts [5, 6], and their quality is mark edly influenced by individual factors such as skin tone and body composition [7, 8]. These limitations make the accurate estimation of vital signs particularly challenging. Therefore, v arious PPG decoding methods have been ex- plored [9, 10, 11]. Howe ver , most of these models are tailored to a single task or en vironment, limiting their generalizability across di verse PPG decoding scenarios. Although a few re- cent models, such as PaPaGei [12], have been proposed to predict multiple vital signs from PPG, they rely on discrete predictions at multi-second interv als, limiting their ability to capture the morphological characteristics of vital signs (e.g., LF/HF ratio from ECG and vascular stif fness from ABP). In this study , we propose PENGUIN, a model capable of reconstructing multiple vital signs from PPG as continuous wa veforms. This enables fine-grained monitoring of vital signs, including their morphological characteristics. PEN- GUIN lev erages the Optimal Transport Conditional Flo w Matching (O T -CFM) framework [13], enabling high-quality generation of vital signs directly from their corresponding PPG signals with only a few sampling steps. Furthermore, by extending deep state space models (SSMs) [14, 15], we introduce a dual-stream Flow-SSM block. This architecture explicitly models PPG and vital signs in parallel, thereby en- abling fine-grained PPG conditioning. Experimental results demonstrate that the proposed model outperforms previ- ous works, including task-specific models, across six PPG datasets covering the reconstruction of three distinct vital signs (ECG, respiratory wa veform, and ABP). T o the best of our kno wledge, this is the first study to address the continuous reconstruction of multiple vital signs from PPG. 2. RELA TED WORKS PPG signals are modulated by various vital signs, and deep learning-based approaches for vital sign estimation hav e been extensi vely inv estigated, as summarized in [16, 4]. A sub- Fig. 1 . Frame work of PENGUIN . (a) A stack of Flo w-SSM blocks outputs the deri vati ve of the vital sign flo w , conditioned on PPG. (b) S5 layer [14], a variant of SSMs, is e xtended for sequence modeling. (c) PENGUIN is built upon the flow matching framew ork [13]. stantial body of work relies on CNNs, demonstrating their effecti veness across div erse tasks, including heart rate esti- mation [17, 18] and ABP monitoring [19, 20]. Despite these successes, prior studies face two k ey limita- tions. First, many studies are restricted to a single task or en- vironment, limiting their generalizability to broader PPG de- coding scenarios. T o address this, a fe w recent w orks [21, 12] hav e designed a model capable of predicting multiple vital signs from PPG. Second, previous approaches predict vital signs in a discrete manner at fix ed intervals of se veral seconds, thereby discarding the morphological characteristics inher- ent in wav eforms. T o overcome this limitation, recent stud- ies such as RDDM [22] and RespDiff [11] reconstruct vi- tal sign wav eforms directly by lev eraging generativ e frame- works [23, 24]. Nev ertheless, existing approaches still fall short of addressing both challenges simultaneously (i.e., de- veloping a model capable of reconstructing multiple vital sign wa veforms from PPG), lea ving a significant gap in the field. 3. PR OPOSED METHOD W e propose PENGUIN, a generativ e flow matching frame- work capable of reconstructing multiple vital sign w aveforms (e.g., ECG) from noise, conditioned on PPG. Fig. 1 sho ws the ov erall framew ork of our proposed method. 3.1. Flow Matching Formulation W e begin by deriving the basic principles of OT -CFM [13], upon which our model is built. Continuous Normalizing Flows (CNFs) [25] such as OT -CFM constitute a family of generativ e models that learn conditional mappings from a prior distribution x 0 ∼ p 0 to a data distrib ution x 1 ∼ p 1 . In our method, we adopt p 0 = N (0 , 1) and condition on PPG signals z ∈ R K , with the goal of mapping to the distrib ution p 1 of vital signs over R K . Here, K denotes the sequence length of the PPG signal and the corresponding vital signs. In CNFs, we consider a probability path ( p t ) 0 ≤ t ≤ 1 that pushes p 0 tow ards p 1 (a.k.a. flow). The gradient of x t ∼ p t is modeled by a time-dependent velocity field u : [0 , 1] × R K × R K → R K , defined through the following ODE: d x t = u t ( x t | z ) . (1) By parameterizing the velocity field with a neural network u θ t , the CNF objective, kno wn as the flo w matching loss, can be expressed as the follo wing regression: L FM ( θ ) = E t,p t ( x t ) || u θ t ( x t | z ) − u t ( x t | z ) || 2 . (2) Howe ver , in Eq. 2, the distribution p t is unknown, making it intractable to directly deriv e u t . As an alternativ e, CNFs employ the conditional flo w matching loss, defined as L CFM ( θ ) = E t,p t ( x t | x 1 ) ,p 1 ( x 1 ) || u θ t ( x t | z ) − u t ( x t | x 1 , z ) || 2 . (3) Eq. 3 has been proven to hav e an identical gradient as Eq. 2 w .r .t. θ [13]. In O T -CFM, the probability path from p 0 to p 1 is learned as the shortest transport path, enabling high-quality sampling e ven with a small number of sampling steps. In this formulation, the flo w is given by x t = (1 − t ) x 0 + t x 1 , and the corresponding velocity field is u t ( x t | x 1 , z ) = x 1 − x 0 . After training u θ t , an arbitrary ODE solver can be used to generate the synthesized vital sign ˆ x 1 ∈ R K from x 0 (Fig. 1(c)). In this w ork, we adopt Heun’ s method [26], which has shown promising results in generati ve sampling [27]. 3.2. Deep State Space Model F ormulation T o model PPG and vital sign wa veforms, we extend S5 [14], a variant of SSMs [28, 15] (Fig. 1(b)). SSMs, inspired by state space representations in control theory [29], have re- cently emerged as powerful architectures for long-sequence modeling [28], making them a natural choice for capturing the temporal dependencies in physiological signals. In S5, the input sequence ˜ x t,k ∈ R n is mapped to the output sequence y t,k ∈ R n through latent states h t,k ∈ R m as follows: h t,k = ¯ Ah t,k − 1 + ¯ B ˜ x t,k , y t,k = ¯ C h t,k + ¯ D ˜ x t,k , (4) where ˜ x t,k denotes the k -th timestep of the embedded se- quence of x t , and n is the embedding dimension while m is the latent state dimension. Moreover , ¯ A ∈ R m × m denotes the discretized state transition matrix, whereas ¯ B ∈ R m × n , ¯ C ∈ R n × m , and ¯ D ∈ R n × n denote the projection matrices. 3.3. Model Architecture Fig. 1(a) presents the architecture of the proposed method. W e extend S5 and introduce a dual-stream Flow-SSM block that jointly models PPG and vital signs, enabling fine-grained conditioning on PPG for vital sign reconstruction. The ar- chitecture takes as input ˆ x t , z , and the timestep t of the probability path in OT -CFM. After embedding ˆ x t and z with one-dimensional conv olutional layers, the inputs are passed through a stack of L Flo w-SSM blocks to output d ˆ x t . Each Flow-SSM block adopts a dual-stream structure composed of LayerNorm [30], FiLM [31], S5, a scaling op- eration, and a feed-forward network. FiLM and the scaling operation are employed for conditioning on t . In FiLM, the scale parameter γ and shift parameter β of LayerNorm, and in the scaling operation, the scale parameter α , are learnable pa- rameters deri ved from the sinusoidal encoding of t , enabling feature distrib ution transformations that depend on t . Further- more, conditioning of ˆ x t on z is realized through an additi ve operation after a linear projection. While cross-attention or post-concatenation mappings are commonly used for cross- modal conditioning [32], in our setting ˆ x t and z are tem- porally aligned, making timestep-wise conditioning crucial (e.g., the systolic peak in PPG should closely align with the R-peak in ECG). Therefore, we apply a simple additi ve op- eration at each timestep, enabling fine-grained, per-timestep conditioning of vital-sign reconstruction on PPG. 4. EXPERIMENTS 4.1. Datasets and Data Pre-pr ocessing W e ev aluate PENGUIN on six real-world PPG datasets across three vital sign reconstruction tasks (ECG reconstruction, res- piratory monitoring, and ABP monitoring). Although the pro- posed frame work is not limited to these tasks, follo wing prior revie ws [16, 4], we focus on ECG, respiratory rate, and ABP , as these represent the primary tar gets in PPG-based vital sign reconstruction. For each task, we selected datasets as follows: PPG-DaLiA [33] and WildPPG [34] for ECG reconstruction, BIDMC [35] and WESAD [36] for respiratory monitoring, and UCI-BP [37] and MIMIC-BP [38] for ABP monitoring. For pre-processing, we follo wed protocols in prior works [11, 22, 39]. All signals were resampled to a uniform fre- quency of 128 Hz. PPG was band-pass filtered with a Butter- worth filter (0.5-4 Hz), then standardized using z-scores and scaled to the range [-1, 1]. ECG was high-pass filtered at 0.5 Hz using a Butterworth filter , followed by the same standard- ization and scaling procedure. The respiratory rate was low- pass filtered at 1 Hz and likewise standardized and scaled. Finally , for ABP , no further pre-processing was applied, as its amplitude carries critical physiological meaning (See 4.2). Across all datasets, we adopt a cross-subject paradigm, partitioning each dataset into training, validation, and test splits at a 6:1:1 ratio with no subject ov erlap. 4.2. Evaluation Metrics T o assess the utility of the reconstructed vital signs, we employed well-established task-specific ev aluation metrics following prior studies [22, 39, 11]. For ECG reconstruction, we computed the mean absolute error (MAE) of heart rate in beats per minute (bpm) between the reconstructed and ground-truth ECG, where heart rate was estimated from the ECG using the Hamilton method [40] with an 8-second win- dow (hereafter denoted as HR Error). For respiratory moni- toring, we obtained the respiratory rate by applying a Fourier transform to both reconstructed and ground-truth respiratory wa veforms, identifying the dominant non-negativ e frequency , and calculating the MAE in bpm with a 60-second windo w (hereafter RR Error). For ABP monitoring, we ev aluated the MAE (mmHg) of systolic and diastolic blood pressures ov er an 8-second window , corresponding to the maximum and minimum v alues of the ABP wav eform, respectiv ely (hereafter SBP Error and DBP Error). 4.3. Implementation Details W e trained the model with AdamW optimizer [41] ( β 1 = 0 . 9 , β 2 = 0 . 999 ) at a learning rate of 1 . 0 × 10 − 3 , batch size 64, for up to 300 epochs, using early stopping with patience set to 10 epochs. The hyperparameters were set to block num- ber L = 4 , embedding dimension n = 128 , and latent state dimension m = 256 . At inference, we use 25 sampling steps. 4.4. Results and Discussion T able 1 presents a quantitative comparison of the proposed method across six real-w orld PPG datasets. As a direct base- line, we included PaP aGei-S [12], a recent PPG decoding method capable of handling multiple vital signs. W e further compared our method with CycleGAN [9], RDDM [22], and T able 1 . Quantitative comparison across six PPG datasets. Bold and underlined values denote the best and second-best perfor- mance, respectiv ely . Parentheses indicate the performance mar gin between the proposed method and the best baseline. Dataset Metric Specialist Model Generalist Model CycleGAN [9] RDDM [22] RespDiff [11] PaP aGei-S [12] PENGUIN ECG Reconstruction PPG-DaLiA [33] HR Error [bpm] 23.61 16.43 22.75 40.89 15.64 ( -0.79 ) W ildPPG [34] 23.21 16.02 20.57 55.42 12.97 ( -3.05 ) Respiratory Monitoring BIDMC [35] RR Error [bpm] 9.78 13.88 3.71 4.48 2.98 ( -0.73 ) WESAD [36] 11.93 10.12 5.12 5.84 4.45 ( -0.67 ) ABP monitoring UCI-BP [37] SBP Error [mmHg] 25.79 44.37 78.83 37.01 12.61 ( -13.18 ) DBP Error [mmHg] 12.76 16.57 26.13 13.34 7.14 ( -5.62 ) MIMIC-BP [38] SBP Error [mmHg] 20.26 22.84 97.65 38.42 17.43 ( -2.83 ) DBP Error [mmHg] 10.49 11.83 19.75 11.52 11.34 ( +0.85 ) Fig. 2 . Qualitative comparison of reconstructed vital signs from PPG o ver a 4-second se gment. RespDiff [11], which represent recent approaches tailored to specific vital sign reconstruction tasks from PPG. As sho wn in the table, the proposed method consistently outperformed all baselines in terms of HR error , RR error , SBP error , and DBP error , with the sole exception of DBP error on the MIMIC-BP dataset. These findings suggest that the proposed method is broadly applicable to di verse PPG decoding scenarios, high- lighting its potential for multiple vital sign reconstructions. Fig. 2 illustrates a qualitative comparison of reconstructed vital signs from PPG over a 4-second segment. The pro- posed method reliably preserves the morphological charac- teristics of the original vital signs, capturing sharp spikes in ECG reconstruction (i.e., QRS complex), reproducing respi- ratory rhythms that differ from PPG periodicity , and main- taining precise amplitude in ABP monitoring. T o further assess the proposed method, we conducted ab- lation studies as sho wn in T able 2. W e compared four config- urations: (i) the proposed method; (ii) without FiLM condi- tioning; (iii) without Shift conditioning; and (i v) without PPG conditioning (i.e., synthesizing vital signs solely from noise). On the PPG-DaLiA and W ildPPG datasets, all Model variants (ii–iv) exhibited higher HR Error than Model (i), indicating that each conditioning contributes to performance improve- ment, with PPG conditioning ex erting the greatest impact. T able 2 . Ablation study on conditioning strategies. Bold in- dicates the best performance. Model PPG-DaLiA [33] W ildPPG [34] HR Error [bpm] (i) PENGUIN 15.64 12.97 (ii) w/o FiLM cond. 16.30 13.24 (iii) w/o Shift cond. 15.72 13.05 (iv) w/o PPG cond. 24.40 21.75 5. CONCLUSION In this study , we introduced PENGUIN, a generativ e flow- matching framew ork for reconstructing multiple vital signs as continuous wa veforms from PPG. By extending deep state space models with a dual-stream Flow-SSM block, our method achieves fine-grained, per-timestep conditioning on PPG, thereby preserving the morphological fidelity of vi- tal signs. Comprehensiv e ev aluation across six real-world datasets covering ECG reconstruction, respiratory monitor- ing, and ABP monitoring demonstrated consistent improve- ments ov er both task-specific and general-purpose baselines. Future directions include v alidating the framework across a wider range of vital signs and enabling flexible windo wing. 6. REFERENCES [1] Fl ´ avio D Fuchs et al., “High Blood Pressure and Cardiov ascu- lar Disease, ” Hypertension , v ol. 75, no. 2, pp. 285–292, 2020. [2] W orld Health Organization (WHO), “Hyperten- sion, ” https://www.who.int/news- room/ fact- sheets/detail/hypertension , March 2023, Accessed: 2025-09-03. [3] Peter H Charlton and othres, “The 2023 wearable photo- plethysmography roadmap, ” Physiological measurement , vol. 44, no. 11, pp. 111001, 2023. [4] Guangkun Nie et al., “A revie w of deep learning methods for photoplethysmography data, ” arXiv preprint arXiv:2401.12783 , 2024. [5] Carla Alfonso et al., “ Agreement between two photoplethysmography-based wearable devices for moni- toring heart rate during different physical activity situations: a new analysis methodology , ” Scientific r eports , vol. 12, no. 1, pp. 15448, 2022. [6] Brinnae Bent et al., “In vestigating sources of inaccuracy in wearable optical heart rate sensors, ” NPJ digital medicine , v ol. 3, no. 1, pp. 18, 2020. [7] Antti Puranen et al., “Effect of skin tone and acti vity on the performance of wrist-worn optical beat-to-beat heart rate mon- itoring, ” in IEEE SENSORS , 2020, pp. 1–4. [8] Ajmal et al., “Monte Carlo analysis of optical heart rate sen- sors in commercial wearables: the effect of skin tone and obe- sity on the photopleth ysmography (PPG) signal, ” Biomed. Opt. Expr ess , vol. 12, no. 12, pp. 7445–7457, Dec 2021. [9] Seyed Amir Hossein Aqajari et al., “An End-to-End and Accu- rate PPG-based Respiratory Rate Estimation Approach Using Cycle Generativ e Adversarial Networks, ” in EMBC , 2021, pp. 744–747. [10] Y uta Nambu et al., “CardioFlow: Learning to Generate ECG from PPG with Rectified Flow, ” in ICASSP , 2025, pp. 1–5. [11] Y uyang Miao et al., “RespDiff: An End-to-End Multi-scale RNN Diffusion Model for Respiratory W aveform Estimation from PPG Signals, ” in ICASSP , 2025. [12] Arvind Pillai et al., “PaPaGei: Open Foundation Models for Optical Physiological Signals, ” in ICLR , 2025. [13] Y aron Lipman et al., “Flow Matching for Generative Model- ing, ” in ICLR , 2023. [14] Jimmy T .H. Smith et al., “Simplified State Space Layers for Sequence Modeling, ” in ICLR , 2023. [15] Albert Gu and T ri Dao, “Mamba: Linear-T ime Sequence Mod- eling with Selectiv e State Spaces, ” in CoLM , 2024. [16] Emad Kasae yan Naeini et al., “A Deep Learning–based PPG Quality Assessment Approach for Heart Rate and Heart Rate V ariability, ” HEALTH , v ol. 4, no. 4, pp. 1–22, 2023. [17] Kechris, Christodoulos and others, “RMSSD Estimation From Photoplethysmography and Accelerometer Signals Using a Deep Con volutional Netw ork, ” in EMBC , 2021, pp. 228–231. [18] Seok Bin Song et al., “N AS-PPG: PPG-Based Heart Rate Es- timation Using Neural Architecture Search, ” Sensors , vol. 21, no. 13, pp. 14941–14949, 2021. [19] Y iming Zhang et al., “A Refined Blood Pressure Estima- tion Model Based on Single Channel Photoplethysmography , ” JBHI , vol. 26, no. 12, pp. 5907–5917, 2022. [20] Y ongyi Chen et al., “A new deep learning framework based on blood pressure range constraint for continuous cuf fless BP estimation, ” Neural Networks , v ol. 152, pp. 181–190, 2022. [21] Salar Abbaspourazad et al., “Large-scale Training of Founda- tion Models for W earable Biosignals, ” in ICLR , 2024. [22] Debaditya Shome et al., “Region-Disentangled Diffusion Model for High-Fidelity PPG-to-ECG Translation, ” in AAAI , 2024, vol. 38, pp. 15009–15019. [23] Ian J Goodfellow et al., “Generative Adversarial Networks, ” in NeurIPS , 2014, vol. 27. [24] Jonathan Ho et al., “Denoising Diffusion Probabilistic Mod- els, ” in NeurIPS , 2020, v ol. 33, pp. 6840–6851. [25] Ricky T . Q. Chen and ohters, “Neural Ordinary Dif ferential Equations, ” in NeurIPS , 2018, v ol. 31. [26] George F Carrier et al., Ordinary Differ ential Equations , SIAM, 1991. [27] Y ang Song et al., “Consistency Models, ” in ICML , 2023, vol. 202, pp. 32211–32252. [28] Albert Gu et al., “Efficiently Modeling Long Sequences with Structured State Spaces, ” in ICLR , 2022. [29] R. Kalman, “A New Approach to Linear Filtering and Predic- tion Problems, ” J . Basic. , vol. 82, no. 1, pp. 35–45, 1960. [30] Jimmy Lei Ba, “Layer normalization, ” arXiv preprint arXiv:1607.06450 , 2016. [31] Ethan Perez et al., “FiLM: V isual Reasoning with a General Conditioning Layer, ” in AAAI , 2018. [32] William Peebles et al., “Scalable Diffusion Models with Trans- formers, ” in ICCV , 2023, pp. 4195–4205. [33] Attila Reiss et al., “Deep PPG: Lar ge-Scale Heart Rate Esti- mation with Con volutional Neural Networks, ” Sensors , vol. 19 (3079), 2019. [34] Manuel Meier et al., “WildPPG: A Real-W orld PPG Dataset of Long Continuous Recordings, ” in NeurIPS , 2024, vol. 37, pp. 2246–2266. [35] Marco A. F . Pimentel et al., “T oward a Robust Estimation of Respiratory Rate From Pulse Oximeters, ” TBME , vol. 64, no. 8, pp. 1914–1923, 2017. [36] Philip Schmidt et al., “Introducing WESAD, a Multimodal Dataset for W earable Stress and Af fect Detection, ” in ICMI , 2018, p. 400–408. [37] Mohamad Kachuee et al., “Cuff-less high-accuracy calibration-free blood pressure estimation using pulse transit time, ” in ISCAS , 2015. [38] Ivandro Sanches et al., “MIMIC-BP: A curated dataset for blood pressure estimation, ” Scientific Data , vol. 11, no. 1, pp. 1233, 2024. [39] Dong-Kyu Kim et al., “DeepCNAP: A Deep Learning Ap- proach for Continuous Noninv asive Arterial Blood Pressure Monitoring Using Photoplethysmography , ” JBHI , vol. 26, no. 8, pp. 3697–3707, 2022. [40] P . Hamilton, “Open source ECG analysis, ” in Computers in Car diology , 2002, pp. 101–104. [41] Ilya Loshchilov et al., “Decoupled weight decay regulariza- tion, ” in ICLR , 2019.
Original Paper
Loading high-quality paper...
Comments & Academic Discussion
Loading comments...
Leave a Comment