Explicit Abstention Knobs for Predictable Reliability in Video Question Answering
High-stakes deployment of vision-language models (VLMs) requires selective prediction, where systems abstain when uncertain rather than risk costly errors. We investigate whether confidence-based abstention provides reliable control over error rates …
Authors: Jorge Ortiz
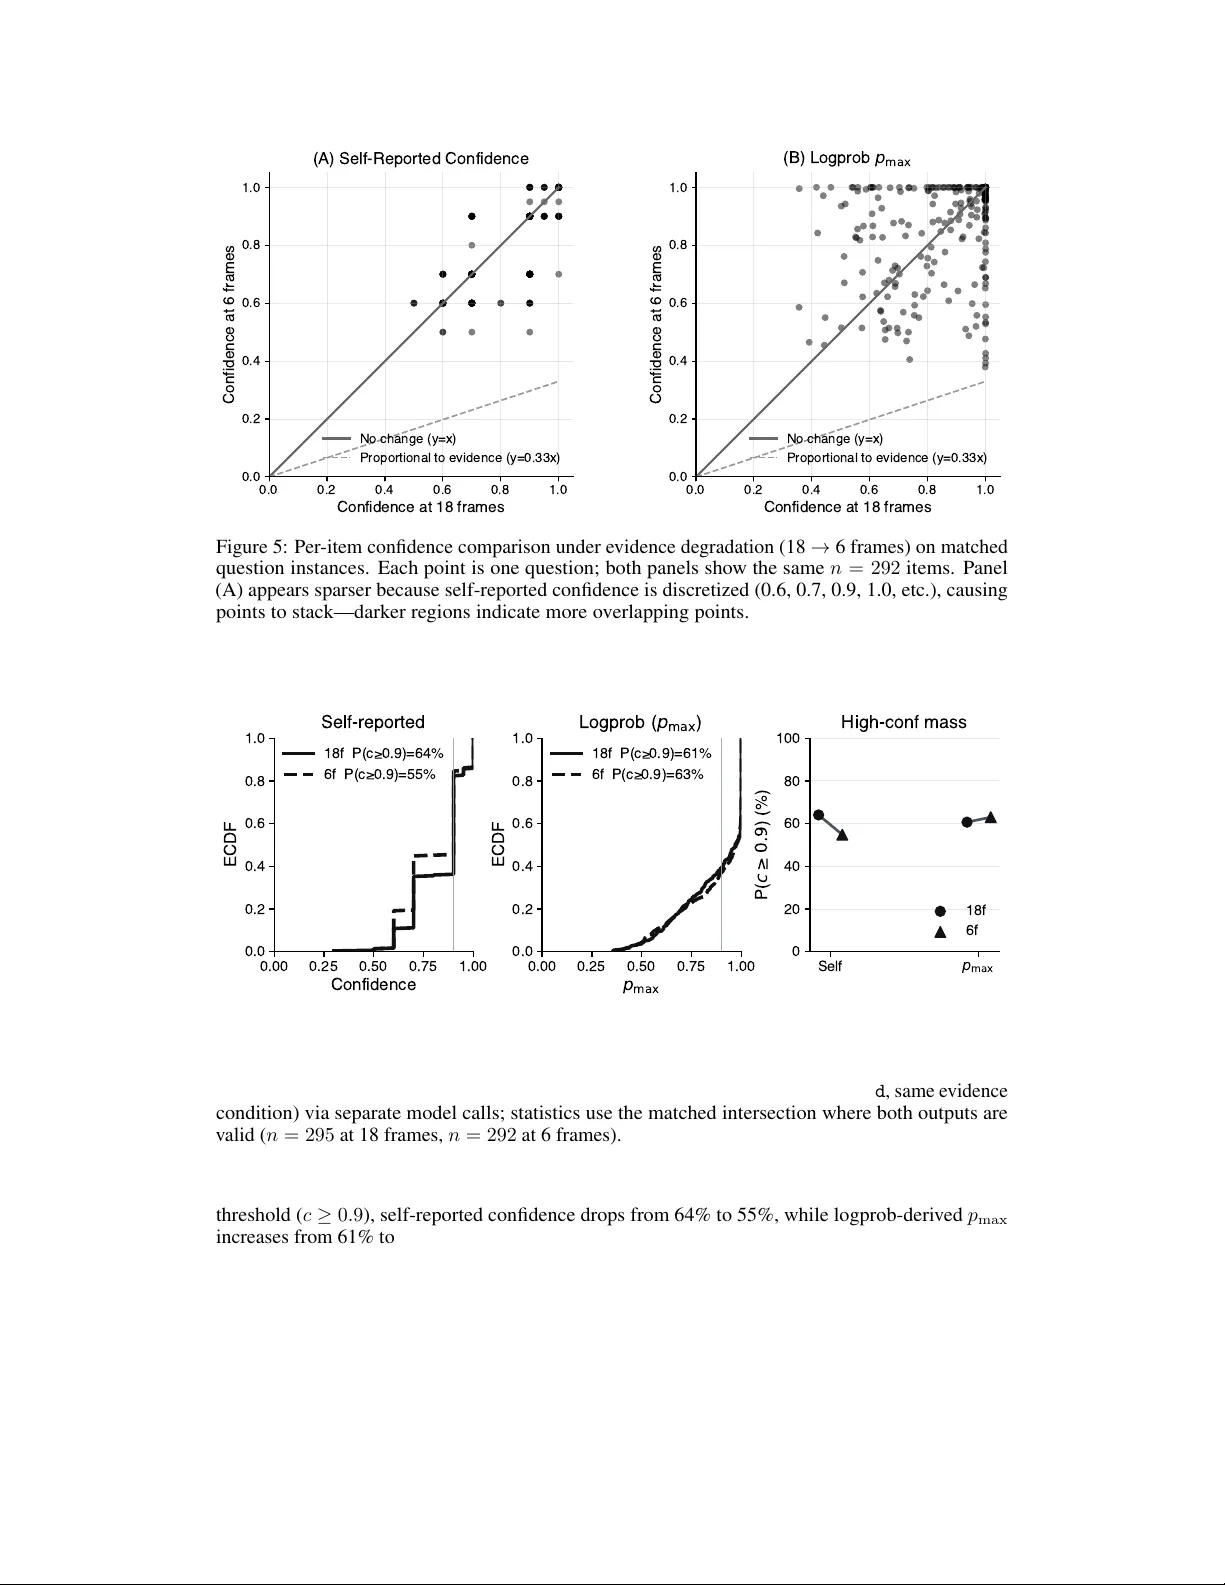
Explicit Abstention Knobs f or Pr edictable Reliability in V ideo Question Answering Jorge Ortiz Department of Electrical and Computer Engineering Rutgers Univ ersity New Brunswick, NJ 08901 jorge.ortiz@rutgers.edu Abstract High-stakes deployment of vision-language models (VLMs) requires selective prediction, where systems abstain when uncertain rather than risk costly errors. W e in vestigate whether confidence-based abstention provides reliable control o ver error rates in video question answering, and whether that control remains rob ust under distribution shift. Using NExT -QA and Gemini 2.0 Flash, we establish two findings. First, confidence thresholding provides mechanistic control in-distrib ution. Sweeping threshold ε produces smooth risk-cov erage tradeof fs, reducing error rates from 23.6% to 9.4% at 63.7% cov erage with well-calibrated predictions (ECE = 0.018). Second, this control is not epistemic. Under evidence degradation (18 frames reduced to 6), the model’ s confidence distribution contracts only modestly . Evaluating the same frozen question instances under both evidence conditions, median self-reported confidence remains 0.9 in both regimes despite a 3 × reduction in visual information. W e corroborate this finding with logprob-deri ved confidence ( p max ), obtained via a separate prompt interf ace on matched question instances; this signal exhibits the same failure mode. The model does not “know when it does not kno w” under shift. These results motiv ate warrant-based selecti ve prediction, where confidence is explicitly bounded by what the av ailable evidence can support. 1 Introduction 1.1 Motivation V ision-language models (VLMs) are increasingly deployed for tasks requiring interpretation of visual information in conte xt, from medical image analysis to autonomous vehicle decision-making. In such high-stakes applications, systems must have the ability to abstain when uncertain rather than risk costly errors. This capability , kno wn as selective pr ediction [Geifman and El-Y aniv, 2017, El-Y ani v and Wiener, 2010], allows trading cov erage (fraction of inputs answered) for reduced error rates among predictions that are made. Modern VLMs typically provide confidence scores alongside predictions. A natural approach to selectiv e prediction is confidence-based abstention , where predictions are accepted only when confidence exceeds a threshold ε . The central question is whether model-reported confidence provides reliable epistemic information about prediction quality . For confidence to support reliable selecti ve prediction, two properties are necessary: 1. In-distribution control : Sweeping ε should yield smooth, monotone risk-cov erage tradeof fs. Higher thresholds should reliably reduce error rates among accepted predictions. Preprint. 2. Robustness to evidence shifts : When input quality degrades (e.g., fe wer frames in video, lower resolution), confidence should decrease accordingly . The model should “know when it does not know” due to insuf ficient e vidence. The first property is often demonstrated in practice; the second remains poorly understood. If confi- dence is insensitiv e to evidence quality , confidence-based gates provide a false sense of security . The system appears to abstain appropriately in-distribution, b ut confidence contracts insufficiently under degraded e vidence conditions. Selectivity increases only modestly despite substantial information loss. 1.2 This W ork W e ev aluate confidence-based abstention for video question answering (V ideoQA). V ideoQA is well- suited for this study because evidence quality can be precisely controlled through frame sampling. W e use NExT -QA [Xiao et al., 2021] with Gemini 2.0 Flash to test whether confidence behaves mechanistically (smoothly monotone with threshold changes) and whether it remains calibrated under controlled evidence de gradation. Our contributions are: 1. Confidence-based abstention provides mechanistic control in-distribution . Sweeping threshold ε produces smooth, monotone risk-coverage curv es with a clear operating regime (63.7% cov erage, 9.4% error vs. 98.7% coverage, 23.6% error). 2. This control is not epistemic . Ev aluating the same frozen question instances under both 18-frame and 6-frame evidence conditions, the model’ s confidence distribution contracts insufficiently . Median self-reported confidence remains 0.9 in both regimes despite a 3 × reduction in visual information. W e corroborate this finding with logprob-deri ved confidence ( p max ), obtained via a separate prompt interface on matched question instances; this signal exhibits the same failure mode. Confidence does not track information av ailability . 3. The gap between mechanistic control and epistemic validity motivates warrant-based selective prediction , where confidence is bounded by what the available evidence can support. Our results validate the need for such mechanisms but do not yet demonstrate their implementation. A system deployed under v arying evidence conditions (e.g., intermittent video feeds, lossy compres- sion) cannot rely on confidence thresholds tuned in-distribution. The threshold that achiev es 9% error at 63.7% cov erage on full e vidence yields 9% error at only 53.7% cov erage when evidence is degraded. 2 Related W ork W e situate our work within sev eral related areas: selectiv e prediction, calibration under shift, confor- mal risk control, epistemic uncertainty , selective QA, multimodal uncertainty , mechanism design, and video QA benchmarks. 2.1 Selective Pr ediction and Abstention Selectiv e prediction (classification with a reject option) allows models to abstain when uncertain, trading coverage for reduced error rates. The foundational work of Chow [1970] established the optimal reject rule: a confidence threshold that minimizes misclassification risk giv en a cost for abstaining. El-Y ani v and W iener [2010] formalized the risk-cov erage frame work for selecti ve classification, characterizing conditions under which softmax confidence yields near-optimal selective classifiers. Modern deep learning has revi ved interest in selectiv e prediction. Geifman and El-Y aniv [2017] demonstrated that softmax-based thresholding pro vides smooth risk-cov erage tradeoffs for DNNs on image classification, achie ving 2% top-5 error on ImageNet at 60% cov erage. Geifman and El-Y aniv [2019] proposed Selecti veNet, which jointly trains a classifier and rejection head to optimize cov erage at a target error rate, rather than relying on pure confidence thresholding. Franc et al. [2023] 2 deri ved optimal reject strategies in closed form and introduced the “proper uncertainty score” concept, proving these achie ve the best possible error -coverage tradeof f for any gi ven model. Recent work addresses calibration requirements for selecti ve prediction. Fisch et al. [2022] showed that standard selectiv e classifiers can be poorly calibrated on accepted predictions (“uncertain uncer- tainty”), and proposed methods ensuring that accepted predictions are well-calibrated. Hendrycks and Gimpel [2017] established maximum softmax probability as the canonical baseline for detecting misclassified and out-of-distribution e xamples, directly relev ant to confidence-based abstention. Where our work differs: W e are not proposing a new selector; we are diagnosing that e ven a clean selector knob can be non-epistemic under evidence loss. 2.2 Selective Pr ediction Under Distribution Shift A critical question is whether selective classifiers remain reliable under distrib ution shift. Liang et al. [2024] generalize selecti ve classification to handle cov ariate and label shift, noting that traditional methods assumed i.i.d. data and introducing confidence scoring functions that improve reliability on shifted data. Heng and Soh [2025] revisit selecti ve prediction through the Ne yman-Pearson lens, sho wing that the optimal acceptance rule is a likelihood-ratio test. They e valuate under co variate shift and propose new selection scores combining distance-from-training-data with model logits, finding improv ed robustness. Howe ver , both works study distributional perturbation (domain adaptation, co variate corruption) rather than inf ormation r emoval . Our work introduces a distinct type of shift, evidence-completeness degradation via temporal subsampling. 2.2.1 Evidence T runcation and Partial Observability Most selectiv e prediction and calibration-under-shift work studies cov ariate shift, corruption shift, or domain adaptation, where inputs change but the underlying evidence may remain sufficient for the task. In contrast, our shift is an intervention on information a v ailability . T emporal subsampling removes evidence about e vent order and persistence, which can reduce the Bayes-optimal predictability of many V ideoQA questions. This places the setting closer to partial observability than to con ventional corruption benchmarks. As a result, success requires not only monotone risk-coverage behavior under a fixed regime, but also that confidence contracts in response to reduced observability , a property not implied by standard selective classification or calibration results. Our experiments show that Gemini’ s confidence distrib ution shifts only modestly under a 3 × reduction in frames, e ven when selectiv e prediction remains monotone, motiv ating evidence-conditioned constraints rather than confidence-only gating. 2.3 Calibration Under Distribution Shift Calibration requires that predicted probabilities reflect true outcome frequencies. Guo et al. [2017] showed that modern DNNs are often ov erconfident and that temperature scaling provides ef fecti ve post-hoc calibration in-distribution. Hendrycks and Dietterich [2019] introduced the ImageNet-C/P corruption benchmarks as a canonical setting for ev aluating robustness under “corruption shift, ” which we contrast against our “e vidence completeness shift. ” Ovadia et al. [2019] conducted a large-scale study of predictiv e uncertainty under dataset shift, finding that post-hoc calibration “falls short” while ensemble methods retain calibration across shifts. Lakshminarayanan et al. [2017] showed that deep ensembles capture uncertainty ef fectiv ely without Bayesian machinery , often outperforming single models under shift. Gal and Ghahramani [2016] introduced MC dropout as an approximate Bayesian uncertainty method. Zou et al. [2023] proposed Adaptiv e Calibrator Ensemble (A CE), which trains calibrators on both in-distrib ution and challenging OOD data. These studies focus on co variate shifts where the input distrib ution changes b ut the mapping from inputs to outputs remains valid. Our e vidence de gradation interv ention is dif ferent. The input contains less information about the answer . 3 2.4 Conformal Pr ediction and Risk Control Conformal prediction [V o vk et al., 2022, Shafer and V o vk, 2008] provides distribution-free co verage guarantees: prediction sets that contain the true label with probability at least 1 − α , without distributional assumptions beyond exchangeability . Angelopoulos and Bates [2023] provide an accessible tutorial showing conformal methods applied to modern deep learning. The closest “contract-like” alternativ e to our warrant constraint is Conformal Risk Control. An- gelopoulos et al. [2024] extend conformal prediction from coverage sets to controlling expected loss, with variants that address certain types of shift. Xu et al. [2025] combine selective classification with conformal prediction in Selecti ve Conformal Risk Control (SCRC), a tw o-stage approach that first filters uncertain inputs, then constructs conformal sets for accepted inputs. Howe ver , conformal methods control mar ginal risk under exchangeability (or specified relaxations), not an explicit bound by information-theoretic observ ability . If we want assurance that this particular pr ediction is reliable giv en this particular input’s information content , conformal methods do not directly provide it. Our warrant-based framing seeks per-instance guarantees where confidence is bounded by what the specific evidence can support. 2.5 Epistemic Uncertainty and Information-Theor etic Bounds Epistemic uncertainty (model uncertainty due to limited knowle dge) is distinct from aleatoric uncer- tainty (inherent randomness in data). Bayesian neural networks and Monte Carlo Dropout [Gal and Ghahramani, 2016] estimate epistemic uncertainty via posterior v ariance. Lakshminarayanan et al. [2017] showed that deep ensembles capture uncertainty ef fecti vely without Bayesian machinery . Information theory provides fundamental limits on predictability . Fano’ s inequality connects condi- tional entropy H ( Y | X ) to minimum achiev able error: if features contain limited information about labels, no classifier can be highly accurate [Fano, 1961]. This implies an upper bound on justified confidence. Sensoy et al. [2018] operationalize this intuition through evidential deep learning, where models output Dirichlet distrib utions over classes. When evidence is weak, the Dirichlet is dif fuse, yielding high-entropy predictions. Our empirical e valuation tests whether VLM confidence actually respects such bounds in practice. When we reduce frame count, we reduce information about temporal e vents. A warrant-respecting model would lo wer confidence accordingly . W e find that Gemini’ s confidence distribution contracts only modestly . 2.6 Selective QA and Unanswerability The question of whether models “know what they don’t know” has been studied extensi vely in question answering. Rajpurkar et al. [2018] introduced SQuAD 2.0, treating unanswerability as a first-class outcome rather than an error mode. Kamath et al. [2020] studied selective QA under domain shift, sho wing that softmax-based abstention f ails under OOD conditions and proposing a calibrator-based approach. Most relev ant to our work, Whitehead et al. [2022] introduced Reliable VQA, explicitly framing the problem as “abstain rather than answer incorrectly . ” They use risk-coverage analysis in VQA and show that naiv e softmax thresholding can giv e extremely low cov erage at low risk. Our work extends this e v aluation style to video, with the nov elty being the controlled evidence-completeness intervention. 2.7 Uncertainty in Multimodal and VLM Systems Recent work has begun e xamining uncertainty and calibration specifically in vision-language models. Oh et al. [2024] study calibrated robust fine-tuning of VLMs, showing that standard fine-tuning degrades OOD calibration and proposing methods to impro ve both OOD accurac y and calibration jointly . Chen et al. [2025] analyze calibration and uncertainty beha vior in multimodal LLMs, introducing an “I don’t kno w” ev aluation dataset and finding that MLLMs tend to answer rather than admit uncertainty; they show that prompting strategies can improve self-assessment but do not eliminate miscalibration. W en et al. [2025] provide a comprehensiv e survey of abstention in LLMs, offering a taxonomy that distinguishes beha vioral refusal (alignment-driv en) from epistemic 4 abstention (uncertainty-dri ven), useful for positioning our “warrant” as an epistemic contract rather than a behavioral refusal. These works establish that multimodal models often do not self-assess uncertainty well, moti v ating our empirical in vestigation of whether confidence tracks e vidence quality in video understanding. 2.8 Mechanism Design for T rustworthy Deployment Mechanism design of fers an alternative perspecti ve. Instead of training models to be calibrated, design incentiv e structures that make honest confidence reporting optimal. Zhao and Ermon [2021] propose an insurance-based mechanism between forecasters and decision-makers, where the forecaster backs predictions with bets. Stakes are set so that truthful probability reporting is optimal, providing individual-le vel reliability guarantees. Proper scoring rules [Gneiting and Raftery, 2007] formalize incentives for honest probability forecasts. A strictly proper scoring rule (lik e log-loss) ensures that reporting true beliefs maximizes e xpected score. This connects to our w arrant concept. A warrant-respecting model ef fectiv ely commits to a contract where confidence is bounded by evidence-supportable accurac y . 2.9 V ideo Question Answering NExT -QA [Xiao et al., 2021] provides a benchmark for temporal and causal reasoning in video, dis- tinguishing descripti ve questions (answerable from single frames) from temporal questions (requiring ev ent ordering) and causal questions (requiring understanding of why e vents occur). This structure enables controlled ev aluation of e vidence requirements. Modern VLMs including Gemini [Gemini T eam et al., 2024] achie ve strong performance on video understanding tasks, but systematic e valuation of their confidence beha vior under evidence de grada- tion is lacking. Prior V ideoQA work focuses on accurac y metrics rather than confidence calibration or selecti ve prediction. Our work fills this gap by treating frame sampling as a controlled interv ention on evidence quality . 2.10 Summary: Our Contribution Existing work on selecti ve prediction and calibration studies ho w confidence thresholds trade coverage for accuracy under a fixed e vidence regime, and conformal prediction provides mar ginal distribution- free guarantees under exchangeability . In contrast, our experiments isolate an intervention on observ ability that changes the evidence vie w itself. This moti vates analyzing confidence as a function of the evidence av ailable to support a claim, rather than as a purely model-internal score. W e formalize this perspectiv e through the warrant ζ ( e ) , the Bayes-optimal predictability of a claim given an evidence view e , and study whether deployed confidence signals contract appropriately under evidence truncation. T o our knowledge, this is the first empirical study of whether VLM confidence tracks e vidence com- pleteness under controlled degradation. Prior selectiv e prediction work assumes fixed distributions or tests distributional shifts (co variate corruption, domain shift) that do not isolate information content. Prior calibration work tests corruptions that de grade image quality but not necessarily information content. Conformal methods provide mar ginal guarantees under exchangeability , not per-instance bounds tied to observability . Our contribution is demonstrating that confidence-based abstention provides mechanical control in-distrib ution but fails to pro vide epistemic guarantees under evidence shifts, motiv ating warrant-based formulations. 3 Experimental Setup 3.1 Dataset W e use NExT -QA [Xiao et al., 2021], a video question answering benchmark designed to e valuate temporal and causal reasoning. The dataset contains three question types. Descriptive questions ask about static attributes (what/who/where) that can be answered from individual frames. T emporal questions require understanding ev ent ordering across time. Causal questions probe why or how ev ents occur , requiring deeper reasoning about relationships between actions. 5 Each question has fiv e multiple-choice options labeled A through E. W e e valuate on 300 items from the validation split, stratified to include 100 questions of each type. This item list is frozen in item_ids.json to ensure exact reproducibility across all e xperiments, including the Evidence Degradation conditions. For any cross-method comparison (self-reported vs. logprob-deri ved con- fidence), we match predictions by question_id under the same evidence condition and report statistics on the intersection where both methods produce valid outputs ( n = 295 at 18 frames, n = 292 at 6 frames). 3.2 Evidence Packet Construction W e extract a fixed set of frames from each video using a two-stage sampling strategy to ensure deterministic, reproducible inputs. First, we sample 12 frames uniformly across the video’ s full duration T , placing frame i at timestamp t i = ( i + 0 . 5) / 12 · T for i ∈ { 0 , . . . , 11 } . This provides broad temporal cov erage. Second, we extract 6 additional frames from the middle third of the video (between 33% and 66% of the duration) at timestamps t j = (0 . 33 + ( j + 0 . 5) / 6 · 0 . 33) · T for j ∈ { 0 , . . . , 5 } . This “zoom” region focuses on the temporal center where key e vents often occur in short video clips. After merging both sets of timestamps, we sort and deduplicate any frames within 150ms of each other , typically yielding 15–18 frames per video. Each frame is extracted at its precise timestamp, resized to 512 pixels on the short side while preserving aspect ratio, and encoded as a JPEG with quality 85. The resulting frames are stored alongside a manifest file containing the extraction parameters, frame timestamps, and SHA256 hashes of each image. This cryptographic verification ensures that e very experimental run uses identical visual inputs. Figure 1 shows an example evidence packet with 6 representativ e frames from an 18-frame sequence. Parameter Baseline Sparse (6f) Uniform frames 12 6 Zoom frames 6 0 T ypical total frames 15–18 6 JPEG quality 85 85 T able 1: Evidence packet parameters for baseline and shift conditions. 3.3 Model and Prompting W e use Gemini 2.0 Flash [Gemini T eam et al., 2024] as our vision-language model, configured with temperature 0 to ensure deterministic outputs and a maximum of 256 output tokens. For each question, the model recei ves the e xtracted frames in chronological order , the question te xt, and all five answer options labeled A through E. The prompt instructs the model to select one option or explicitly abstain if the visual evidence is insuf ficient. The model is required to output a structured JSON object containing four fields. The choice field specifies the selected answer (A–E) or null if abstaining. The confidence field pro vides a numerical score in [0 , 1] representing the model’ s confidence in its answer . The abstain field is a boolean flag indicating whether the model chooses to abstain. Finally , the evidence_span field identifies a contiguous range of frame indices that support the answer . The prompt forbids any free-form text or explanations, enforcing strict structured output that can be parsed reliably . 3.4 System-Level Abstention W e define abstention at the system level based solely on a confidence threshold ε , rather than relying on the model’ s internal decision to abstain. This distinguishes our approach from prior work on model self-abstention. A prediction p is considered abstaining if an y of the follo wing conditions hold: the JSON output failed to parse, the model returned a null choice, the confidence value is missing, or 6 t = 3.2s t = 22.3s t = 31.6s t = 41.4s t = 48.4s t = 73.3s Evidence Packet Example: 18 frames sampled from 76.5s video Figure 1: Example evidence packet showing 6 of 18 frames extracted from a 76.5-second video. Frames are sampled to pro vide both broad temporal coverage (uniform sampling) and focus on the middle third (zoom region). Timestamps are sho wn abov e each frame. the confidence falls belo w threshold ε . Formally: abstain sys ( p, ε ) = T rue if parse failure or null prediction T rue if p. confidence is missing T rue if p. confidence < ε False otherwise (1) This formulation ensures that abstention behavior is fully controlled and auditable by the system designer . The model’ s self-reported abstain flag is logged for analysis but is not used for gating decisions. This design allo ws us to systematically sweep the threshold ε and measure the resulting risk-cov erage tradeoff without confounding ef fects from the model’ s alignment training. 3.5 Evaluation Metrics W e use standard selecti ve prediction metrics [Geifman and El-Y aniv, 2017]. Let P denote the full set of predictions and A ε ⊆ P the subset accepted (not abstaining) at threshold ε . Coverage is the fraction of inputs answered, Cov erage ( ε ) = | A ε | / | P | . Risk is the error rate among accepted predictions, Risk ( ε ) = errors among A ε / | A ε | . These metrics characterize the fundamental tradeof f in selecti ve prediction. Sweeping ε from 0 to 1 traces a risk-co verage curv e where lower co verage (more abstention) should yield lower risk (fe wer errors among accepted predictions). W e also measure calibration using Expected Calibration Error (ECE) [Guo et al., 2017], computed ov er the accepted predictions at each threshold: ECE = B X b =1 | B b | n | acc ( B b ) − conf ( B b ) | (2) where predictions are partitioned into B bins by confidence, B b is the set of predictions in bin b , acc ( B b ) is the fraction correct, and conf ( B b ) is the mean confidence. W ell-calibrated predictions should hav e ECE near zero. An important methodological note concerns statistical power . At extreme values of ε where few predictions are accepted ( | A ε | < 50 ), risk estimates have high v ariance and should not be interpreted. W e mark such points as NaN and omit them from our analysis and figures. 7 3.6 Logprob-Deri ved Confidence Self-reported confidence is a beha vioral interf ace that may not reflect the model’ s token-le vel decision distribution. W e obtain token log probabilities via the V ertex AI SDK, which exposes logprobs for Gemini 2.0 Flash ( gemini-2.0-flash-001 ), to in vestigate whether the decoder’ s preference signal ov er answer options provides better signal. For logprob extraction, we use a simplified prompt that requests only a single letter response (A–E) without JSON structure. The model is configured with response_logprobs=True and logprobs=20 to return the top-20 token candidates with their log probabilities. W e extract the log probabilities for tokens corresponding to answer options A, B, C, D, E from the first generated token, matching exact single-character tokens. If an option does not appear in the top-20, we assign ℓ i = − 100 (effecti vely −∞ ); in practice, all fi ve options consistently appear in the returned candidates. From the raw log probabilities { ℓ A , ℓ B , ℓ C , ℓ D , ℓ E } , we compute normalized probabilities via soft- max: p i = exp( ℓ i ) P j ∈{ A,B ,C,D,E } exp( ℓ j ) (3) This renormalization is necessary because the model’ s full vocabulary distribution includes tokens beyond A–E. By extracting only the A–E logprobs and renormalizing, we obtain a probability distribution over the answer space that represents the model’ s token-lev el preference among the fiv e choices—the decoder’ s “voting distribution” over answers, independent of the self-reported confidence scalar . W e then deriv e three confidence metrics from this distribution: 1. Maximum probability ( p max ): The probability of the most likely answer , max i p i . 2. Margin : The difference between the top two probabilities, p max − p second . 3. Normalized entropy : H ( p ) /H max , where H ( p ) = − P i p i log p i and H max = log 5 . These logprob-deri ved metrics pro vide an alternati ve confidence signal that reflects the model’ s token- le vel decision distrib ution o ver answer options, rather than a self-reported scalar . Because the logprob experiment uses a different prompt interface (single-letter response, no JSON structure), absolute accuracy v alues should not be compared directly with the self-reported confidence experiments; the relev ant comparison is differ ences acr oss evidence conditions within each method. Importantly , self-reported confidence and logprob-derived confidence are obtained via separate model calls with dif ferent output interfaces (JSON vs. single-letter response with logprobs enabled). This can change instruction-following beha vior and therefore absolute accuracy , so we av oid comparing cross-interface accurac y lev els. Our comparisons focus on (i) ho w each confidence signal changes under evidence degradation (18 → 6 frames) within the same interface, and (ii) whether the qualitati ve failure mode—confidence not contracting under evidence loss—persists across interfaces. When we juxtapose the two confidence signals in a single figure or table, we compute statistics on matched question instances (same question_id , same evidence condition), restricted to the intersection where both calls produce valid outputs. 4 Experiments 4.1 Pipeline V alidation Before conducting large-scale experiments, we v alidate the end-to-end pipeline on a small sample of 50 randomly selected items from the validation set. W e allow one retry for JSON parse failures. The model successfully parses all 50 outputs (100% success rate), achiev es 64% baseline accuracy , and av erages 7.5 seconds per query . These results confirm that the frame extraction, API communication, JSON parsing, and ev aluation components function correctly . 4.2 Baseline Risk-Coverage This experiment tests whether confidence-based abstention provides mechanistic control ov er the risk-cov erage tradeoff. W e process all 300 items in our frozen validation set (100 causal, 100 temporal, 8 Original (18 frames) t=3.2s t=22.3s t=31.6s t=41.4s t=48.4s t=73.3s Shift A (6 frames) t=6.4s t=19.1s t=31.9s t=44.6s t=57.4s t=70.1s Figure 2: V isual comparison of evidence packets for the same video. T op row shows 6 frames sampled from the original 18-frame evidence packet. Bottom row shows all 6 frames from the degraded condition (Sparse). The degraded condition pro vides much sparser temporal co verage of the video’ s 76.5-second duration. 100 descripti ve), querying the model once per item. T emperature is set to 0 for determinism. Parse failures are retried once; if the retry fails, the prediction is treated as an abstention. W e sweep the confidence threshold ε ov er 25 evenly spaced values in [0 , 1] . At each threshold, we compute coverage (fraction of items answered), risk (error rate among answered items), and Expected Calibration Error among accepted predictions. This produces risk-coverage curves that characterize the fundamental tradeoff in selecti ve prediction. W e also generate reliability diagrams at representativ e operating points to assess calibration. A successful result e xhibits four properties: (1) a smooth risk-cov erage curve with a visible “knee” where modest cov erage reductions yield substantial risk reductions; (2) monotonic variation in both risk and abstention rate with ε ; (3) improv ed calibration (lower ECE) at higher thresholds. 4.3 Evidence Degradation This experiment tests whether confidence remains calibrated under distrib ution shift. W e ev aluate the model on the same 300 questions b ut with degraded visual e vidence: only 6 uniformly sampled frames and no zoom frames, reducing the typical frame count from 15–18 down to 6. This simulates compromised temporal resolution while spatial resolution remains unchanged. Figure 2 illustrates the difference between original and de graded evidence for the same video. W e rerun the full selectiv e prediction pipeline with the degraded e vidence and sweep ε ov er the same 25 v alues as in Baseline Risk-Coverage. Comparing the risk-coverage curv es between original and degraded conditions re veals whether the model’ s confidence tracks e vidence quality . A well-calibrated model should report lower confidence when gi ven fewer frames, leading to decreased cov erage at any fixed threshold. Additionally , the risk-coverage curve should remain smooth and monotone, though potentially shifted. The degradation should be most pronounced for temporal questions, which depend more heavily on observing e vents across time. 4.4 Logprob Confidence Self-reported confidence may not reflect the model’ s token-lev el decision distribution. W e conduct an additional experiment using logprob-deriv ed confidence scores (Section 3.6) to test whether the decoder’ s preference signal over answer options provides better signal for selecti ve prediction and, in particular , whether it is more sensitiv e to evidence de gradation. W e query the same 300 items across four e vidence conditions: original (18 frames), Sparse (6 frames), early-half (first 50% of video), and late-half (second 50% of video). For each query , we extract the token-le vel probability distrib ution over answer options and compute three confidence metrics: maximum probability ( p max ), margin, and normalized entrop y . W e test whether logprob-deri ved confidence sho ws greater sensitivity to e vidence degradation than self-reported confidence. If the model’ s token-le vel decision distrib ution tracks information av ailabil- ity , we expect: (1) lower p max values when e vidence is degraded, (2) smaller margin between top options under uncertainty , and (3) higher entropy when the model cannot discriminate between an- 9 swers. If both confidence signals show similar insensiti vity to evidence reduction, the overconfidence problem is fundamental to the model’ s representations rather than an artifact of the self-reporting interface. 5 Results 5.1 Baseline Risk-Coverage T able 2 summarizes results at fiv e representativ e operating points. The model successfully parsed 297 of 300 queries (99% success rate), with the 3 parse failures treated as abstentions. At the baseline threshold of ε = 0 (accepting all valid predictions), the system achie ves 98.7% coverage with 23.6% risk. As the threshold increases, coverage decreases while risk among accepted predictions drops substantially . ε = 0 ε = 0 . 54 ε = 0 . 71 ε = 0 . 83 ε = 0 . 92 Cov erage 98.7% 97.3% 63.7% 63.0% 17.3% Risk 23.6% 22.6% 9.4% 9.0% 1.9% ECE 0.067 0.062 0.018 0.015 0.009 Accepted (n) 296 292 191 189 52 T able 2: Baseline Risk-Cov erage results at selected operating points. Parse success was 99% (297/300). 5.1.1 Risk-Coverage T radeoff The risk-co verage curve in Figure 3a exhibits the desired mechanistic properties. The curve is smooth and monotone, with a clear “knee” around 60–70% cov erage. Tightening ε from 0 to 0.71 reduces cov erage from 98.7% to 63.7% (a 35 percentage point drop) while reducing risk from 23.6% to 9.4% (a 60% relativ e reduction in error rate). Modest sacrifices in coverage yield substantial gains in reliability . The curve continues to improve at higher thresholds, though with diminishing returns and reduced sample sizes. The monotonicity of this tradeof f is critical. Risk decreases smoothly as ε increases, with no re versals or significant irregularities. The confidence signal correlates with correctness, so the abstention threshold provides predictable control o ver system behavior . 5.1.2 Calibration Analysis Calibration improv es markedly as the confidence threshold tightens. Expected Calibration Error drops from 0.067 at ε = 0 to 0.018 at ε = 0 . 71 (Figure 3c). The reliability diagram at this operating point (Figure 3b) shows strong calibration among high-confidence predictions. The 0.9–1.0 confidence bin contains 189 predictions with 91% actual accuracy , demonstrating near-perfect alignment between reported confidence and empirical performance. The confidence gate successfully filters out poorly- calibrated low-confidence predictions, lea ving well-calibrated high-confidence answers. 5.2 Evidence Degradation T able 3 compares performance between the original evidence (15–18 frames) and the degraded condition (6 frames). At the baseline threshold ε = 0 , risk increases from 23.6% to 27.4% under degraded e vidence, a modest but noticeabl e degradation. At the fixed threshold ε = 0 . 71 , cov erage decreases from 63.7% to 53.7%, and conditional risk remains similar (9.4% vs 9.3%). This pattern holds at all operating points: at the same epsilon, 6-frame predictions ha ve lo wer co verage b ut similar conditional risk. The model does become more selectiv e under degradation, but not selectiv ely enough. At ε = 0 . 625 , where 18-frame achiev es 87.7% coverage with 17.9% risk, 6-frame achie ves 78.7% cov erage with 18.2% risk. Despite having only one-third the visual information, the model’ s confidence distribution shifts only modestly . Figure 4 illustrates a concrete instance of this failure. The question asks “how does the bro wn dog keep the white dog do wn, ” requiring observation of sustained interaction across time. W ith 18 frames 10 0.0 0.2 0.4 0.6 0.8 1.0 Coverage 0.00 0.05 0.10 0.15 0.20 0.25 0.30 0.35 Risk (error rate) Confidence gate = 0 = 1 = 0 . 7 1 (a) Risk-Cov erage curve 0.0 0.2 0.4 0.6 0.8 1.0 Confidence 0.0 0.2 0.4 0.6 0.8 1.0 Accuracy n=1 n=1 n=32 n=72 n=2 n=189 Perfect calibration Accuracy (b) Reliability diagram 0.0 0.2 0.4 0.6 0.8 1.0 T h r e s h o l d 0.00 0.02 0.04 0.06 0.08 0.10 ECE ECE=0.018 (c) ECE vs threshold Figure 3: T akeaway: In-distribution, confidence-based abstention works. Baseline performance on 18 frames ( n = 300 ). (a) Risk-Coverage : sweeping ε produces a smooth, monotone curve— higher thresholds reliably reduce error . Starred point: ε = 0 . 71 achie ves 9.4% risk at 63.7% cov erage. (b) Reliability diagram (all predictions): bars show accuracy per confidence bin. The model is well-calibrated—predicted confidence matches actual accuracy . Most predictions cluster at high confidence (0.9–1.0 bin has n = 189 ). (c) Expected Calibration Error (ECE) vs. threshold : calibration error drops from 0.067 to 0.018 as we become more selectiv e. t=1.4s t=10.1s t=14.3s t=18.8s t=21.9s t=33.3s Figure 4: Overconfidence under evidence degradation. Question: “How does the bro wn dog keep the white dog down?” Options: A) change hand, B) hold the dog with its paws, C) walks around, D) using leash, E) lie do wn on chair . Answer: B. W ith 18 frames, the model answers correctly (B) with confidence 1.00. W ith only 6 frames (Sparse condition), the model answers incorrectly (A) yet still reports confidence 0.70. The question requires observing sustained behavior across time; sparse sampling misses critical moments, but the model f ails to recognize that its evidence is insuf ficient. spanning the full video, the model correctly identifies that the bro wn dog uses its pa ws (answer B) with confidence 1.00. With only 6 frames, the model misses critical moments and incorrectly answers A, yet reports confidence 0.70. The model does not recognize that the sparse sampling provides insufficient e vidence. Condition Risk @ ε = 0 Risk @ ε = 0 . 71 Coverage @ ε = 0 . 71 n acc Original (18 frames) 23.6% 9.4% 63.7% 191 Sparse (6 frames) 27.4% 9.3% 53.7% 161 T able 3: Evidence Degradation results comparing original vs shifted evidence. At fixed ε = 0 . 71 , both conditions achieve similar conditional risk ( ∼ 9%), but 6-frame predictions have lower coverage (53.7% vs 63.7%), indicating the model is more selective b ut not by enough to compensate for the 3 × evidence reduction. 5.2.1 The Over confidence Problem Overconfidence here refers to confidence persistence under reduced observability , not increased error at fixed confidence—T able 3 shows conditional risk stays similar at fix ed ε . Figure 5 captures the core finding directly: a 67% reduction in evidence produces less than 6% change in confidence. Self-reported confidence drops only 3.3%, and logprob-deriv ed p max actually incr eases by 0.6%. The gap between evidence reduction and confidence reduction is the problem. A well-calibrated epistemic system would sho w commensurate contraction; instead, confidence remains high despite reduced observability . Figure 6 sho ws this directly in the confidence signals on matched question instances. Despite a 3 × reduction in visual information, the confidence CDFs shift only modestly . At a fixed high-confidence 11 0.0 0.2 0.4 0.6 0.8 1.0 Confidence at 18 frames 0.0 0.2 0.4 0.6 0.8 1.0 Confidence at 6 frames (A) Self-Reported Confidence No change (y=x) Proportional to evidence (y=0.33x) 0.0 0.2 0.4 0.6 0.8 1.0 Confidence at 18 frames 0.0 0.2 0.4 0.6 0.8 1.0 Confidence at 6 frames ( B ) L o g p r o b p m a x No change (y=x) Proportional to evidence (y=0.33x) Figure 5: Per-item confidence comparison under e vidence degradation (18 → 6 frames) on matched question instances. Each point is one question; both panels show the same n = 292 items. P anel (A) appears sparser because self-reported confidence is discretized (0.6, 0.7, 0.9, 1.0, etc.), causing points to stack—darker regions indicate more overlapping points. If confidence tracked evidence, points would fall tow ard the dashed line (proportional 67% reduction). Instead, points cluster near the diagonal, showing confidence is insensiti ve to e vidence quality . 0.00 0.25 0.50 0.75 1.00 Confidence 0.0 0.2 0.4 0.6 0.8 1.0 ECDF Self-reported 18f P(c 0.9)=64% 6f P(c 0.9)=55% 0.00 0.25 0.50 0.75 1.00 p m a x 0.0 0.2 0.4 0.6 0.8 1.0 ECDF L o g p r o b ( p m a x ) 18f P(c 0.9)=61% 6f P(c 0.9)=63% Self p m a x 0 20 40 60 80 100 P ( c 0 . 9 ) ( % ) High-conf mass 18f 6f Figure 6: T akeaway: Even with 67% less e vidence, high-confidence mass barely decreases—and p max actually increases—on the same questions. Left/middle: CDFs with a fixed high-confidence threshold ( c ≥ 0 . 9 ). Right: paired-dots summary of high-confidence mass. Self-reported and logprob confidence are computed on matched question instances (same question_id , same evidence condition) via separate model calls; statistics use the matched intersection where both outputs are valid ( n = 295 at 18 frames, n = 292 at 6 frames). threshold ( c ≥ 0 . 9 ), self-reported confidence drops from 64% to 55%, while logprob-deri ved p max increases from 61% to 63%. The model does not “know when it does not kno w . ” Figure 7 shows the risk-co verage curv es. At any fix ed epsilon, the 6-frame re gime has lo wer cov erage but similar conditional risk. The model does become more selectiv e, but not proportionally to the evidence reduction. At ε = 0 . 625 , the 18-frame re gime achiev es 87.7% cov erage with 17.9% risk, while the 6-frame regime achie ves 78.7% co verage with 18.2% risk. The coverage drops by only 9 percentage points despite a 3 × reduction in frames. The abstention mechanism still e xhibits monotone behavior under shift. Tightening ε continues to reduce risk, and the curve remains smooth without catastrophic failures. Howe ver , achieving the same risk le vel as the original condition requires much more aggressi ve thresholding, dramatically 12 reducing coverage. Model confidence does not track evidence quality as an epistemic quantity . It appears to reflect task difficulty or other f actors insensitiv e to visual input completeness. 0.00 0.25 0.50 0.75 1.00 Coverage 0.0 0.1 0.2 0.3 Risk (Error Rate) +8.8% risk Original (18 frames) Sparse (6 frames) Compressed (JPEG q=30) Figure 7: Risk-Cov erage comparison under evidence degradation. Coverage is the fraction of predictions accepted (not abstaining); Risk is the error rate among accepted predictions. The Sparse curve (6 frames, dashed) shifts leftward and upw ard from the original (18 frames, solid). At any fix ed ε , the 6-frame re gime has lower cov erage but similar conditional risk. Compressed (dotted) has minimal impact. 5.2.2 Diagnosing the Failur e Mode The key diagnostic is illustrated in Figure 7. At any fixed epsilon, the 6-frame regime achie ves lo wer cov erage with similar conditional risk. At ε = 0 . 71 , cov erage drops from 63.7% to 53.7% while risk remains at ∼ 9%. At ε = 0 . 625 , cov erage drops from 87.7% to 78.7% while risk stays at ∼ 18%. The model is more selecti ve under degradation, b ut the cov erage reduction (10–15%) is far smaller than the evidence reduction (67%). The confidence distribution contracts, b ut not proportionally to the information loss. As a control, we tested image compression by re-encoding all frames at JPEG quality 30 (versus baseline quality 85). This degradation had minimal impact. Risk at ε = 0 increased by only 0.6 percentage points (24.2% vs 23.6%), and at 70% coverage by 1.4 percentage points (10.8% vs 9.4%). The model is robust to compression artifacts but highly sensiti ve to temporal resolution. Frame count matters far more than image quality for video question answering. 5.3 Logprob Confidence W e compare risk-cov erage curves using three logprob-deriv ed confidence metrics: p max (maximum softmax probability over answer options), margin (difference between top two probabilities), and normalized entropy . This tests whether the model’ s token-le vel decision distrib ution provides better signal than self-reported confidence. T able 4 summarizes logprob-deriv ed confidence metrics across all four evidence conditions. The results rev eal a striking pattern: logprob-deriv ed confidence shows even less sensiti vity to e vidence degradation than self-reported confidence. 5.3.1 Comparison with Self-Reported Confidence T able 5 directly compares self-reported confidence (from JSON output) with logprob-deri ved p max on matched question instances (same question_id , same e vidence condition) via separate model calls. The comparison re veals that logprob confidence is systematically higher and less responsi ve to e vidence degradation. Figure 8 visualizes the risk-cov erage curves for both confidence methods under evidence de gradation. 13 Condition Acc ( ε = 0 ) no gating; logpr ob pr ompt Mean p max Median p max Mean Margin Mean Entr opy Original (18 frames) 82.4% 0.871 0.970 0.763 0.298 Sparse (6 frames) 81.3% 0.876 0.974 0.771 0.282 Early-half (6 frames) 77.3% 0.861 0.961 0.744 0.319 Late-half (6 frames) 78.7% 0.872 0.979 0.772 0.302 T able 4: Logprob-deriv ed confidence metrics across evidence conditions. Accuracy is unconditional (no gating, ε = 0 ). Despite accuracy dropping from 82.4% to 77–81% under degradation, p max remains remarkably stable (0.86–0.88) and median p max stays abov e 0.96 in all conditions. Entropy remains in the narrow range 0.28–0.32 across all conditions despite 67% e vidence reduction. 0.0 0.2 0.4 0.6 0.8 1.0 Coverage 0.0 0.1 0.2 0.3 Risk (Error Rate) (A) Self-Reported Confidence Original (18 frames) Shift A (6 frames) 0.0 0.2 0.4 0.6 0.8 1.0 Coverage 0.0 0.1 0.2 0.3 Risk (Error Rate) ( B ) L o g p r o b p m a x Original (18 frames) Shift A (6 frames) Figure 8: Risk-coverage curv es comparing self-reported confidence (left) and logprob-deriv ed p max (right) under evidence degradation. Computed on matched question instances via separate model calls. Both methods exhibit leftward shift when frames are reduced from 18 to 6. Howe ver , the gap between conditions is smaller for logprob confidence, indicating that the model’ s token-le vel decision distribution is e ven less sensiti ve to e vidence quality than self-reported confidence. 5.3.2 Interpr etation The logprob results establish that o verconfidence under e vidence degradation is not an artifact of the self-reporting interface . If the problem were merely that the model’ s self-reported confidence div erged from its internal uncertainty , we would expect logprob-deriv ed metrics to show greater sensitivity to e vidence reduction. Instead, we observe the opposite: • Self-reported confidence drops 3.3% under degradation (0.832 → 0.804) • Logprob p max incr eases 0.6% (0.870 → 0.876) • Margin remains stable at 0.74–0.77 across all conditions • Entropy remains in the narro w range 0.28–0.32 despite 67% evidence reduction This finding has important implications. The model’ s token-level decision distrib ution over A–E does not become more diffuse when evidence is truncated. Both self-reported confidence and logprob- deriv ed scores fail to track observability . The ov erconfidence problem is fundamental to the model’ s representations, not a behavioral artif act of the self-reporting interface. The temporal ablation conditions (early-half and late-half) reinforce this conclusion. For questions whose answers depend on ev ents in the missing temporal segment, these conditions provide semanti- cally insuf ficient evidence by construction. Y et p max remains abov e 0.86 and median p max exceeds 0.96 in both cases. Because temporal ablation guarantees remov al of one half of the clip, stability of p max under early-half and late-half conditions suggests insensitivity is not explained solely by redundant sampling—the model genuinely does not recognize when critical temporal context is absent. 14 Metric Self-Reported Logprob p max 18 frames 6 frames 18 frames 6 frames Mean 0.832 0.804 0.870 0.876 Median 0.900 0.900 0.969 0.975 ∆ (degradation) − 3.3% + 0.6% T able 5: Self-reported vs. logprob-deriv ed confidence under evidence degradation. Computed on matched question instances (same question_id , same evidence condition) via separate model calls; statistics use the matched intersection where both outputs are v alid ( n = 295 at 18 frames, n = 292 at 6 frames). Self-reported confidence drops 3.3% (0.832 → 0.804) when frames are reduced. Logprob p max actually incr eases slightly (0.870 → 0.876). The model’ s token-le vel decision distribution is ev en less sensitiv e to evidence quality than its self-reported confidence. 6 Discussion 6.1 Summary of Findings T wo main results emer ge. First, confidence-based abstention provides mechanistic control ov er the risk-cov erage tradeoff in-distrib ution. Sweeping threshold ε from 0 to 0.71 reduces risk from 23.6% to 9.4% while maintaining 63.7% coverage. The risk-coverage curv e is smooth and monotone with a visible knee; calibration among accepted predictions is strong (ECE = 0.018). These are not artifacts of alignment training or stochastic v ariation. The abstention mechanism provides real, predictable control. Second, this control does not transfer across distribution shift. When the number of frames is reduced from 18 to 6, the model’ s confidence distribution contracts only modestly (median confidence remains 0.9 in both regimes) despite a 3 × reduction in visual information. At any fix ed threshold, coverage decreases and conditional risk stays similar , but the coverage reduction (10–15%) is far smaller than the evidence reduction (67%). The model does not recognize when it has insufficient evidence to answer reliably . Third, the logprob analysis confirms that overconfidence is fundamental to the model’ s representations, not an artifact of the self-reporting interface. Logprob-derived p max actually incr eases slightly under evidence degradation (0.870 → 0.876), while self-reported confidence at least decreases modestly (0.832 → 0.804). The model’ s token-le vel decision distrib ution over answer options does not become more diffuse when e vidence quality degrades. 6.2 Implications for Deployment A confidence threshold tuned on 15–18 frames does not preserve co verage when frame count drops. At ε = 0 . 71 , cov erage falls from 63.7% to 53.7% while conditional risk stays near 9%. Confidence gating remains valid for trading co verage against accuracy within a fixed e vidence regime, b ut when input characteristics change (fewer frames, dif ferent sampling rates), the calibration no longer holds. The shift is hard to detect from abstention rates alone because selectivity increases only modestly relativ e to the e vidence reduction. Deployment monitoring cannot rely on co verage as a proxy for distribution shift. Instead, systems should track input characteristics directly: frame count, temporal cov erage, motion density . These observability signals indicate when the model is operating outside its reliable regime. The contrast between frame count and compression quality is also instructi ve. Reducing JPEG quality from 85 to 30 has minimal impact on accuracy (risk increases by only 1.4 percentage points), while reducing frame count from 18 to 6 increases risk from 23.6% to 27.4% at ε = 0 and degrades the entire risk-cov erage curve. This suggests that for video understanding tasks, maintaining temporal resolution is far more important than maintaining spatial resolution or image fidelity . Deployment systems should prioritize frame rate ov er bitrate. 15 6.3 Implications for W arrant-Based Guarantees The results support two claims strongly but require careful interpretation regarding what they do and do not establish. 6.3.1 What These Experiments Support First, a control knob exists in-distribution . Sweeping ε yields monotone risk-cov erage tradeoffs and improv ed calibration among accepted answers. The abstention mechanism provides predictable control for trading cov erage against accuracy . Second, the control knob is not epistemic . Under evidence degradation, confidence contracts insufficiently . Coverage drops modestly at fix ed ε (63.7% to 53.7%), b ut this 16% reduction is far smaller than the 67% evidence reduction. Median confidence remains 0.9 in both regimes. Confidence is not calibrated to information av ailability; it reflects correlates of task dif ficulty rather than e vidential support. Third, the problem is repr esentational, not behavioral . Logprob-derived confidence ( p max ) shows e ven less sensitivity to e vidence de gradation than self-reported confidence, actually increasing slightly from 0.871 to 0.876 under frame reduction. This is inconsistent with the hypothesis that self-reported confidence merely di verges from internal uncertainty . The model’ s token-lev el probability distribution does not become more diffuse when e vidence quality degrades. These three facts imply a warr ant-based formulation in which reported confidence p should satisfy p ≤ ζ ( e ) + ϵ for some evidence-deri ved bound ζ ( e ) . The Sparse condition failure is precisely the violation this contract would rule out. Confidence remains high when the evidence channel is weaker . 6.3.2 What These Experiments Do Not Support These experiments do not yet v alidate that any proposed mechanism ac hieves a w arrant guarantee. W e do not estimate a w arrant quantity ζ (a measure of what the evidence supports), we do not produce a lower bound LB ( ζ ) , and we do not enforce or audit the inequality p ≤ LB ( ζ ) . What we hav e validated is the need for such a guarantee and the inadequacy of confidence-only gating. The experiments establish the problem statement, not the solution. 6.3.3 Separating Selective Pr ediction from W arrant Guarantees These results separate “selecti ve prediction” from the warrant guarantee. On the original evidence view (18 frames), a confidence threshold induces a clean risk-coverage tradeoff and improv es calibration among accepted answers. T ightening ε to 0.71 drops risk from 23.6% to 9.4% at 63.7% cov erage. Under evidence degradation (6 frames), the same threshold produces lower coverage (53.7%) with similar conditional risk (9.3%). The model is more selectiv e, but the cov erage reduction (16%) is disproportionately small relati ve to the e vidence reduction (67%). The median confidence remains 0.9 in both regimes (T able 7), demonstrating that the model’ s subjectiv e confidence does not contract with weaker e vidence. This is exactly the failure mode the warrant contract is meant to rule out. The contract constrains confidence relative to an evidence-conditioned warrant ζ ( e ) , not relativ e to a distribution-specific calibration curve. The problem is that p ( S ) behav es as if it were calibrated to correctness on one regime, b ut it violates the intended dominance condition p ( S ) ≤ ζ ( e ) + ϵ when e changes, because confidence does not contract when the evidence vie w weakens. Starting from the 6-frame regime and tuning ε there looks “safe” when moving to 18 frames, but that is only a conservati ve polic y selection. It does not constitute a guarantee, since the guarantee requires an explicit estimate or lower bound on ζ ( e ) and enforcement against that bound, not a threshold learned on one operating regime. 6.3.4 Threshold T ransfer Across Regimes W e test the “what if you started from shift?” objection by computing threshold transfer in both directions. For each criterion (fixed risk or fixed co verage), we solve for ε ∗ on the source regime via interpolation, then ev aluate the same ε ∗ on the target re gime. 16 Direction ε ∗ Source Risk Source Cov T arget Risk T arget Cov n acc 18 → 6 0.706 9.4% 63.7% (191) 9.3% 53.7% (161) 191/161 6 → 18 0.705 9.3% 53.7% (161) 9.4% 63.7% (191) 161/191 T able 6: Fixed-risk transfer . The interpolated threshold achiev es similar risk in both directions, b ut cov erage differs substantially (63.7% vs 53.7%). Fixed-Risk T ransfer (T arget: 10% Risk) Coverage Comparison at ε = 0 . 625 At ε = 0 . 625 (the highest co verage operating point before the confidence threshold takes ef fect), we observe: • 18-frame: 87.7% cov erage, 17.9% risk (263 accepted) • 6-frame: 78.7% coverage, 18.2% risk (236 accepted) Risk is nearly identical, b ut coverage dif fers by 9 percentage points. This means the 6-frame model is slightly more selecti ve at any gi ven epsilon, b ut the cov erage reduction (9%) is small relativ e to the evidence reduction (67%). At matched epsilon, the model maintains similar calibration b ut admits fewer predictions under de gradation. The problem is not that calibration breaks at fixed epsilon, b ut that the de gr ee of selectivity incr ease is insufficient for the de gr ee of evidence loss . 6.3.5 Implications for Fine-T uning The shift results re veal a missing capability: confidence must become sensitiv e to evidence com- pleteness . Fine-tuning can learn this, but only with the right supervision signal, one tied to evidence quality rather than answer correctness alone. A fine-tuning approach consistent with warrant-based guarantees would: 1. K eep the same claim object (the multiple-choice answer) 2. Add an auxiliary tar get deriv ed from evidence a vailability , an observability pr oxy such as frame count, temporal cov erage, or motion magnitude 3. T rain so that reported confidence is monotone in evidence quality and does not remain high when evidence is de graded Howe ver , fine-tuning alone does not create a guarantee. Fine-tuning improves the predictor that feeds the contract; the guarantee comes from contract enforcement that gates predictions ag ainst a warrant-deri ved bound. The two are complementary . Evidence-aware confidence makes the contract enforceable, and contract enforcement con verts e vidence-awareness into a bound. 6.3.6 Observability Sensiti vity Diagnostic W e measure ho w confidence responds to e vidence reduction using a crude observ ability proxy . Define ˆ ζ = 1 for full evidence (18 frames) and ˆ ζ = 0 for degraded e vidence (6 frames). The key diagnostic is whether the confidence distribution contracts when observ ability decreases: Pr( p ≥ 0 . 9 | ˆ ζ = 0) vs Pr( p ≥ 0 . 9 | ˆ ζ = 1) Metric 18 frames ( ˆ ζ = 1 ) 6 frames ( ˆ ζ = 0 ) Pr( conf ≥ 0 . 9) 64.1% (189/295) 54.8% (160/292) Pr( wrong | conf ≥ 0 . 9) 9.0% 8.8% Mean confidence 0.832 0.804 Quartiles (Q25/Q50/Q75) 0.70 / 0.90 / 0.90 0.70 / 0.90 / 0.90 IQR 0.20 0.20 T able 7: Observability sensitivity diagnostic on matched question instances ( n = 295 at 18 frames, n = 292 at 6 frames). Despite 3 × evidence reduction, the confidence distribution barely mov es: quartiles are identical, IQR is identical, and median remains 0.90. Confidence does not contract commensurate with evidence loss. 17 Confidence does not contract commensurate with evidence loss. Despite reducing frames from 18 to 6, median confidence remains identical at 0.900. The high-confidence rate drops modestly (64.1% to 54.8%), but the error rate among high-confidence predictions is nearly identical (9.0% vs 8.8%). Confidence is not evidence-conditioned. The model maintains high confidence despite reduced observability , and the modest selectivity increase (cov erage drops 14% at fixed ε ) is not proportional to the 67% evidence reduction. 6.4 Limitations Sev eral limitations apply . W e ev aluate a single model (Gemini 2.0 Flash) on a single dataset (NExT - QA). Other VLMs may exhibit different confidence behaviors, and video domains beyond short activity clips may show different degradation patterns. The 300-item sample provides sufficient statistical power for mid-range ε val ues, but estimates become noisy at extreme thresholds where few predictions pass the gate. Evidence reduction is not semantic information r eduction. Reducing frame count is not equi v- alent to proportionally reducing task-rele vant semantic information. V ideos can be temporally redundant, and many NExT -QA instances may remain answerable from sparse keyframes. No widely agreed-upon methodology exists for quantifying semantic information in a video relati ve to a question independent of a particular model. W e complement uniform subsampling with T emporal Ablation (Appendix C), which restricts frames to early or late video segments. This provides a stronger inter - vention: for questions about events in the missing se gment, the evidence is semantically insuf ficient by construction, not merely sparse. Self-reported confidence is a beha vioral interface. Self-reported confidence is not guaranteed to correspond to an y calibrated uncertainty estimate. It may reflect instruction-following behavior . Ne vertheless, confidence-as-te xt is a realistic interface used in LLM/VLM deployments, and our main experiments characterize this interf ace’ s reliability under e vidence truncation. Logprob Confidence uses logprob-deriv ed confidence via the V ertex AI SDK for direct comparison of self-reported confidence against logit-deriv ed scores ( p max , margin, entropy). The logprob analysis shows that the model’ s token-le vel decision distribution is even less sensitiv e to e vidence degradation than self-reported confidence, confirming that ov erconfidence is representational rather than behavioral. Both limitations reinforce the same conclusion. W arrant-like constraints should be defined ov er evidence-conditioned know ability and should not rely solely on a single confidence scalar , whether self-reported or logit-deriv ed, without explicit conditioning on the e vidence view . These e xperiments do not estimate a warrant quantity ζ or enforce warrant-based bounds. W e v alidate the need for such mechanisms, not their implementation. 7 Conclusion W e e valuated confidence-gated abstention for video question answering, testing both in-distribution behavior and robustness to evidence degradation. Confidence-based selectiv e prediction provides mechanistic control over risk-co verage tradeoffs within the baseline distribution. Sweeping threshold ε from 0 to 0.71 reduces risk from 23.6% to 9.4% at 63.7% co verage, with well-calibrated predictions (ECE = 0.018). This control is not epistemic. When frame count drops from 18 to 6, median confidence remains 0.9 and cov erage drops only 16% at fixed threshold despite a 67% reduction in visual information. The confidence signal is not calibrated to information av ailability . Critically , logprob-derived confidence ( p max ) sho ws ev en less sensitivity to e vidence degradation than self-reported confidence, which is inconsistent with the hypothesis that o verconfidence is merely a beha vioral artifact. The problem is fundamental to the model’ s representations. A system deployed under v ariable e vidence conditions cannot use a threshold tuned in-distribution. The threshold achieving 9% error at 63.7% co verage on full e vidence yields 9% error at only 53.7% cov erage when evidence degrades. Robust selectiv e prediction requires making confidence e vidence- aware, either through fine-tuning with observ ability proxies or architectural changes that condition confidence on input quality metrics such as frame count, temporal cov erage, or motion density . 18 Reproducibility All e xperiments are fully reproducible. W e use the NExT -QA validation split with 300 stratified items frozen in item_ids.json . The model is Gemini 2.0 Flash ( gemini-2.0-flash ) configured with temperature 0 and max_tokens 256. Evidence packets are extracted deterministically with SHA256 hashes recorded in manifest files for cryptographic verification. The prompt template (version v1) is stored in config/prompts/v1.txt . Complete provenance information including timestamps, API latencies, and raw model outputs is logged for e very prediction. A Full Sweep Results ε Risk Co verage Abstention Acc (cond) ECE n accepted 0.00 0.236 0.987 0.013 0.764 0.067 296 0.33 0.234 0.983 0.017 0.766 0.067 295 0.54 0.226 0.973 0.027 0.774 0.062 292 0.63 0.179 0.877 0.123 0.821 0.041 263 0.71 0.094 0.637 0.363 0.906 0.018 191 0.83 0.090 0.630 0.370 0.910 0.015 189 0.92 0.019 0.173 0.827 0.981 0.009 52 T able 8: Selected sweep results from Baseline Risk-Cov erage. Full results in sweep_results.csv . B Per -Category Degradation W e analyze degradation patterns across question cate gories (Causal: CW+CH, T emporal: TN+TC+TP , Descriptiv e: DO+DL+DC) at three operating points to prev ent cherry-picking. Note that the ov erall cov erage reported in T able 3 (e.g., 53.7% at ε = 0 . 71 under Sparse) is the av erage across these three 100-item strata; the per-cate gory breakdown belo w explains the aggre gate behavior . Category n Acc 18 Acc 6 ∆ Acc Cov 18 Cov 6 ∆ Cov ε = 0 (unconditional) Causal 100 80.0% 77.3% − 2.7% 100% 97.0% − 3.0% T emporal 100 63.3% 60.4% − 2.8% 98.0% 96.0% − 2.0% Descriptiv e 100 85.7% 79.8% − 5.9% 98.0% 99.0% +1.0% ε = 0 . 71 (paper oper ating point) Causal 100 94.7% 97.5% +2.8% 57.0% 40.0% − 17.0% T emporal 100 83.0% 92.5% +9.5% 53.0% 40.0% − 13.0% Descriptiv e 100 92.6% 86.4% − 6.2% 81.0% 81.0% 0.0% T able 9: Per-cate gory accuracy and cov erage at two operating points. At ε = 0 , Descripti ve questions degrade most ( − 5.9% accuracy). At ε = 0 . 71 , category behaviors diver ge: Causal and T emporal sho w improved conditional accuracy but much lo wer coverage, while Descripti ve maintains coverage but de grades accuracy . The category analysis rev eals heterogeneous degradation patterns. At ε = 0 (unconditional), Descrip- tiv e questions show the lar gest accuracy drop ( − 5.9%), followed by T emporal ( − 2.8%) and Causal ( − 2.7%). Howe ver , at ε = 0 . 71 , the pattern rev erses for Causal and T emporal. Conditional accuracy incr eases because the threshold more aggressi vely filters out uncertain predictions in the de graded regime (coverage drops from 57% to 40% for Causal). Descriptiv e questions maintain coverage but de grade accuracy , suggesting the model is ov erconfident on descripti ve queries under e vidence degradation. C T emporal Ablation Uniform subsampling reduces frame count b ut does not guarantee reduction of task-rele v ant semantic information—videos may be temporally redundant, with answers inferable from an y subset of 19 frames. T o better approximate semantic information reduction, we design a procedural ablation that systematically remov es temporal context by restricting e vidence to specific video segments. For each video, we generate two 6-fra me evidence pack ets: early-half (frames sampled uniformly from the first 50% of the clip) and late-half (frames sampled uniformly from the second 50%). This design targets temporal and causal questions, which often require observing sequences of events spanning the full video. By restricting frames to one half, we remov e e vidence about e vents occurring in the other half—a more controlled intervention on semantic content than uniform subsampling, which may still capture key moments re gardless of density . Condition Cov erage Risk Conditional Acc Mean Confidence At ε = 0 (unconditional) Original (18 frames) 98.7% 23.6% 76.4% 0.818 Sparse (6 uniform) 97.3% 27.4% 72.6% 0.786 Early-half (0–50%) 97.3% 25.7% 74.3% 0.792 Late-half (50–100%) 97.7% 25.3% 74.7% 0.800 At ε = 0 . 71 Original (18 frames) 63.7% 9.4% 90.6% 0.923 Sparse (6 uniform) 53.7% 9.3% 90.7% 0.926 Early-half (0–50%) 52.3% 8.9% 91.1% 0.923 Late-half (50–100%) 51.7% 10.3% 89.7% 0.929 T able 10: T emporal Ablation results. At ε = 0 , early-half and late-half conditions perform similarly to uniform 6-frame sampling (25–26% risk vs 27%). At ε = 0 . 71 , all 6-frame conditions con verge to similar coverage (51–54%) with mean confidence remaining above 0.92. The model does not differentiate between early and late evidence despite the procedural remo val of temporal conte xt. T emporal Ablation conditions behave nearly identically to uniform 6-frame subsampling. At ε = 0 , early-half (25.7% risk) and late-half (25.3% risk) perform comparably to Sparse (27.4% risk). At ε = 0 . 71 , all three 6-frame conditions con ver ge to similar coverage (51–54%) and mean confidence ( ∼ 0.92). The model does not “notice” whether it is seeing the first or second half of the video. Confidence remains high regardless of which temporal se gment is provided. This finding strengthens our claim that confidence does not track evidence completeness. Unlike uniform subsampling, which may preserve k ey moments by chance, temporal ablation guarantees remov al of one half of the clip’ s temporal context. For questions whose answers depend on late ev ents (e.g., “what does X do after Y?”), early-half evidence is semantically insufficient. Y et the model maintains similarly high confidence in both conditions. This suggests ov erconfidence is not merely an artifact of temporal redundanc y in the dataset, but reflects a fundamental insensiti vity to evidence a v ailability . D F ormal Metric Definitions This appendix provides complete mathematical definitions for all ev aluation metrics used in this work. D.1 Selecti ve Prediction Metrics Let P denote the full set of n predictions, and let A ε ⊆ P be the subset of predictions accepted at confidence threshold ε —i.e., predictions where the model’ s confidence c i ≥ ε . Coverage. The fraction of inputs for which the model pro vides an answer: Cov erage ( ε ) = | A ε | | P | (4) Risk. The error rate among accepted predictions: Risk ( ε ) = 1 | A ε | X i ∈ A ε 1 [ ˆ y i = y i ] (5) where ˆ y i is the predicted answer and y i is the ground truth. 20 Conditional Accuracy . The complement of risk: Acc cond ( ε ) = 1 − Risk ( ε ) = 1 | A ε | X i ∈ A ε 1 [ ˆ y i = y i ] (6) D.2 Calibration Metrics Expected Calibration Error (ECE). Predictions are partitioned into B equal-width bins by confidence. Let B b denote the set of predictions in bin b . ECE measures the weighted a verage gap between confidence and accuracy: ECE = B X b =1 | B b | n | acc ( B b ) − conf ( B b ) | (7) where: acc ( B b ) = 1 | B b | X i ∈ B b 1 [ ˆ y i = y i ] (8) conf ( B b ) = 1 | B b | X i ∈ B b c i (9) W e use B = 10 bins throughout. A perfectly calibrated model has ECE = 0 . D.3 Logpr ob-Derived Confidence Metrics Giv en raw log probabilities { ℓ A , ℓ B , ℓ C , ℓ D , ℓ E } from the model’ s token distribution over the fiv e answer options, we first normalize via softmax: p i = exp( ℓ i ) P j ∈{ A,B ,C,D,E } exp( ℓ j ) (10) From this distribution p = ( p A , p B , p C , p D , p E ) , we deriv e three confidence metrics: Maximum Probability ( p max ). The probability assigned to the most likely answer: p max = max i ∈{ A,B ,C,D,E } p i (11) Higher p max indicates the model concentrates probability mass on a single option. Margin. The gap between the top two probabilities: Margin = p max − p second (12) where p second is the second-highest probability . Larger margins indicate more decisi ve predictions. Normalized Entropy . Uncertainty measured as the ratio of actual entropy to maximum entropy: Entropy norm = H ( p ) H max = − P i p i log p i log 5 (13) where H max = log 5 is the entropy of a uniform distribution over 5 options. V alues near 0 indi- cate high confidence (concentrated distribution); values near 1 indicate high uncertainty (uniform distribution). E Prompt T emplates W e use two different prompts for self-reported confidence (JSON output) and logprob-deriv ed confidence (letter-only output). 21 E.1 Self-Reported Confidence Prompt JSON Prompt f or Self-Reported Confidence (v1) You are answering a multiple-choice video question using ONLY the provided frames. Rules: • Use only visual evidence from the frames. Do not assume details not visible. • Do not explain your reasoning. Do not write prose. • If the frames do not contain enough evidence to choose confidently , abstain. • If you do not abstain, you must select exactly one option A–E. • Y our confidence must be a number in [0 , 1] reflecting probability of correctness. Output Format: JSON only with this exact schema (no extra k eys): 1 { 2 " c h o i c e " : " A " | " B " | " C " | " D " | " E " | n u l l , 3 " c o n f i d e n c e " : < n u m b e r > , 4 " a b s t a i n " : < b o o l e a n > , 5 " e v i d e n c e _ s p a n " : [ s t a r t _ i d x , e n d _ i d x ] | n u l l 6 } E.2 Logprob Extraction Pr ompt Letter -Only Prompt f or Logprob Extraction You are answering a multiple choice question about a video. The video frames are provided in chronological order. Based on the video frames, answer the following question by selecting exactly ONE option (A, B, C, D, or E). Question: {QUESTION_TEXT} Options: A) {OPT_A} B) {OPT_B} C) {OPT_C} D) {OPT_D} E) {OPT_E} Respond with ONLY a single letter (A, B, C, D, or E) and nothing else. The letter-only prompt is used with response_logprobs=True to extract token-le vel probabilities ov er answer options. This simpler output format av oids JSON parsing and enables direct access to the model’ s softmax distrib ution over the fi ve answer tok ens. E.3 Logprob-to-Pr obability Computation Figure 9 illustrates the logprob extraction pipeline. Raw log probabilities ℓ i from the model’ s token distribution are normalized via softmax o ver the fi ve answer options A–E. This renormalization is necessary because the model’ s full v ocabulary distribution includes tokens beyond the answer options; we restrict to the answer space to compute a proper probability distribution. The resulting p i values sum to 1 and represent the model’ s relati ve preference among answer choices. References Y onatan Geifman and Ran El-Y aniv . Selectiv e classification for deep neural net- works. In Advances in Neural Information Pr ocessing Systems , volume 30, pages 4878–4887, 2017. URL https://proceedings.neurips.cc/paper/2017/hash/ 97dd69382260e98942007626966144e5- Abstract.html . 22 Figure 9: Logprob-to-probability computation pipeline. V ideo frames and prompt are processed by the transformer model. The final hidden state is projected via the LM head to produce logits over the vocab ulary . W e extract logprobs for tokens A–E and renormalize via softmax to obtain a probability distribution o ver answer options, from which we deri ve p max , margin, and entrop y . Ran El-Y aniv and Y air W iener . On the foundations of noise-free selectiv e classification. Journal of Machine Learning Resear ch , 11:1605–1641, 2010. Junbin Xiao, Xindi Shang, Angela Y ao, and T at-Seng Chua. NExT -QA: Next phase of question-answering to explaining temporal actions. In Pr oceedings of the IEEE/CVF Con- fer ence on Computer V ision and P attern Recognition , pages 9777–9786, 2021. URL https: //openaccess.thecvf.com/content/CVPR2021/html/Xiao_NExT- QA_Next_Phase_of_ Question- Answering_to_Explaining_Temporal_Actions_CVPR_2021_paper.html . C. K. Cho w . On optimum recognition error and reject tradeoff. IEEE T ransactions on Information Theory , 16(1):41–46, 1970. Y onatan Geifman and Ran El-Y aniv . Selecti veNet: A deep neural network with an integrated reject option. In Proceedings of the 36th International Confer ence on Machine Learning , volume 97 of Pr oceedings of Machine Learning Resear ch , pages 2151–2159. PMLR, 2019. URL https: //proceedings.mlr.press/v97/geifman19a.html . V ojt ˇ ech Franc, Daniel Pr ˚ uša, and Václav V or ˇ a ˇ cek. Optimal strategies for reject option classifiers. Journal of Machine Learning Resear ch , 24(11):1–49, 2023. URL http://jmlr.org/papers/ v24/21- 0048.html . Adam Fisch, T ommi S. Jaakkola, and Regina Barzilay . Calibrated selectiv e classification. T rans- actions on Machine Learning Researc h , 2022. URL https://openreview.net/forum?id= zFhNBs8GaV . Surve y Track. Dan Hendrycks and Ke vin Gimpel. A baseline for detecting misclassified and out-of-distribution examples in neural networks. In International Confer ence on Learning Representations , 2017. URL https://openreview.net/forum?id=Hkg4TI9xl . Hengyue Liang, Le Peng, and Ju Sun. Selecti ve classification under distribution shifts. T ransactions on Machine Learning Resear ch , 2024. URL https://openreview.net/forum?id=rX9kG15mS1 . Alvin Heng and Harold Soh. Know when to abstain: Optimal selective classification with likelihood ratios, 2025. URL . Chuan Guo, Geoff Pleiss, Y u Sun, and Kilian Q. W einberger . On calibration of modern neural networks. In Proceedings of the 34th International Confer ence on Machine Learning , v olume 70 of Pr oceedings of Machine Learning Resear ch , pages 1321–1330. PMLR, 2017. URL https: //proceedings.mlr.press/v70/guo17a.html . Dan Hendrycks and Thomas Dietterich. Benchmarking neural network robustness to common corruptions and perturbations. In International Conference on Learning Repr esentations , 2019. URL https://openreview.net/forum?id=S1gw_nR9FQ . 23 Y aniv Ovadia, Emily Fertig, Jie Ren, Zachary Nado, David Sculley , Sebastian Now ozin, Joshua Dillon, Balaji Lakshminarayanan, and Jasper Snoek. Can you trust your model’ s uncertainty? Ev aluating predictiv e uncertainty under dataset shift. In Advances in Neural Information Pr ocessing Systems , volume 32, pages 13991–14002, 2019. URL https://proceedings.neurips.cc/ paper/2019/hash/8558cb408c1d76621371888658d2238d- Abstract.html . Balaji Lakshminarayanan, Alexander Pritzel, and Charles Blundell. Simple and scalable predictiv e uncertainty estimation using deep ensembles. In Advances in Neural Information Pr ocessing Systems , volume 30, pages 6402–6413, 2017. URL https://proceedings.neurips.cc/ paper/2017/hash/9ef2ed4b7fd2c810847ff046ad062080- Abstract.html . Y arin Gal and Zoubin Ghahramani. Dropout as a Bayesian approximation: Representing model uncertainty in deep learning. In Pr oceedings of the 33rd International Conference on Machine Learning , volume 48 of Pr oceedings of Machine Learning Resear ch , pages 1050–1059. PMLR, 2016. URL https://proceedings.mlr.press/v48/gal16.html . Y uli Zou, W eijian Deng, and Liang Zheng. Adaptiv e calibrator ensemble: Navigating test set difficulty in out-of-distrib ution scenarios. In Pr oceedings of the IEEE/CVF International Confer ence on Computer V ision , pages 19333–19342, 2023. URL https://openaccess.thecvf.com/ content/ICCV2023/html/Zou_Adaptive_Calibrator_Ensemble_Navigating_Test_ Set_Difficulty_in_Out- of- Distribution_Scenarios_ICCV_2023_paper.html . Vladimir V ovk, Alex Gammerman, and Glenn Shafer . Algorithmic Learning in a Random W orld . Springer Nature, Cham, Switzerland, second edition, 2022. doi: 10.1007/978- 3- 031- 06649- 8. Glenn Shafer and Vladimir V ovk. A tutorial on conformal prediction. J ournal of Machine Learning Resear ch , 9(12):371–421, 2008. URL http://jmlr.org/papers/v9/shafer08a.html . Anastasios N. Angelopoulos and Stephen Bates. Conformal prediction: A gentle introduction. F oundations and T r ends® in Machine Learning , 16(4):494–591, 2023. doi: 10.1561/2200000101. Anastasios N. Angelopoulos, Stephen Bates, Adam Fisch, Lihua Lei, and T al Schuster . Conformal risk control. Journal of the A CM , 71(3):1–34, 2024. doi: 10.1145/3648611. Y unpeng Xu, W enge Guo, and Zhi W ei. Selective conformal risk control, 2025. URL https: //arxiv.org/abs/2512.12844 . Robert M. Fano. T ransmission of Information: A Statistical Theory of Communication . MIT Press, Cambridge, MA, 1961. ISBN 9780262060011. Murat Sensoy , Lance Kaplan, and Melih Kandemir . Evidential deep learning to quantify clas- sification uncertainty . In Advances in Neural Information Pr ocessing Systems , volume 31, pages 3179–3189, 2018. URL https://proceedings.neurips.cc/paper/2018/hash/ a981f2b708044d6aa4a7ec1258d418ef- Abstract.html . Pranav Rajpurkar , Robin Jia, and Percy Liang. Know what you don’t kno w: Unanswerable questions for SQuAD. In Proceedings of the 56th Annual Meeting of the Association for Computational Linguistics (V olume 2: Short P apers) , pages 784–789, 2018. URL https://aclanthology. org/P18- 2124 . Amita Kamath, Robin Jia, and Percy Liang. Selectiv e question answering under domain shift. In Pr oceedings of the 58th Annual Meeting of the Association for Computational Linguistics , pages 5684–5696. Association for Computational Linguistics, 2020. doi: 10.18653/v1/2020.acl- main. 503. Spencer Whitehead, Suzanne Petryk, V edaad Shakib, Joseph Gonzalez, T rev or Darrell, Anna Rohrbach, and Marcus Rohrbach. Reliable visual question answering: Abstain rather than answer incorrectly . In Eur opean Confer ence on Computer V ision , pages 148–166. Springer , 2022. doi: 10.1007/978- 3- 031- 19812- 0_9. Changdae Oh, Sang-Keun Choi, Hyungi Lee, Y oung-Hyun Jeong, and Sung-Ju Hwang. T owards calibrated robust fine-tuning of vision-language models. In Advances in Neural Information Pr ocessing Systems , volume 37, 2024. URL https://proceedings.neurips.cc/paper_ database/paper/2024 . 24 Zijun Chen, Sicheng Zhao, Y an Feng, Xu Zhang, Minghui W ang, Jing W ang, and Baoyuan W ang. Un veiling uncertainty: A deep dive into calibration and performance of multimodal large language models. In Pr oceedings of the 31st International Confer ence on Computational Linguistics , pages 4211–4226, 2025. Bingbing W en, Jihan Y ao, Shangbin Feng, Chenjun Xu, Y ulia Tsvetkov , Bill Howe, and Lucy Lu W ang. Know your limits: A survey of abstention in lar ge language models. T ransactions of the Association for Computational Linguistics , 13:529–556, 2025. ISSN 2307-387X. doi: 10.1162/tacl_a_00721. Shengjia Zhao and Stefano Ermon. Right decisions from wrong predictions: A mechanism design alternativ e to individual calibration. In Pr oceedings of the 24th International Confer ence on Artificial Intelligence and Statistics , v olume 130 of Pr oceedings of Machine Learning Resear ch , pages 2683–2691. PMLR, 2021. URL https://proceedings.mlr.press/v130/zhao21a. html . T ilmann Gneiting and Adrian E. Raftery . Strictly proper scoring rules, prediction, and es- timation. J ournal of the American Statistical Association , 102(477):359–378, 2007. doi: 10.1198/016214506000001437. Gemini T eam et al. Gemini: A family of highly capable multimodal models. arXiv preprint arXiv:2312.11805 , 2024. URL . 25
Original Paper
Loading high-quality paper...
Comments & Academic Discussion
Loading comments...
Leave a Comment