Decoding Neural Emotion Patterns through Large Language Model Embeddings
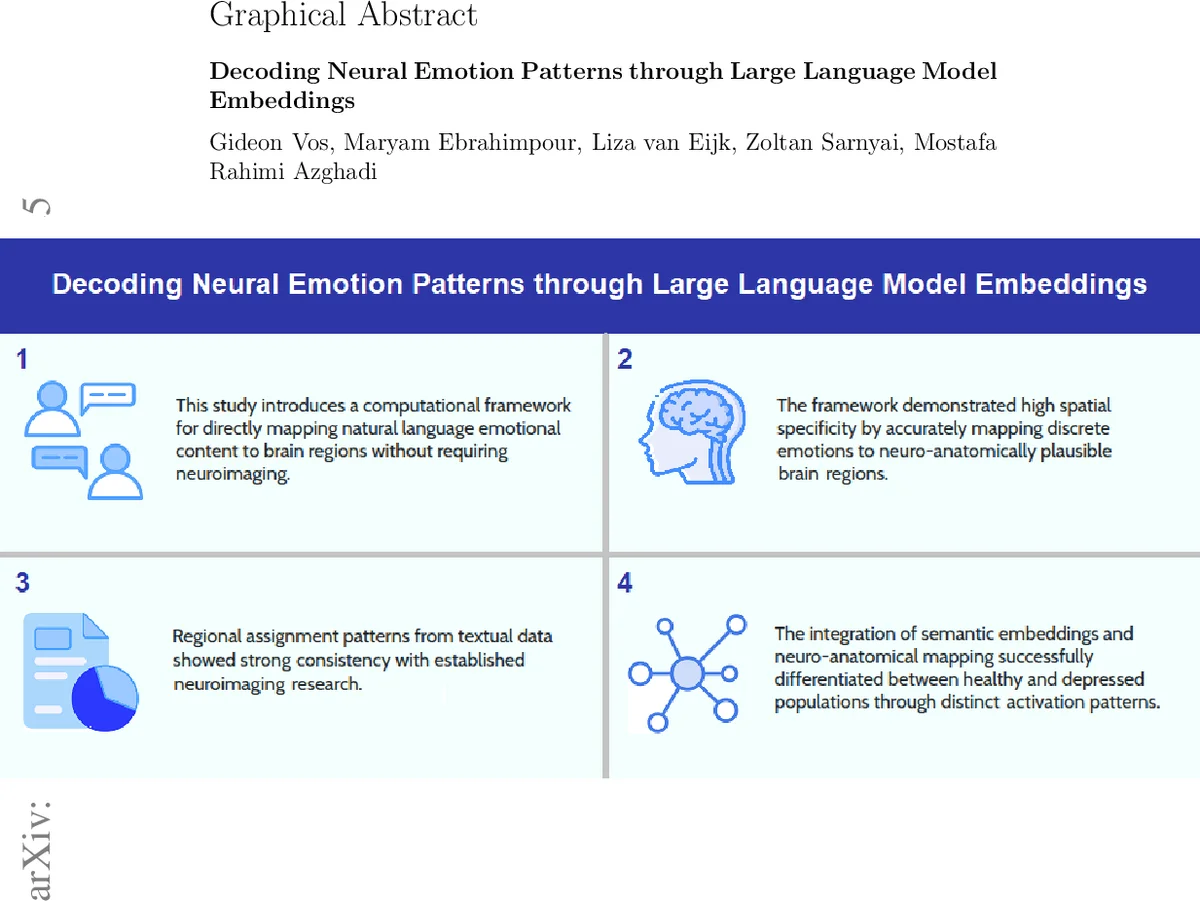
Understanding how emotional expression in language relates to brain function is a challenge in computational neuroscience and affective computing. Traditional neuroimaging is costly and lab-bound, but abundant digital text offers new avenues for emotion-brain mapping. Prior work has largely examined neuroimaging-based emotion localization or computational text analysis separately, with little integration. We propose a computational framework that maps textual emotional content to anatomically defined brain regions without requiring neuroimaging. Using OpenAI’s text-embedding-ada-002, we generate high-dimensional semantic representations, apply dimensionality reduction and clustering to identify emotional groups, and map them to 18 brain regions linked to emotional processing. Three experiments were conducted: i) analyzing conversational data from healthy vs. depressed subjects (DIAC-WOZ dataset) to compare mapping patterns, ii) applying the method to the GoEmotions dataset and iii) comparing human-written text with large language model (LLM) responses to assess differences in inferred brain activation. Emotional intensity was scored via lexical analysis. Results showed neuroanatomically plausible mappings with high spatial specificity. Depressed subjects exhibited greater limbic engagement tied to negative affect. Discrete emotions were successfully differentiated. LLM-generated text matched humans in basic emotion distribution but lacked nuanced activation in empathy and self-referential regions (medial prefrontal and posterior cingulate cortex). This cost-effective, scalable approach enables large-scale analysis of naturalistic language, distinguishes between clinical populations, and offers a brain-based benchmark for evaluating AI emotional expression.
💡 Research Summary
The paper introduces a novel “imaging‑free” framework for linking natural‑language emotional content to anatomically defined brain regions. The authors first segment each text into roughly 300‑character chunks and encode them with OpenAI’s text‑embedding‑ada‑002 model, producing 1 536‑dimensional vectors. After standardization, the vectors are reduced to three dimensions using Principal Component Analysis (PCA). The three‑dimensional space is chosen to enable direct visualisation and to map points onto Montreal Neurological Institute (MNI) coordinates.
Emotional intensity for each chunk is computed with a lexicon‑based scoring system that assigns base scores (mild 0.3, moderate 0.6, high 0.8, extreme 1.0) and adds modifiers for intensifiers, absolutes, punctuation, and uppercase text, capping the final value at 2.0.
The reduced embeddings are clustered with K‑means, where the number of clusters is fixed at 29 to correspond to a pre‑selected set of brain regions implicated in affective processing (frontal, temporal, cingulate, insular, and occipital areas). Cluster centroids are matched to the MNI coordinates of these regions by minimizing Euclidean distance, enforcing a one‑to‑one assignment. Each text chunk inherits the label of the region to which its cluster is assigned, yielding a computational estimate of “brain activation” for that chunk.
Three experimental applications are presented:
-
Healthy vs. Depressed (DAIC‑WOZ) – Interview transcripts from clinically diagnosed depressed participants and matched healthy controls are processed. Depressed participants show a higher proportion of chunks assigned to limbic structures (amygdala, hippocampus) and to negative‑valence clusters, indicating stronger inferred limbic engagement and reduced emotional diversity.
-
GoEmotions – A large Reddit‑derived dataset with 27 manually annotated emotion categories is mapped. Each emotion category aligns with distinct brain regions, reproducing known laterality effects (e.g., positive emotions preferentially mapping to left‑frontal areas, negative emotions to right‑frontal and limbic regions).
-
Human vs. LLM Dialogue – Human‑written and large‑language‑model‑generated conversational turns from the Schema‑Guided Dialogue corpus are compared. While the overall distribution of basic emotions (joy, sadness, anger, etc.) is similar, LLM output shows markedly lower inferred activation in medial prefrontal cortex and posterior cingulate cortex—areas associated with empathy, self‑referential processing, and Theory of Mind.
Statistical analysis is performed at the participant level: for each subject and each brain region, mean emotional intensity and the count of assigned chunks are computed. Group‑level comparisons use t‑tests, Cohen’s d, and bootstrap confidence intervals across 15 independent trials that vary sampling strategies (undersampling, oversampling, hybrid) and random seeds. Silhouette scores assess clustering quality, and the authors report stable patterns across trials.
The authors acknowledge several limitations. Reducing embeddings to three PCA components captures only a small fraction of the original variance, potentially discarding subtle semantic nuances. K‑means assumes spherical clusters and may oversimplify the high‑dimensional structure of emotional language. The one‑to‑one mapping between clusters and brain regions ignores the distributed, network‑based nature of affective processing. The lexicon‑based intensity measure, while grounded in established affective norms, may be biased by cultural or domain‑specific language use. Crucially, the inferred “brain activation” has not been validated against actual neuroimaging data; the authors propose this as a hypothesis‑generating tool that requires orthogonal validation.
In conclusion, the study offers a scalable, cost‑effective pipeline for estimating emotion‑brain relationships from text alone. It demonstrates that the approach can differentiate clinical populations, map discrete emotions to plausible neuroanatomical substrates, and provide a brain‑inspired benchmark for evaluating AI‑generated emotional language. Future work should explore richer dimensionality‑reduction techniques (e.g., UMAP, deep autoencoders), incorporate multimodal neuroimaging validation, and refine intensity scoring to improve cultural robustness.
Comments & Academic Discussion
Loading comments...
Leave a Comment