Extracting node comparison insights for the interactive exploration of property graphs
While scoring nodes in graphs to understand their importance (e.g., in terms of centrality) has been investigated for decades, comparing nodes in property graphs based on their properties has not, to our knowledge, yet been addressed. In this paper, we propose an approach to automatically extract comparison of nodes in property graphs, to support the interactive exploratory analysis of said graphs. We first present a way of devising comparison indicators using the context of nodes to be compared. Then, we formally define the problem of using these indicators to group the nodes so that the comparisons extracted are both significant and not straightforward. We propose various heuristics for solving this problem. Our tests on real property graph databases show that simple heuristics can be used to obtain insights within minutes while slower heuristics are needed to obtain insights of higher quality.
💡 Research Summary
The paper addresses a gap in graph analytics: while decades of research have focused on scoring nodes (e.g., centrality) to assess importance, there has been little work on automatically comparing nodes in property graphs based on their rich attribute sets. The authors propose a complete pipeline that (i) derives comparison indicators from the structural and attribute context of nodes, (ii) formalizes the problem of selecting two disjoint sets of indicators—one for grouping nodes into clusters and another for highlighting differences within each cluster—and (iii) supplies several heuristic algorithms to solve this optimization problem.
The foundation of the work lies in a rigorous formalization of property graphs and their schemas (graph types). A graph type specifies node and edge labels, the set of allowed properties for each label, and the cardinalities of relationships (1‑to‑1, 1‑to‑many, many‑to‑many). Using this schema, the authors define the context of a node as the sub‑graph that includes all incident relationships and the hierarchical environment (e.g., an airport’s city and country). This context is the source of all comparison indicators.
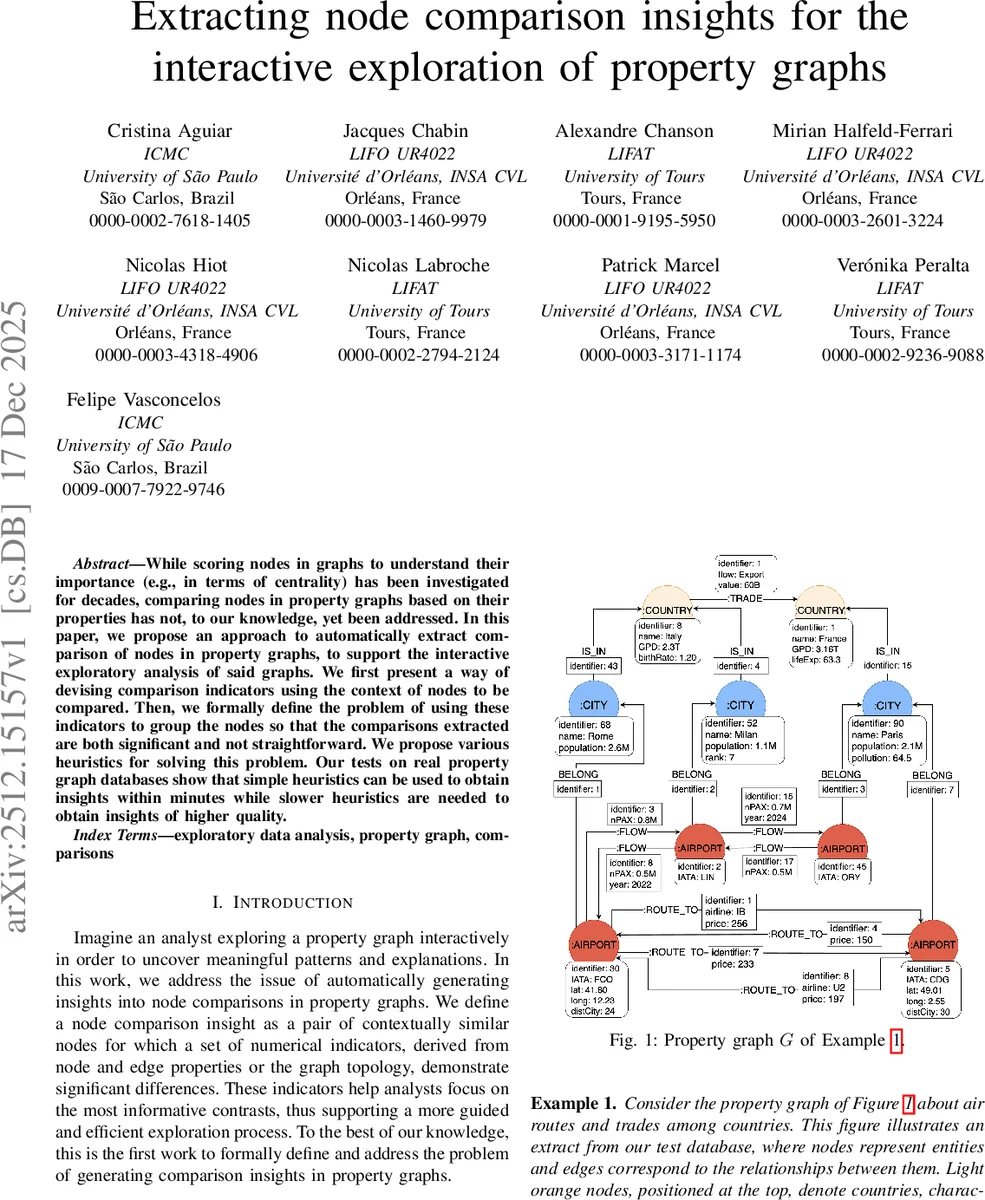
Indicators are categorized along three dimensions: (1) Provenance – whether the value originates from a node property, from topology (e.g., degree), or a combination; (2) Scope – whether the indicator is local (inner), context‑based (derived from the node’s neighbourhood), or global (relative to the whole graph); (3) Computation – primitive (directly taken from a property) or derived (aggregated, normalized, or otherwise computed). The paper provides a concrete example with an air‑routes graph: indicators such as the number of distinct IATA codes reachable from an airport (i₁), the average price of routes to neighboring airports (i₂), the population of the airport’s city (i₃), and the GDP of its country (i₄).
The core Comparison Insight Extraction Problem is defined as follows: given a set of candidate indicators, select a subset for clustering (grouping indicators) and a disjoint subset for intra‑cluster comparison (comparison indicators) so that (a) nodes within each cluster are similar according to the grouping indicators, and (b) the comparison indicators exhibit statistically significant, non‑obvious differences among nodes in the same cluster. This objective differs from classic clustering because it explicitly maximizes the “comparison value” rather than merely minimizing intra‑cluster variance.
Because the problem is combinatorial and NP‑hard, the authors develop several heuristics:
- Simple heuristic – removes highly correlated indicators, normalizes remaining values, applies K‑means clustering, and then uses t‑tests to pick comparison indicators that are significant yet not trivially explained.
- Greedy heuristic – iteratively adds the indicator that most improves a composite score combining cluster cohesion and comparison significance.
- Meta‑heuristic (simulated annealing) – starts from the simple solution and explores neighboring indicator selections (add, remove, swap) while accepting moves that improve a weighted objective (cluster quality + comparison value).
Experiments are conducted on three real‑world property graph datasets: (1) an open‑source air‑routes and trade network, (2) a corporate social network, and (3) a product‑component graph. For each dataset the authors measure execution time, the average effect size of selected comparison indicators within clusters, and a human‑expert rating of the “meaningfulness” of the generated insights (on a 5‑point Likert scale). Results show that the simple heuristic produces usable insights within minutes (average rating ≈ 3.2/5), while the more sophisticated heuristics require longer runtimes (20–45 minutes) but achieve higher ratings (≈ 3.7/5) and larger effect sizes, especially on graphs with many attributes and complex relationship patterns.
The paper situates its contribution relative to prior work on node centrality, community detection, and explanation generation in knowledge graphs. Unlike those, this work explicitly tackles the dual task of grouping and comparing nodes in a property‑rich setting, providing a systematic way to surface non‑obvious contrasts that can guide analysts toward new hypotheses.
In conclusion, the authors deliver a novel, end‑to‑end framework for automatic extraction of node comparison insights in property graphs. The approach is grounded in a formal schema‑driven notion of context, offers a flexible taxonomy of indicators, and supplies practical heuristics that balance speed and insight quality. Future directions include extending indicators to embed textual or visual attributes, incorporating interactive user feedback to dynamically adjust indicator sets, and scaling the algorithms to distributed graph processing platforms such as Apache Spark GraphX or Pregel‑style systems.
Comments & Academic Discussion
Loading comments...
Leave a Comment