SIGMMA: Hierarchical Graph-Based Multi-Scale Multi-modal Contrastive Alignment of Histopathology Image and Spatial Transcriptome
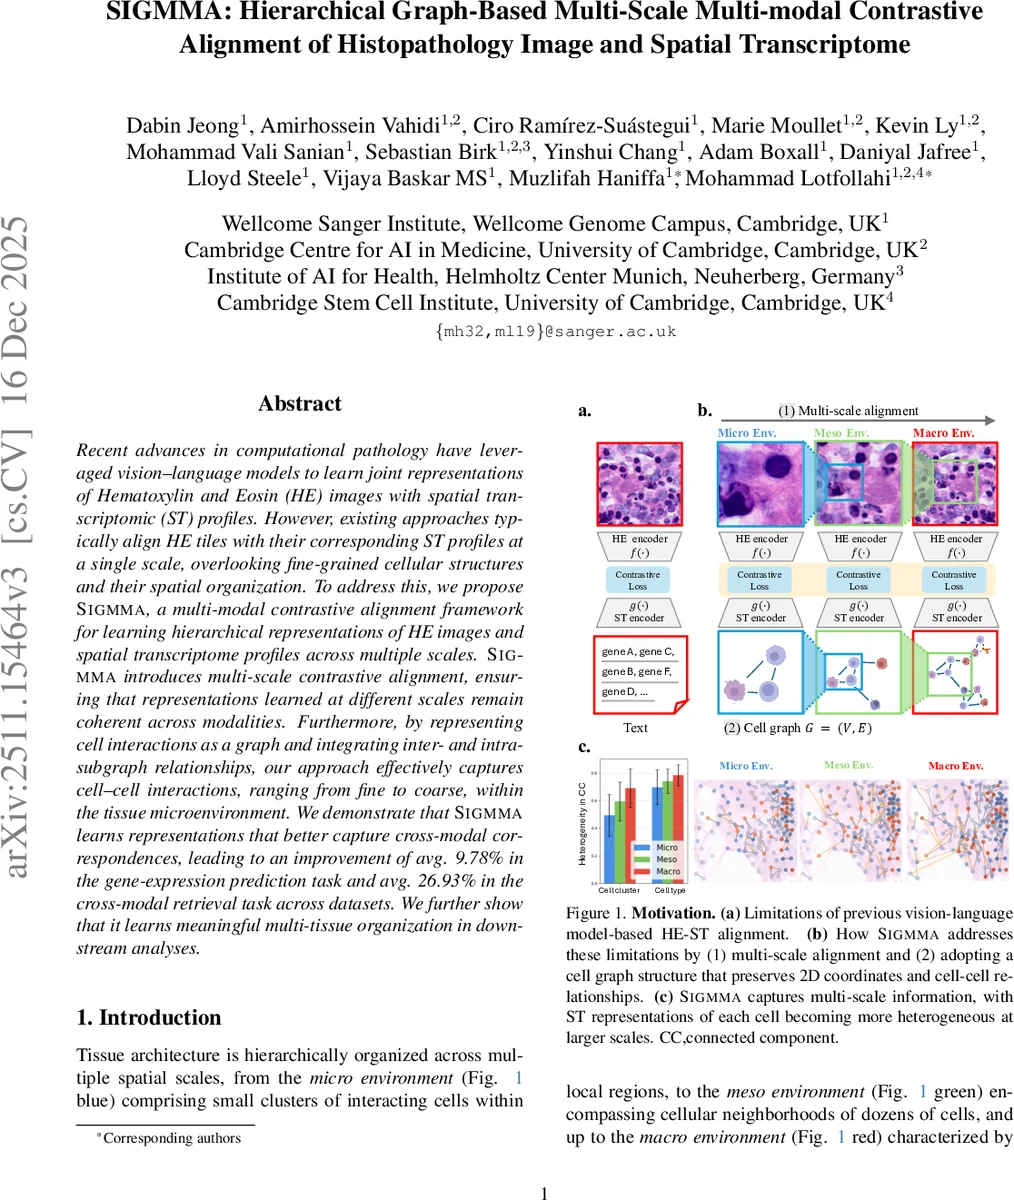
Recent advances in computational pathology have leveraged vision-language models to learn joint representations of Hematoxylin and Eosin (HE) images with spatial transcriptomic (ST) profiles. However, existing approaches typically align HE tiles with their corresponding ST profiles at a single scale, overlooking fine-grained cellular structures and their spatial organization. To address this, we propose Sigmma, a multi-modal contrastive alignment framework for learning hierarchical representations of HE images and spatial transcriptome profiles across multiple scales. Sigmma introduces multi-scale contrastive alignment, ensuring that representations learned at different scales remain coherent across modalities. Furthermore, by representing cell interactions as a graph and integrating inter- and intra-subgraph relationships, our approach effectively captures cell-cell interactions, ranging from fine to coarse, within the tissue microenvironment. We demonstrate that Sigmm learns representations that better capture cross-modal correspondences, leading to an improvement of avg. 9.78% in the gene-expression prediction task and avg. 26.93% in the cross-modal retrieval task across datasets. We further show that it learns meaningful multi-tissue organization in downstream analyses.
💡 Research Summary
SIGMMA introduces a novel hierarchical, graph‑based, multi‑scale contrastive alignment framework for jointly learning representations of Hematoxylin‑Eosin (HE) histopathology images and spatial transcriptomics (ST) data at the cellular level. The authors first identify a key limitation of existing vision‑language (VL) approaches: they typically treat ST profiles as one‑dimensional gene sequences, discarding the intrinsic two‑dimensional spatial topology and cell‑cell interaction information that are crucial for understanding tissue organization. To overcome this, SIGMMA comprises three tightly coupled components.
-
Multi‑scale HE encoder – Each HE tile is partitioned using a multi‑crop strategy into micro (4×4 grid), meso (2×2 grid), and macro (single patch) regions. A pretrained vision foundation model (based on DINO) extracts patch embeddings, which are resized to a common resolution and mean‑pooled within each grid to produce three scale‑specific tile embeddings (z_I_micro, z_I_meso, z_I_macro). This design captures local cellular morphology up to broader tissue context while sharing parameters across scales.
-
Multi‑scale ST encoder – The ST tile is first converted into a cell graph where nodes correspond to individual cells and edges encode spatial proximity. Node features are initialized by a transcriptomic foundation model (Transformer‑based). A stochastic edge‑addition module expands the graph hierarchically: starting from a micro‑scale subgraph, edges are probabilistically added only between cells belonging to neighboring patches (neighbor‑patch constraint). This yields three distinct graph topologies (G_micro, G_meso, G_macro) that align with the image scales. Graph Neural Network (GNN) layers followed by global attention pooling generate scale‑specific graph embeddings (z_S_micro, z_S_meso, z_S_macro).
-
Multi‑scale contrastive alignment – An InfoNCE‑style contrastive loss is applied independently at each scale, pulling together the corresponding HE and ST embeddings while pushing apart mismatched pairs. The total objective is a weighted sum of the three scale losses, encouraging consistent cross‑modal correspondence across micro, meso, and macro contexts.
The framework was evaluated on five publicly available Xenium datasets covering diverse tissue types. Compared with state‑of‑the‑art VL‑based methods, SIGMMA achieved an average 9.78 % improvement in gene‑expression prediction (higher R², lower MAE) and a 26.93 % boost in cross‑modal retrieval (mean average precision). Visualization of the learned latent space using t‑SNE/UMAP revealed that embeddings naturally cluster according to biologically meaningful structures such as tertiary lymphoid aggregates, tumor‑associated fibroblast niches, and vascular regions. Moreover, the stochastic edge‑addition probabilities can be inspected to infer which cell‑cell interactions the model deems informative, providing an interpretable link between morphology and molecular signaling.
Key contributions of SIGMMA include: (i) a graph‑based representation of ST that preserves spatial topology and explicit cell‑cell relationships; (ii) a multi‑scale alignment mechanism that matches the hierarchical receptive fields of images and graphs; (iii) a novel neighbor‑patch constrained stochastic edge addition that reconciles scale mismatches between modalities; and (iv) demonstrable performance gains and interpretability in downstream tasks. By integrating hierarchical spatial information from both imaging and transcriptomic modalities, SIGMMA sets a new benchmark for multimodal tissue analysis and opens avenues for more precise histopathological diagnostics, microenvironment profiling, and spatially resolved precision medicine.
Comments & Academic Discussion
Loading comments...
Leave a Comment