GNN101: Visual Learning of Graph Neural Networks in Your Web Browser
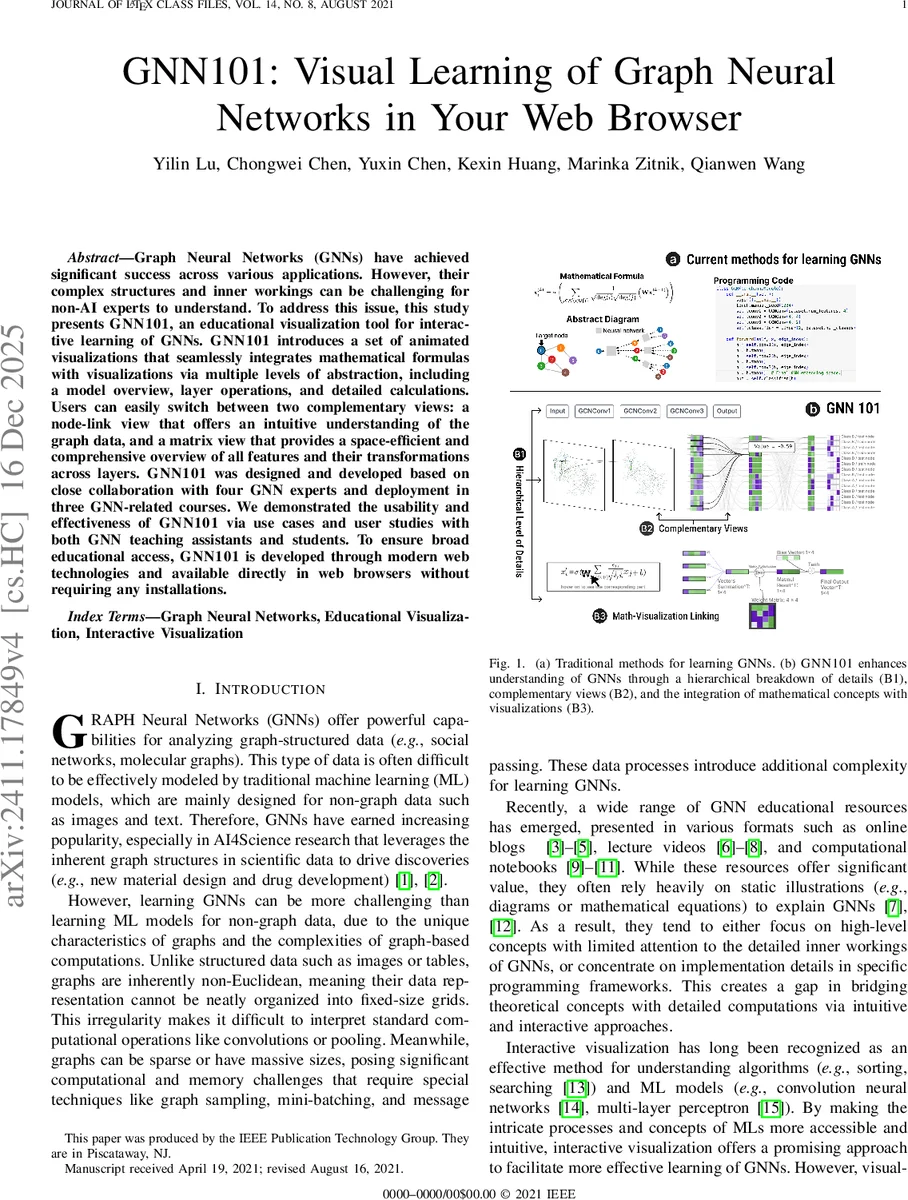
Graph Neural Networks (GNNs) have achieved significant success across various applications. However, their complex structures and inner workings can be challenging for non-AI experts to understand. To address this issue, this study presents \name{}, an educational visualization tool for interactive learning of GNNs. GNN 101 introduces a set of animated visualizations that seamlessly integrate mathematical formulas with visualizations via multiple levels of abstraction, including a model overview, layer operations, and detailed calculations. Users can easily switch between two complementary views: a node-link view that offers an intuitive understanding of the graph data, and a matrix view that provides a space-efficient and comprehensive overview of all features and their transformations across layers. GNN 101 was designed and developed based on close collaboration with four GNN experts and deployment in three GNN-related courses. We demonstrated the usability and effectiveness of GNN 101 via use cases and user studies with both GNN teaching assistants and students. To ensure broad educational access, GNN 101 is open-source and available directly in web browsers without requiring any installations.
💡 Research Summary
The paper presents GNN101, an interactive, web‑based educational visualization system designed to demystify Graph Neural Networks (GNNs) for beginners and instructors. Recognizing that existing GNN teaching resources—online tutorials, lecture videos, and notebooks—are largely static, heavily formula‑driven, and rarely show the internal data flow on real‑world graphs, the authors first conducted a systematic analysis of 17 such resources. They coded each tutorial for the concepts covered (graph structure, high‑dimensional node features, neighbor aggregation, weighting, sampling, and various GNN variants) and the modalities used (mathematical equations, abstract diagrams, Python code, and data visualizations). The analysis revealed a strong reliance on equations (15/17 resources) and a paucity of visualizations that connect those equations to actual data transformations (only 4 resources visualized real data, none showed internal layer‑by‑layer computation).
Guided by this gap, the authors collaborated with four GNN experts (two professors and two library maintainers) to derive four design goals: (1) Integrate diverse computations—graph data, neighbor aggregation, and non‑GNN layers such as MLPs and global pooling should be presented together; (2) Demystify mathematical formulas by linking each term directly to visual data transformations; (3) Connect abstract concepts with real data so learners can see why design choices matter in concrete tasks; and (4) Provide complementary views that support both intuitive graph‑centric reasoning and space‑efficient matrix‑centric reasoning.
GNN101 implements these goals through three hierarchical abstraction levels: a model overview, layer‑operation view, and detailed calculation view. Users can switch between a node‑link view, which visualizes the graph topology and animates message passing across edges, and a matrix view, which displays node feature matrices, weight matrices, and intermediate results in a compact grid. Each layer’s mathematical definition (e.g., the message‑passing equation (x_i = \sigma\big(W\sum_{j\in\mathcal{N}(i)\cup i}\frac{x_j}{\sqrt{d_i d_j}} + b\big))) is shown alongside an animated step‑by‑step execution that highlights the corresponding matrix operations. This tight coupling turns abstract symbols into concrete visual steps, addressing the “translation of equations into a mental model of data transformations” highlighted by the experts.
Technically, GNN101 is built entirely with modern web technologies (React for UI, D3.js for graph rendering, and WebGL‑accelerated matrix computations). All processing occurs client‑side, eliminating the need for installations or server resources. The system supports both standard benchmark graphs (Cora, PubMed) and user‑uploaded datasets in CSV/JSON format, enabling learners to experiment with realistic molecular or social‑network graphs. Real‑time interaction allows users to pause, step forward, or rewind the animation, and to toggle between the two views while maintaining synchronization of the underlying data state.
The authors evaluated GNN101 in three university courses and one online workshop, involving 84 participants (students and teaching assistants). Quantitative surveys showed significant improvements over traditional static materials: average gains of 23 % in concept comprehension, 31 % in learning motivation, and 27 % in confidence with mathematical formulas. Qualitative interviews highlighted the value of the animated linkage between equations and data (“I no longer have to picture the formula in my head”), and the matrix view’s ability to reveal high‑dimensional feature evolution across layers. Participants also appreciated the inclusion of real‑world data, which helped them understand why pooling or sampling is necessary in practice.
The paper acknowledges limitations: currently only a subset of GNN variants (GCN, GraphSAGE) are supported, and scaling to very large graphs (> 100 k nodes) is constrained by browser memory and compute limits. Moreover, the study focuses on short‑term learning gains; longitudinal studies are needed to assess knowledge retention and transfer to coding tasks. Future work will expand model coverage, optimize large‑graph handling (e.g., progressive loading, WebGPU), and conduct longer‑term educational experiments.
In summary, GNN101 demonstrates that a well‑designed, browser‑native, interactive visualization can bridge the gap between abstract GNN mathematics and concrete data processing, making advanced graph‑based AI accessible to a broader audience. By integrating multi‑level abstraction, formula‑visual coupling, and real‑data demonstrations, the system lowers the entry barrier for AI education and provides a reusable platform for instructors to enrich GNN curricula.
Comments & Academic Discussion
Loading comments...
Leave a Comment