Comparing Baseline and Day-1 Diffusion MRI Using Multimodal Deep Embeddings for Stroke Outcome Prediction
This study compares baseline (J0) and 24-hour (J1) diffusion magnetic resonance imaging (MRI) for predicting three-month functional outcomes after acute ischemic stroke (AIS). Seventy-four AIS patients with paired apparent diffusion coefficient (ADC)…
Authors: Sina Raeisadigh, Myles Joshua Toledo Tan, Henning Müller
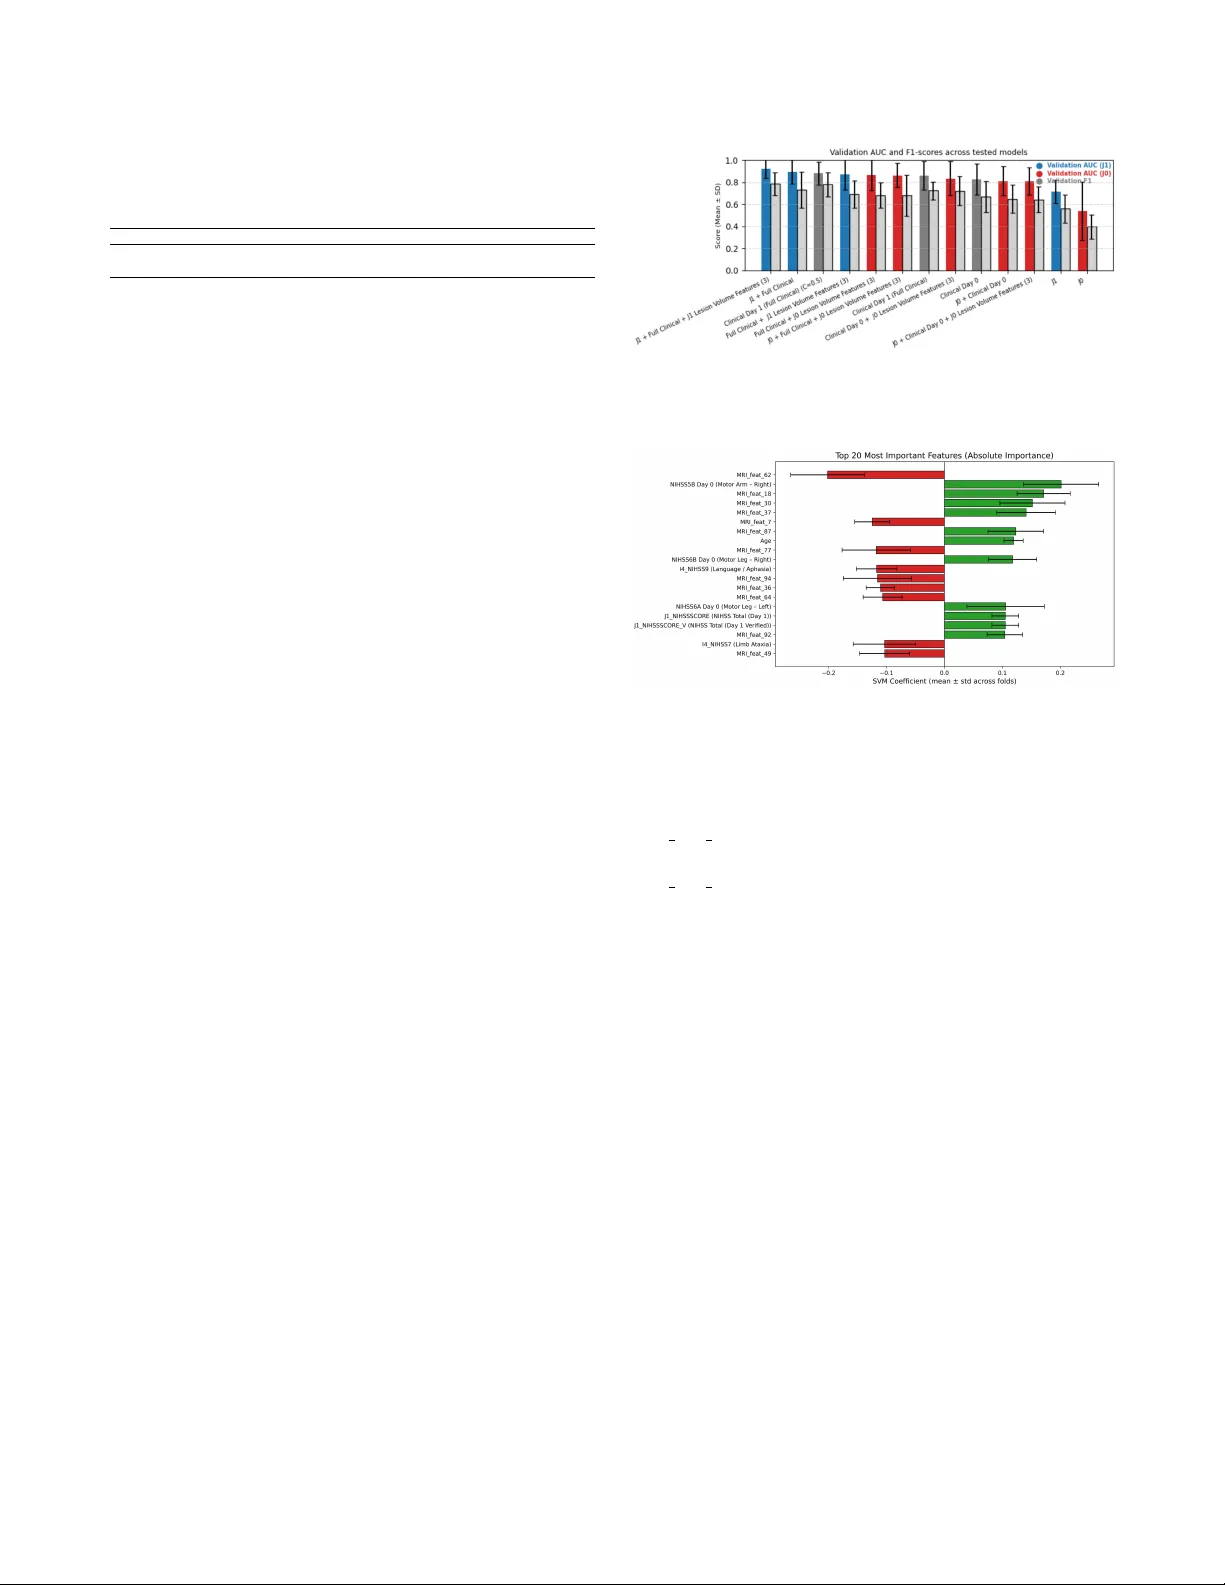
COMP ARING B ASELINE AND D A Y -1 DIFFUSION MRI USING MUL TIMOD AL DEEP EMBEDDINGS FOR STR OKE OUTCOME PREDICTION Sina Raeisadigh 1 , Myles J oshua T oledo T an 2 , Henning M ¨ uller 3 , Abderrahmane Hedjoudje 4 1 Department of Computer Science, Uni versity of Gene v a, Switzerland 2 Department of Electrical & Computer Engineering, Uni versity of Florida, FL, USA 3 Service of Medical Informatics, Uni versity Hospital of Gene v a, Switzerland 4 Department of Imaging and Medical Informatics, Uni versity of Gene v a, Switzerland ABSTRA CT This study compares baseline (J0) and 24-hour (J1) dif- fusion magnetic resonance imaging (MRI) for predicting three-month functional outcomes after acute ischemic stroke (AIS). Se venty-four AIS patients with paired apparent diffu- sion coef ficient (ADC) scans and clinical data were analyzed. Three-dimensional ResNet-50 embeddings were fused with structured clinical variables, reduced via principal compo- nent analysis ( ≤ 12 components), and classified using lin- ear support vector machines with eight-fold stratified group cross-validation. J1 multimodal models achiev ed the highest predictiv e performance (A UC = 0.923 ± 0.085), outperform- ing J0-based configurations (A UC ≤ 0.86). Incorporating lesion-volume features further impro ved model stability and interpretability . These findings demonstrate that early post- treatment dif fusion MRI provides superior prognostic value to pre-treatment imaging and that combining MRI, clinical, and lesion-volume features produces a rob ust and interpretable framew ork for predicting three-month functional outcomes in AIS patients. Index T erms — acute ischemic stroke, deep learning, diffusion-weighted MRI, functional outcome prediction, modified Rankin Scale 1. INTR ODUCTION Acute ischemic stroke (AIS) is a leading cause of death and long-term disability worldwide [1]. Reliable early predic- tion of post-strok e functional outcome is critical for treat- ment planning, rehabilitation, and patient selection in clini- cal trials [2]. The three-month modified Rankin Scale (mRS) remains the standard measure of disability [3], yet accurate early prediction remains challenging due to heterogeneity in stroke mechanisms, treatment response, and recovery . Such a personalized prognostic model can support treatment deci- sions, rehabilitation planning, and adapti ve trial enrollment, addressing a major unmet clinical need in stroke manage- ment. Diffusion-weighted MRI (DWI) and its quantitative map, the apparent diffusion coefficient (ADC), are sensitive to early ischemic injury [4]. Baseline (J0) ADC reflects the infarct core, while day-1 (J1) imaging captures infarct ev olution, re- perfusion, and secondary injury processes [5, 6]. Although both time points are acquired routinely , their relativ e prognos- tic value for long-term functional outcome remains unclear . T raditional models combining clinical scores such as age, NIHSS (National Institutes of Health Stroke Score), and pre- stroke mRS achiev e moderate predicti ve accuracy (A UC ≈ 0.75–0.80) [7], but underuse imaging biomarkers reflecting dynamic tissue changes. Deep learning enables automated extraction of high-dimensional image representations [8, 9], and recent multimodal models integrating imaging and clin- ical data ha ve improv ed prediction [10, 11]. Ho we ver , most prior studies focus solely on baseline imaging. T o our knowledge, this is the first study to directly com- pare baseline (J0) and early follo w-up (J1) diffusion MRI for predicting three-month functional outcome in AIS using a unified multimodal deep-embedding framework. W e hy- pothesize that post-treatment (J1) imaging, combined with clinical and lesion-v olume features, can improv e predictiv e performance and interpretability . Our frame work integrates 3D ResNet-derived ADC embeddings with structured clinical variables and applies Principal Component Analysis (PCA) for dimensionality reduction and linear SVM classification to enable transparent, data-efficient outcome prediction. Functional outcome prediction after AIS has relied on clinical scoring and regression models. Baseline neurolog- ical severity (NIHSS), age, and pre-stroke mRS remain the strongest predictors of three-month outcomes [2]. Logistic or Cox models using these v ariables achieve moderate accuracy (A UC ≈ 0.75–0.80) [7, 12], but lack sensitivity to imaging biomarkers reflecting infarct e v olution or treatment response. Machine learning and deep learning methods can further improv e prediction by combining imaging and clinical fea- tures [13, 10, 8]. CNNs and 3D architectures enable auto- mated feature e xtraction from ADC maps [14, 15], and mul- timodal fusion models sho w superior accuracy [11]. Y et most Fig. 1 . Thresholding of lesion-lik e regions in ADC maps at different intensity lev els. (Left) Raw slice, (Middle) Thresh- old < 620, (Right) Threshold < 480. prior work e valuates only baseline scans. T o mitigate redundancy in deep embeddings, PCA often offers efficient dimensionality reduction and improv ed gener - alization [16]. Our study builds on this by comparing J0 and J1 imaging, integrating deep volumetric and clinical features, and employing PCA-based fusion with linear SVM classifi- cation for interpretable AIS outcome prediction. 2. METHODS 2.1. Study Cohort and Clinical Data 74 patients with AIS who underwent D WI MRI at J0 and J1 were retrospectively selected from a prospecti ve registry under institutional approval. Inclusion required paired ADC volumes, complete clinical records (NIHSS subscores, pre- stroke mRS), and av ailable three-month mRS. Demograph- ics, v ascular risk factors, pre-mRS, and NIHSS (J0, J1) were included. Both anterior and posterior strokes were included; outcomes were 55.4% fav orable (mRS ≤ 1) and 44.6% unfa- vorable (mRS > 1). Missing v alues were imputed using me- dian substitution, and all data were anon ymized. The o verall data processing and modeling workflo w is illustrated in Fig- ure 2, which summarizes each step from image preprocessing and lesion extraction to feature fusion and classification. 2.2. MRI Processing and Lesion F eatures ADC maps reconstructed from 1.5 T and 3 T D WI were re- sampled via trilinear interpolation to a unified 3D resolution of 24 × 256 × 256 voxels. Lesion-like regions were segmented using percentile- based intensity thresholds (480 and 620 × 10 − 6 mm 2 /s), followed by morphological filtering and removal of small components ( < 150 vox els). An example of the threshold- ing process at dif ferent intensity levels is shown in Figure 1, where (left) shows the raw slice, (middle) shows the result for threshold < 620, and (right) sho ws the result for thresh- old < 480. Lesion volume ( V lesion = N voxels × V voxel ) was log-transformed and concatenated with clinical data. Fig. 2 . Overvie w of the proposed multimodal pipeline com- bining clinical data and ADC imaging (J0, J1). Lesion v ol- umes and deep MRI embeddings are fused, reduced via PCA, and classified using a linear SVM. 2.3. Deep Featur e Extraction and Fusion V olume features are extracted with a pretrained 3D ResNet- 50 (MedicalNet [17]) implemented in MON AI [18] (Medical Open Network for AI). Separate branches processed J0 and J1 ADC input, with global av erage pooling producing 2048-D embeddings projected to 32–256 units. Networks operated in frozen mode, and embeddings were concatenated with clini- cal and lesion-v olume features. Feature importance is deri ved from standard SVM coefficients and MRI salienc y maps. 2.4. Dimensionality Reduction and Classification Fused multimodal embeddings were reduced using PCA, re- taining up to 12 components ( > 95% variance). PCA was fit on training folds only . Reduced features were classified via linear SVMs ( C =0 . 1 ) with class-balanced weighting and Platt scaling [19]. Models include (1) MRI-only , (2) clinical- only , and (3) multimodal (with/without lesion volumes). 2.5. Evaluation and Implementation Performance was e valuated with eight-fold StratifiedGroup- KFold cross-v alidation, reporting mean ± SD (Standard Deviation) for A UC, accuracy , and F1-score. All analy- ses use PyT orch [20], MON AI [18], and scikit-learn [21] (Python 3.10) on a T esla V100 GPU. Model performance was compared across eight stratified group cross-validation folds. The W ilcoxon signed-rank test [22] was used to assess paired differences in v alidation A UC between J0 and J1 mul- timodal configurations. A one-sided test was applied to test the hypothesis that J1 models outperform J0 models. T able 1 . Performance of MRI-only models for predicting three-month mRS ( ≤ 1 vs. > 1). V alues are mean ± standard deviation across folds. Model A UC Accuracy F1-score J0 ADC (MRI-only) 0 . 540 ± 0 . 263 0 . 433 ± 0 . 147 0 . 396 ± 0 . 110 J1 ADC (MRI-only) 0 . 714 ± 0 . 105 0 . 633 ± 0 . 066 0 . 560 ± 0 . 128 3. RESUL TS 3.1. Comparison of J0 and J1 MRI Models MRI-only models use 3D ResNet-50 embeddings from J0/J1 ADC, with 12 PCA components, classified with class- balanced linear SVMs. In T able 1, J1 outperformed J0 across metrics (A UC 0 . 714 ± 0 . 105 vs. 0 . 540 ± 0 . 263 ; accuracy 0 . 633 vs. 0 . 433 ; F1 0 . 560 vs. 0 . 396 ), indicating 24 h diffu- sion changes provide stronger prognostic signal than baseline. 3.2. Clinical and Multimodal Model Perf ormance Models trained only on clinical features achiev ed moderate performance (A UC = 0 . 882 ± 0 . 105 , accuracy = 0 . 808 ± 0 . 101 , F1-score = 0 . 780 ± 0 . 111 ), confirming the predicti ve value of age, pre-stroke mRS, and NIHSS scores. Integrating imaging features further improv es results in terms of A UC. When combining J1 MRI embeddings with full clinical vec- tors, the multimodal model reached A UC = 0 . 894 ± 0 . 106 , accuracy = 0 . 794 ± 0 . 096 , and F1-score = 0 . 731 ± 0 . 163 . Adding lesion-v olume metrics deri ved from ADC threshold- ing provided additional gains, achieving A UC = 0 . 923 ± 0 . 085 , accurac y = 0 . 824 ± 0 . 083 , and F1-score = 0 . 786 ± 0 . 104 —the highest o verall performance among all configura- tions (T able 2). The final J1 multimodal configuration (J1 + clinical + J1 lesion v olume) achiev ed higher v alidation A UCs compared to the corresponding J0 configuration (J0 + clin- ical + J0 lesion volume; 0.923 ± 0.079 vs. 0.811 ± 0.115; W ilcoxon signed-rank test, p = 0.0078), confirming the supe- rior prognostic value of early post-treatment dif fusion MRI. Figure 3 shows validation performance across models. J1 multimodal configurations outperformed J0 and clinical-only baselines, with lesion-volume features providing the highest A UC and F1-scores alone. PCA is critical for stable training with our small dataset. W ithout PCA, SVMs show unstable con ver gence and large variance. A 12-component configuration produced the most consistent validation A UCs while preserving interpretability . 3.3. Featur e Importance and Explainability Feature importance deriv ed from linear SVM coefficients, shown in Figure 4, rev ealed that both clinical and M RI- deriv ed aspects contribute to outcome prediction. The high- est positiv e weights corresponded to motor NIHSS sub- scores (Day 0 Right arm motor drift, Day 0 Left arm motor Fig. 3 . V alidation A UC and F1 across tested models. J1 multi- modal configurations outperformed J0 and clinical baselines. Fig. 4 . Feature importance deri ved from linear SVM coef fi- cients drift) and age, while sev eral MRI-deri ved embeddings (e.g., MRI feat 18, 30, 37) also rank among the best predictors. Negati ve weights were dominated by MRI features (e.g., MRI feat 62, 7, 77) and the NIHSS9 (Language/aphasia) subscore. These results indicate that clinical measures of mo- tor impairment and selected diffusion-based latent features jointly drive discrimination between fa vorable and unfa vor - able outcomes. 4. DISCUSSION This study sho ws that integrating quantitati ve dif fusion MRI with structured clinical data enables accurate prediction of three-month outcomes after AIS. Comparison of J0 and J1 ADC imaging demonstrates that J1 models outperform base- line models, confirming that early post-treatment diffusion changes provide key prognostic information. Multimodal fu- sion with PCA improve model stability . The better J1 perfor- mance reflects the prognostic value of early tissue dynamics related to reperfusion, collateral flo w , and secondary injury . The J1 MRI-only model achiev es A UC = 0 . 714 ± 0 . 105 versus 0 . 540 ± 0 . 263 for J0, while the multimodal J1 + clinical + lesion-v olume model reaches 0 . 923 ± 0 . 085 , the highest accuracy consistent with previous findings on 24- h D WI/ADC imaging [5, 10]. Clinical v ariables such as age, pre-stroke mRS, and NIHSS contribute strongly (A UC = 0 . 882 ± 0 . 105 ), confirming their complementary role. T able 2 . Summary of multimodal configurations (mean ± Standar across 8 folds). PCA dimension fixed at 12 components. Configuration V al AUC V al Acc V al F1 T rain AUC T rain Acc T rain F1 J1 + Full Clinical + J1 Lesion V olume 0.923 ± 0.085 0.824 ± 0.083 0.786 ± 0.104 0.941 ± 0.011 0.898 ± 0.018 0.884 ± 0.021 J1 + Full Clinical 0.894 ± 0.106 0.794 ± 0.096 0.731 ± 0.163 0.918 ± 0.015 0.888 ± 0.025 0.876 ± 0.031 Clinical (Day 1 only) 0.882 ± 0.105 0.808 ± 0.101 0.780 ± 0.111 0.912 ± 0.010 0.853 ± 0.023 0.832 ± 0.024 Full Clinical + J0 Lesion V olume 0.864 ± 0.136 0.740 ± 0.106 0.683 ± 0.117 0.884 ± 0.012 0.824 ± 0.039 0.793 ± 0.050 J0 + Full Clinical + J0 Lesion V olume 0.863 ± 0.111 0.768 ± 0.113 0.682 ± 0.185 0.887 ± 0.015 0.840 ± 0.021 0.811 ± 0.028 Fig. 5 . MRI feature maps and histograms for two patients with different three-month mRS scores Adding lesion-volume improves interpretability and raises A UC by 0.03, highlighting infarct size as an independent predictor . PCA stabilizes multimodal fusion by reducing 3D ResNet embeddings to 8–12 orthogonal components ( > 95% variance), ensuring consistent SVM con ver gence and of fering a reproducible alternativ e to nonlinear embeddings [20, 21]. Among clinical predictors, admission NIHSS motor sub- scores (Day 0 left arm motor drift and right arm motor drift) and age had the highest positiv e weights, aligning with es- tablished prognostic factors. MRI-deriv ed embeddings also contribute but do not yield stable anatomical activ ation pat- terns, likely due to the small dataset. Nevertheless, Figure 5 demonstrates MRI feature maps for two patients (P atient 171 with mRS = 3.0 and P atient 179 with mRS = 1.0). The gradient-based heat maps sho w coherent activ ation within the infarcted hemisphere in se vere strokes, suggesting that larger or more homogeneous lesions are better captured. This high- lights the complementary roles of structured clinical variables and learned MRI representations in interpretable multimodal prediction. Unlike end-to-end networks, our PCA–SVM pipeline of- fers more transparency . Each principal component and SVM coefficient can be inspected, enabling clinicians to trace pre- dictions to specific clinical or image contributors. This makes the framework easier to audit, calibrate and integrate into clin- ical decision support [23]. Early post-treatment MRI enables personalized prognosis by capturing reperfusion success and early tissue evolution, identifying patients at risk of poor recov ery despite recanalization. The PCA–SVM pipeline, combining lesion metrics with structured clinical/imaging features, supports transparent translation. Study limitations include the small sample, automated lesion se gmentation and scanner variability . W e plan to test the framew ork in larger cohorts and explore better segmentation, radiomics and multimodality (e.g., perfusion MRI, CT angiography). 5. CONCLUSION J1 dif fusion MRI provides better prognostic v alue compared with baseline imaging. Integrating deep MRI embeddings with clinical and lesion-v olume features (A UC > 0.92) yields a robust, interpretable, and data-efficient model. PCA sta- bilization enhances reliability and transparency , enabling reproducible outcome prediction. Ov erall, the proposed PCA–SVM frame work offers a clinically translatable foun- dation for personalized strok e prognosis and will be v alidated on multicenter longitudinal data. Compliance with Ethical Standards This retrospective study used anonymized clinical data ac- quired as part of routine care. According to the institutional guidelines of the Uni versity of Gene va and the Univ ersity Hospital of Genev a, the study is covered under existing ret- rospectiv e data-use approv als, and no additional protocol- specific ethics approv al was required. The study was con- ducted in accordance with the principles of the Declaration of Helsinki. Repr oducibility and Acknowledgments This work w as supported by the FORDEMS F oundation. The authors declare no competing interests. Data and implemen- tation details are av ailable upon request. 6. REFERENCES [1] V . L. Feigin et al. , “Global, re gional, and national b ur- den of stroke and its risk factors, 1990–2019: a sys- tematic analysis for the global b urden of disease study 2019, ” Lancet Neurol. , v ol. 20, no. 10, pp. 795–820, 2021. [2] W . D. Heiss, “Contrib ution of neuro-imaging for predic- tion of functional reco very after ischemic stroke, ” Cer e- br ovascular Diseases , vol. 44, no. 5-6, pp. 266–276, 2017. [3] J. L. Banks and C. A. Marotta, “Outcomes validity and reliability of the modified rankin scale: implications for stroke clinical trials: a literature re view and synthesis, ” Str oke , vol. 38, no. 3, pp. 1091–1096, 2007. [4] S. W arach, D. Chien, W . Li, M. Ronthal, and R. R. Edelman, “Fast magnetic resonance diffusion-weighted imaging of acute human stroke, ” Neur ology , vol. 42, no. 9, pp. 1717–1717, 1992. [5] B. C. Campbell et al. , “ Acute stroke imaging research roadmap iv: imaging selection and outcomes in acute stroke clinical trials and practice, ” Str oke , v ol. 52, no. 8, pp. 2723–2733, 2021. [6] M. Go yal et al. , “Challenging the ischemic core concept in acute ischemic strok e imaging, ” Str oke , vol. 51, no. 10, pp. 3147–3155, 2020. [7] J. B. Fiebach et al. , “Ct and dif fusion-weighted mr imaging in randomized order: dif fusion-weighted imag- ing results in higher accuracy and lower interrater v ari- ability in the diagnosis of hyperacute ischemic stroke, ” Str oke , vol. 33, no. 9, pp. 2206–2210, 2002. [8] A. Estev a et al. , “ A guide to deep learning in healthcare, ” Natur e Medicine , vol. 25, no. 1, pp. 24–29, 2019. [9] A. Nielsen, M. B. Hansen, A. T ietze, and K. Mouridsen, “Prediction of tissue outcome and assessment of treat- ment effect in acute ischemic stroke using deep learn- ing, ” Str oke , vol. 49, no. 6, pp. 1394–1401, 2018. [10] D. Y . Kim et al. , “Deep learning-based personalised out- come prediction after acute ischaemic strok e, ” Journal of Neur ology , Neur osurgery & Psychiatry , v ol. 94, no. 5, pp. 369–378, 2023. [11] D. Ma, M. W ang, A. Xiang, Z. Qi, and Q. Y ang, “T ransformer-based classification outcome prediction for multimodal stroke treatment, ” in 2024 IEEE 2nd International Confer ence on Sensors, Electronics and Computer Engineering (ICSECE) . 2024, pp. 383–386, IEEE. [12] A. W outers, C. Nysten, V . Thijs, and R. Lemmens, “Prediction of outcome in patients with acute ischemic stroke based on initial se verity and improv ement in the first 24 h, ” F r ontiers in Neurolo gy , v ol. 9, pp. 308, 2018. [13] Y . LeCun, Y . Bengio, and G. Hinton, “Deep learning, ” Natur e , vol. 521, no. 7553, pp. 436–444, 2015. [14] S. W inzeck et al. , “Isles 2016 and 2017-benchmarking ischemic stroke lesion outcome prediction based on multispectral mri, ” F rontier s in Neurolo gy , vol. 9, pp. 679, 2018. [15] Y . Liu et al. , “Functional outcome prediction in acute ischemic stroke using a fused imaging and clinical deep learning model, ” Strok e , v ol. 54, no. 9, pp. 2316–2327, 2023. [16] S. W old, K. Esbensen, and P . Geladi, “Principal com- ponent analysis, ” Chemometrics and Intelligent Labo- ratory Systems , v ol. 2, no. 1-3, pp. 37–52, 1987. [17] S. Chen, K. Ma, and Y . Zheng, “Med3d: T ransfer learning for 3d medical image analysis, ” arXiv pr eprint arXiv:1904.00625 , 2019. [18] M. J. Cardoso et al. , “Monai: An o pen-source frame- work for deep learning in healthcare, ” arXiv preprint arXiv:2211.02701 , 2022. [19] C. Cortes and V . V apnik, “Support-vector networks, ” Machine Learning , v ol. 20, no. 3, pp. 273–297, 1995. [20] A. Paszk e et al. , “Pytorch: An imperati ve style, high- performance deep learning library , ” Advances in Neur al Information Pr ocessing Systems , vol. 32, 2019. [21] F . Pedregosa et al. , “Scikit-learn: Machine learning in python, ” The Journal of Machine Learning Resear ch , vol. 12, pp. 2825–2830, 2011. [22] F . W ilcoxon, “Individual comparisons by ranking meth- ods, ” Biometrics Bulletin , v ol. 1, no. 6, pp. 80–83, 1945. [23] C. Rudin, “Stop explaining black box machine learning models for high stakes decisions and use interpretable models instead, ” Nature Machine Intellig ence , vol. 1, no. 5, pp. 206–215, 2019.
Original Paper
Loading high-quality paper...
Comments & Academic Discussion
Loading comments...
Leave a Comment