📝 Original Info
- Title: Statistical Arbitrage in Polish Equities Market Using Deep Learning Techniques
- ArXiv ID: 2512.02037
- Date: 2025-11-20
- Authors: Researchers from original ArXiv paper
📝 Abstract
We study a systematic approach to a popular Statistical Arbitrage technique: Pairs Trading. Instead of relying on two highly correlated assets, we replace the second asset with a replication of the first using risk factor representations. These factors are obtained through Principal Components Analysis (PCA), exchange traded funds (ETFs), and, as our main contribution, Long Short Term Memory networks (LSTMs). Residuals between the main asset and its replication are examined for mean reversion properties, and trading signals are generated for sufficiently fast mean reverting portfolios.
Beyond introducing a deep learning based replication method, we adapt the framework of Avellaneda and Lee (2008) to the Polish market. Accordingly, components of WIG20, mWIG40, and selected sector indices replace the original S&P500 universe, and market parameters such as the risk free rate and transaction costs are updated to reflect local conditions.
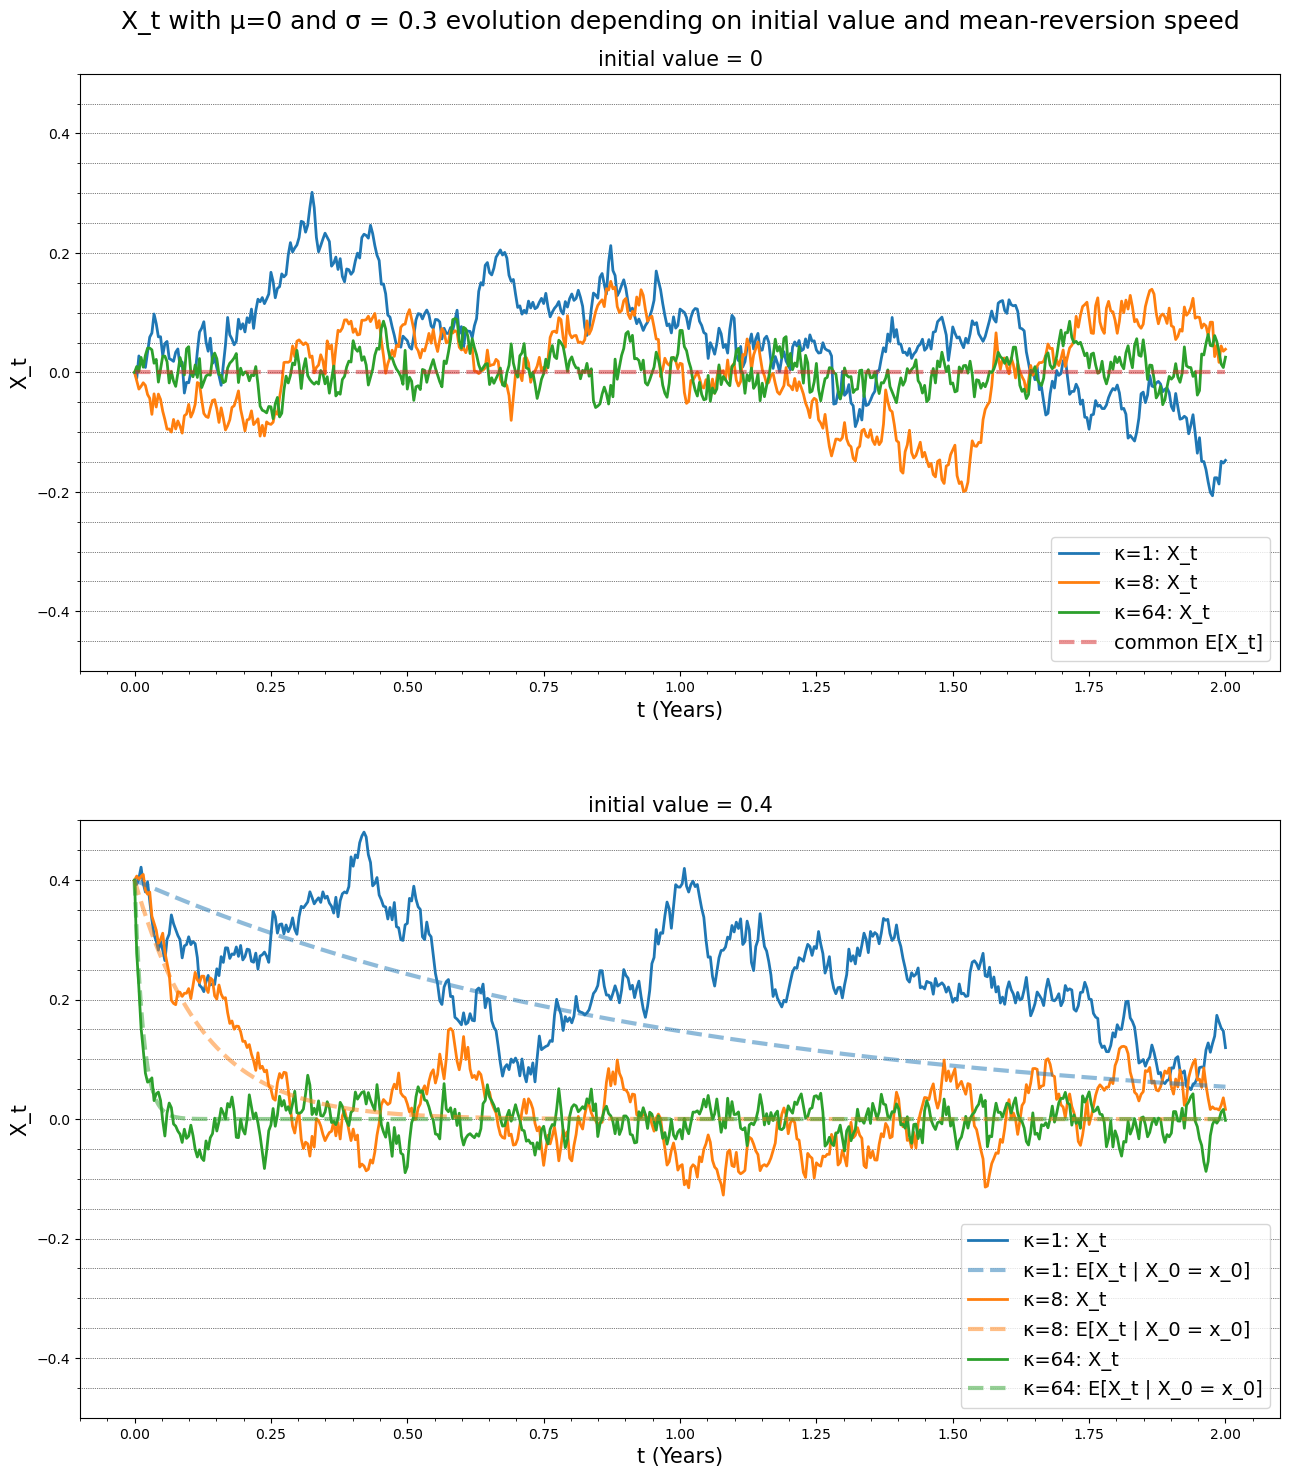
We outline the full strategy pipeline: risk factor construction, residual modeling via the Ornstein Uhlenbeck process, and signal generation. Each replication technique is described together with its practical implementation. Strategy performance is evaluated over two periods: 2017-2019 and the recessive year 2020.
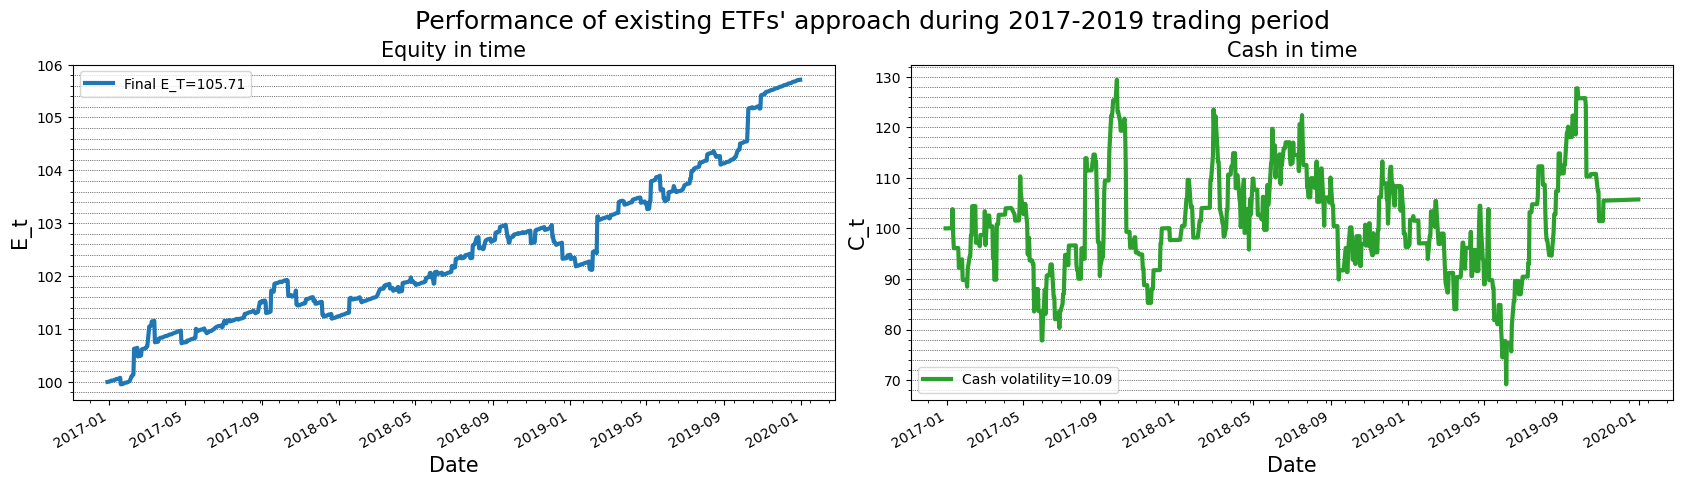
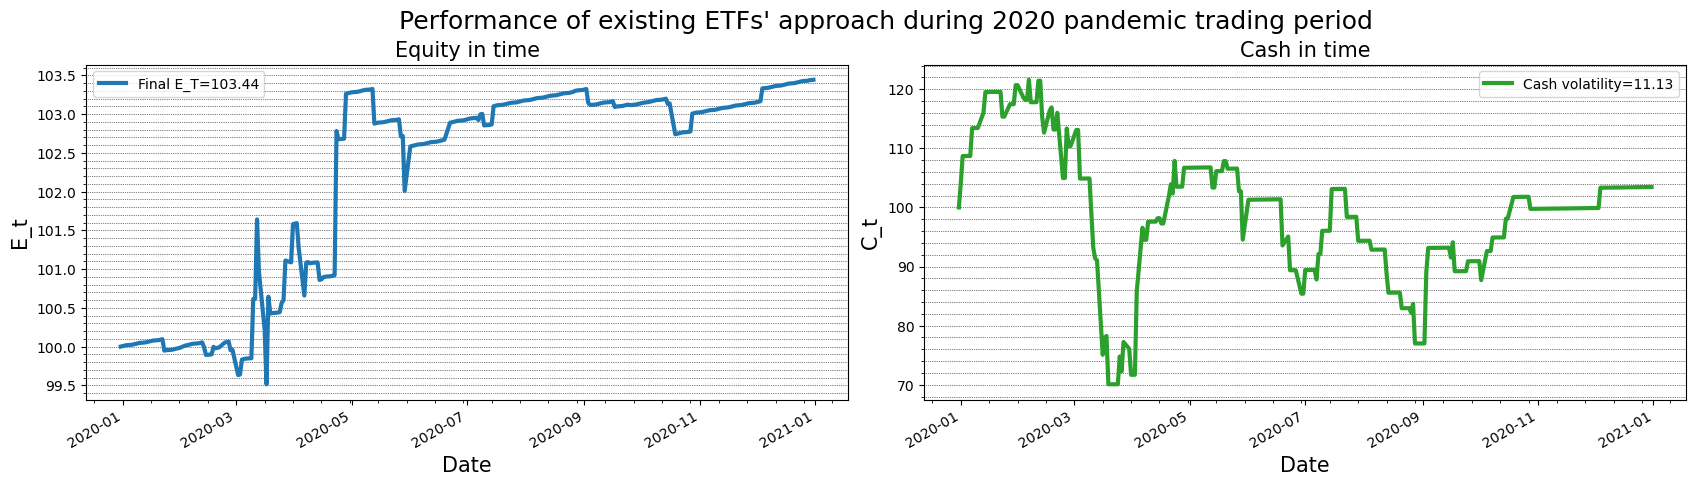
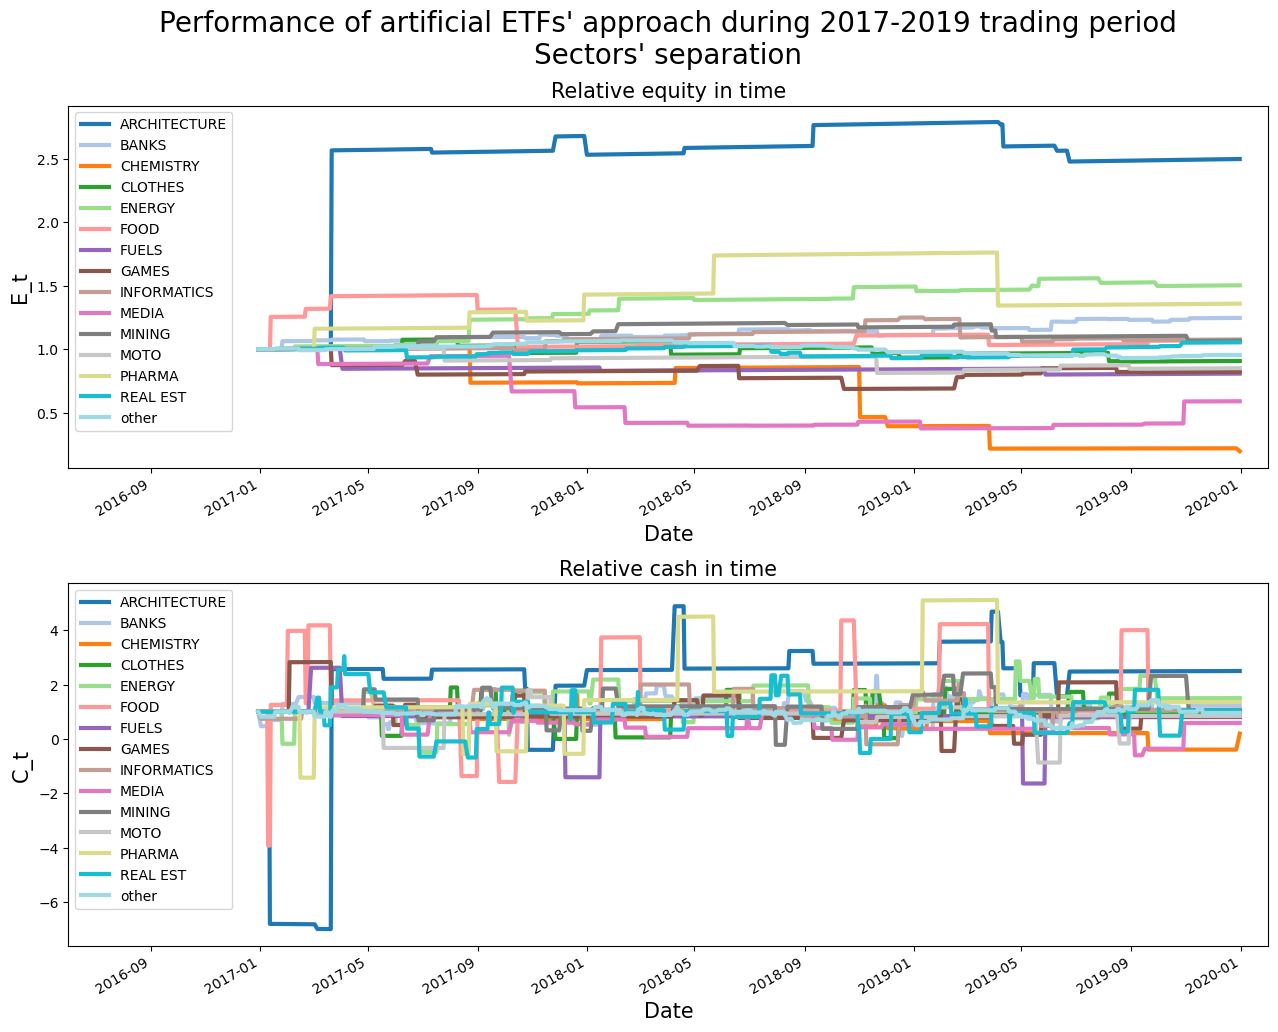
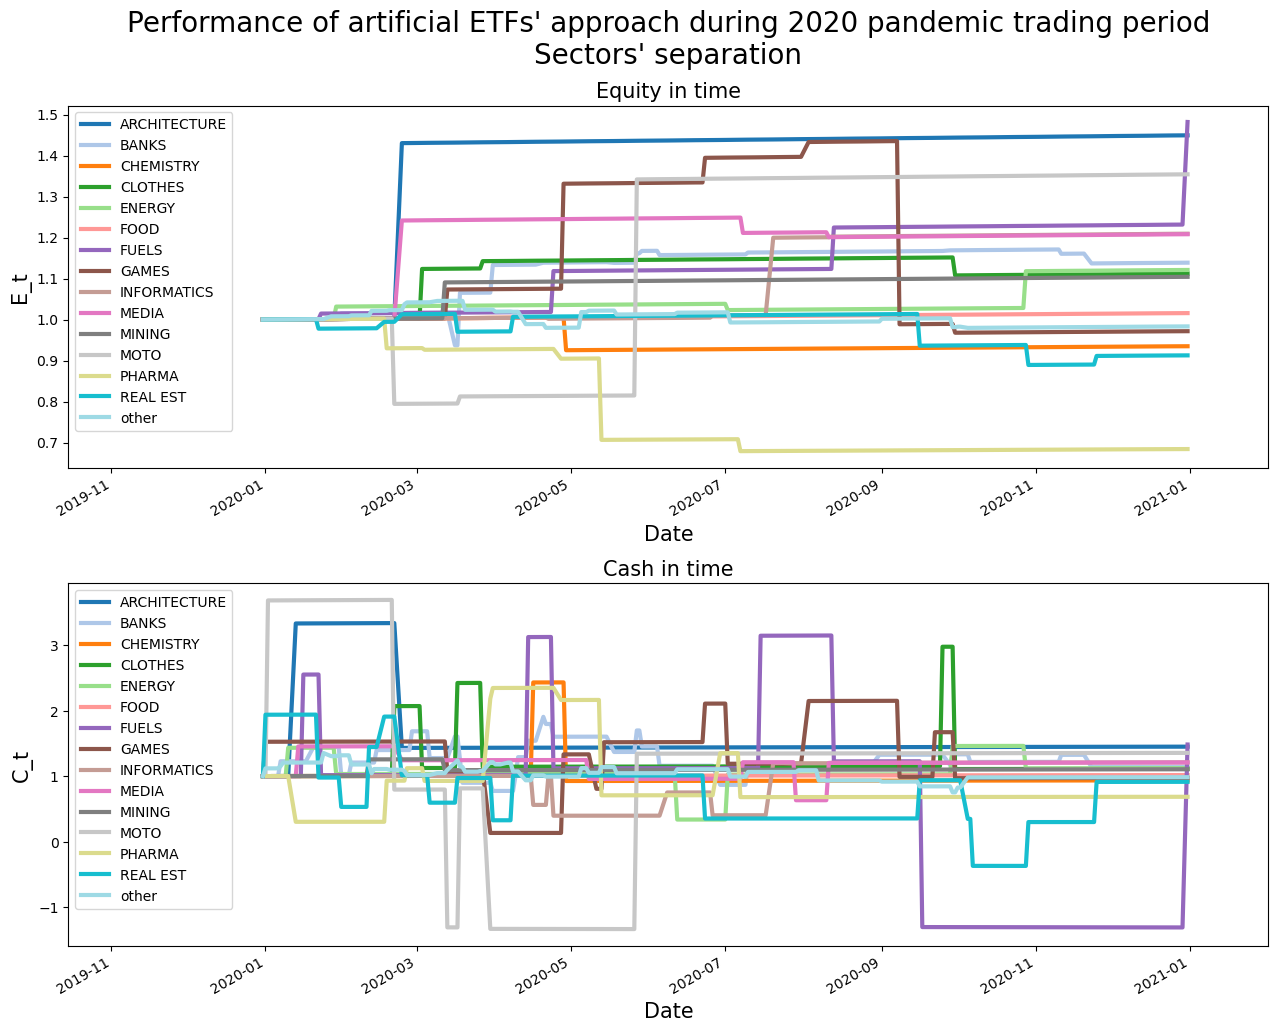
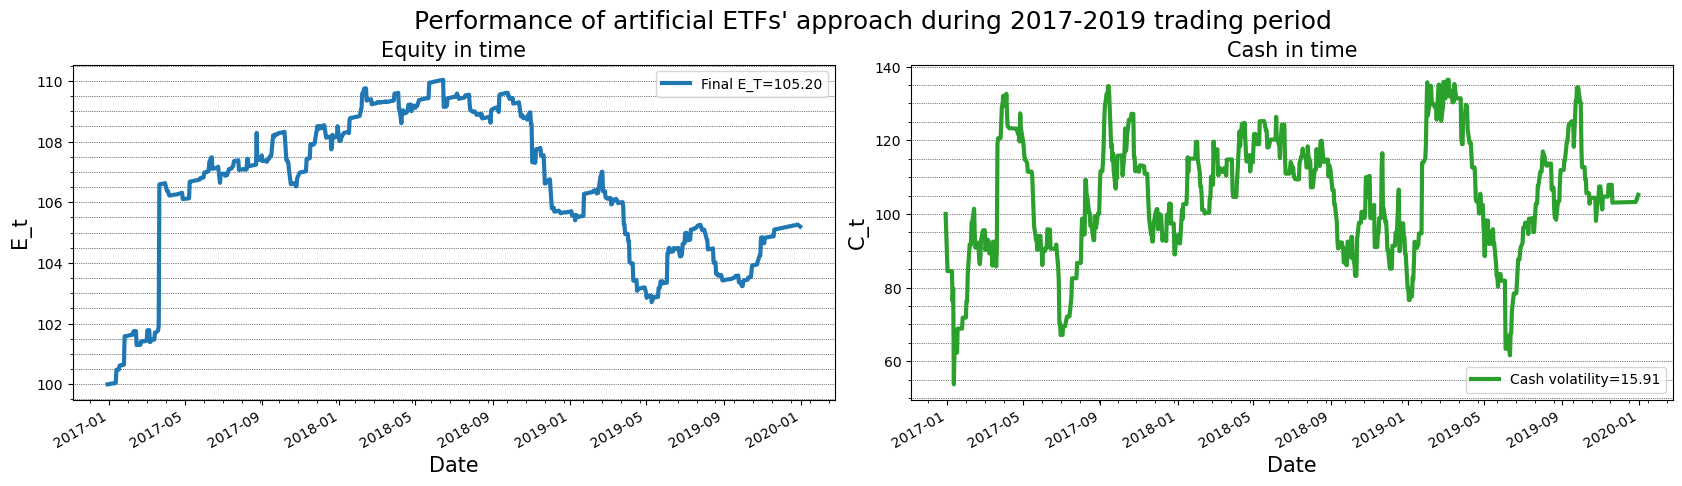
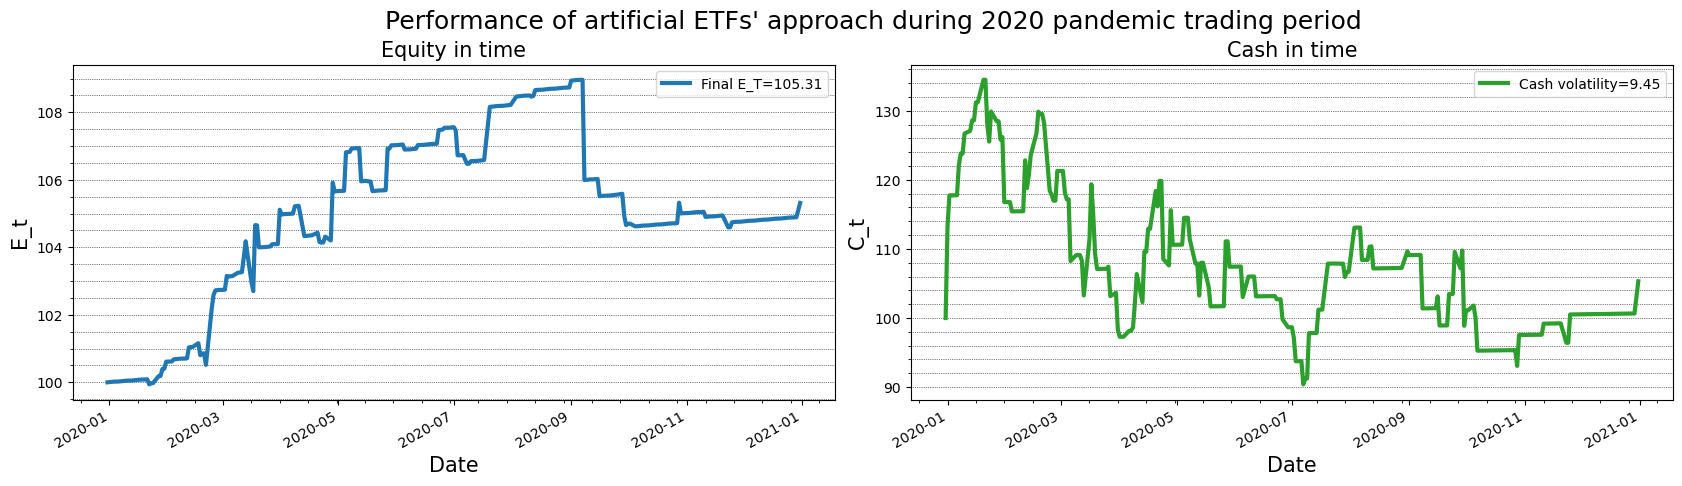
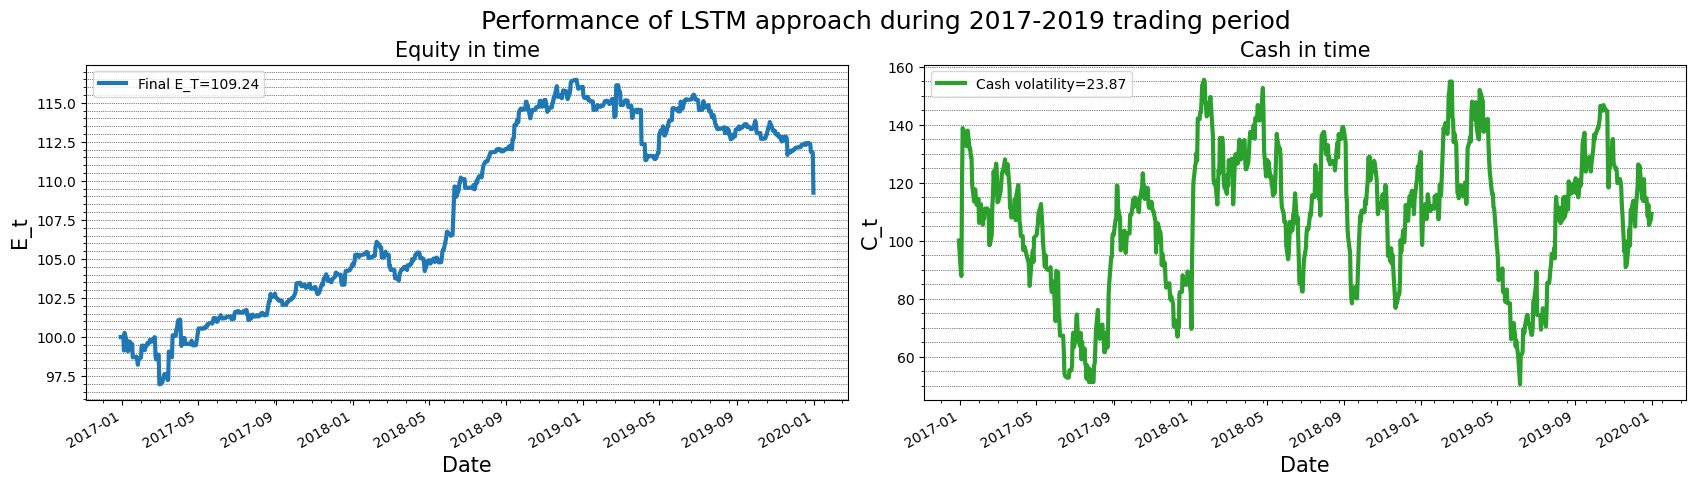
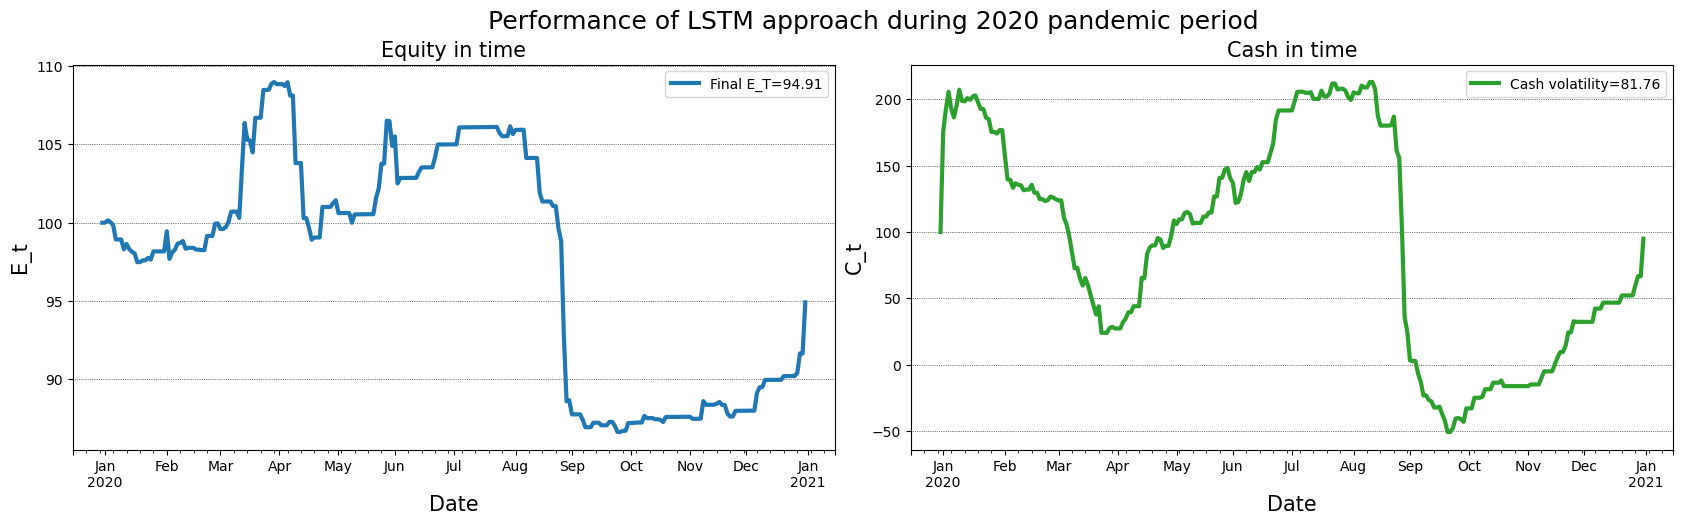
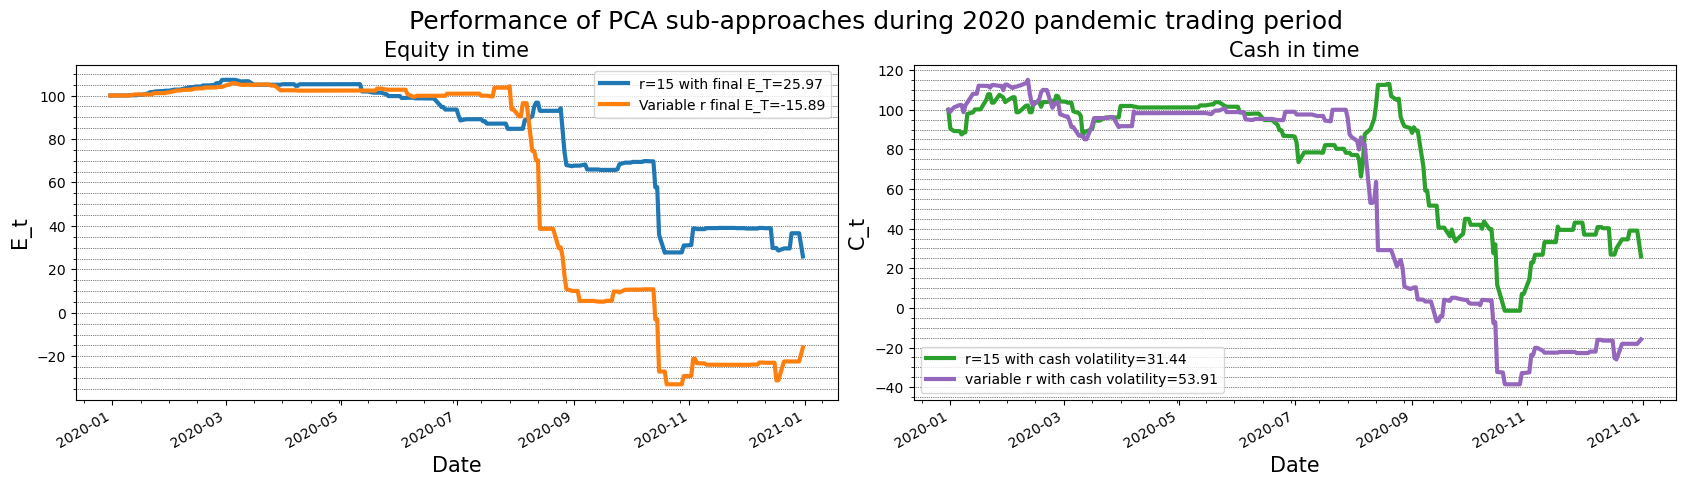
All methods yield profits in 2017-2019, with PCA achieving roughly 20 percent cumulative return and an annualized Sharpe ratio of up to 2.63. Despite multiple adaptations, our conclusions remain consistent with those of the original paper. During the COVID-19 recession, only the ETF based approach remains profitable (about 5 percent annual return), while PCA and LSTM methods underperform. LSTM results, although negative, are promising and indicate potential for future optimization.
💡 Deep Analysis
Deep Dive into Statistical Arbitrage in Polish Equities Market Using Deep Learning Techniques.
We study a systematic approach to a popular Statistical Arbitrage technique: Pairs Trading. Instead of relying on two highly correlated assets, we replace the second asset with a replication of the first using risk factor representations. These factors are obtained through Principal Components Analysis (PCA), exchange traded funds (ETFs), and, as our main contribution, Long Short Term Memory networks (LSTMs). Residuals between the main asset and its replication are examined for mean reversion properties, and trading signals are generated for sufficiently fast mean reverting portfolios.
Beyond introducing a deep learning based replication method, we adapt the framework of Avellaneda and Lee (2008) to the Polish market. Accordingly, components of WIG20, mWIG40, and selected sector indices replace the original S&P500 universe, and market parameters such as the risk free rate and transaction costs are updated to reflect local conditions.
We outline the full strategy pipeline: risk fact
📄 Full Content
Statistical Arbitrage in Polish Equities Market Using Deep
Learning Techniques1
Marek Adamczyk
University of Wrocław
marek.adamczyk@cs.uni.wroc.pl
Michał Dąbrowski
University of Wrocław
michaldabrowski1998@gmail.com
1This research was supported by the Polish National Science Centre (NCN) Grant 2019/35/D/ST6/03060.
arXiv:2512.02037v1 [q-fin.ST] 20 Nov 2025
Abstract
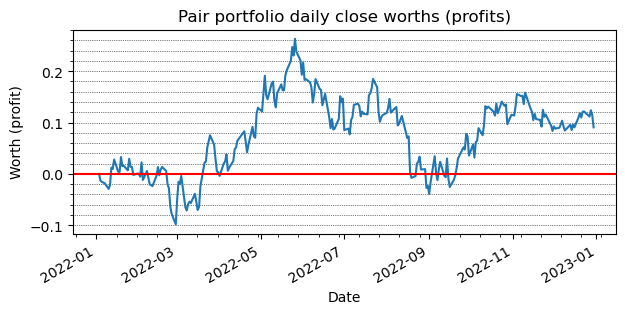
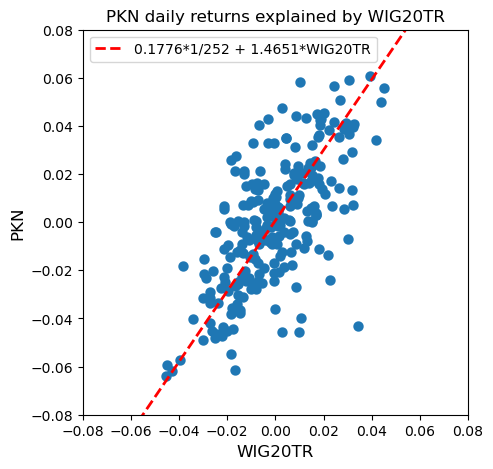
We study a systematic approach to a popular Statistical Arbitrage technique of Pairs Trading.
Instead of relying on 2 highly correlated assets, the latter one is substitute with the most accu-
rate replication of the first with the use of so called risk-factors. Such factors can be determined
by: Principal Components Analysis (PCA), actual market exchange traded funds (ETFs) or, as a
authorial technique and thus our contribution to the literature, Long short-term memory networks
(LSTMs). Residuals between the main asset and its replication’ returns are analysed on a basis of
their potential mean-reversion properties. Trading signals are later generated for sufficiently fast
mean-reverting portfolios to profit from any technical mispricings.
Besides the introduction of a new deep-learning based method, paper re-defines methods already
presented by authors of 2008’s paper Statistical Arbitrage in the U.S. Equities Market to match
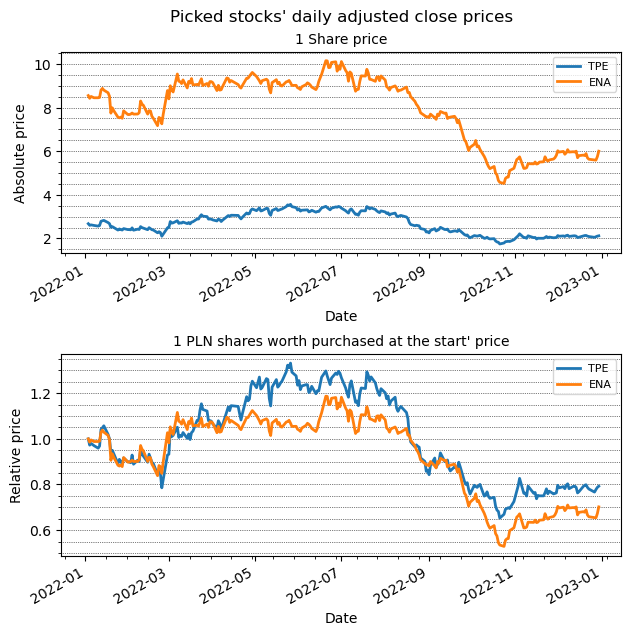
conditions of the polish stock exchange market. For that reason, instead of SP500 stocks’, com-
ponents of WIG20 and mWIG40 combined are in scope of trading activities with an addition of
polish sector indices. Overall market factors such as the risk free rate or transaction costs are also
adjusted from mentioned paper for better reality matching.
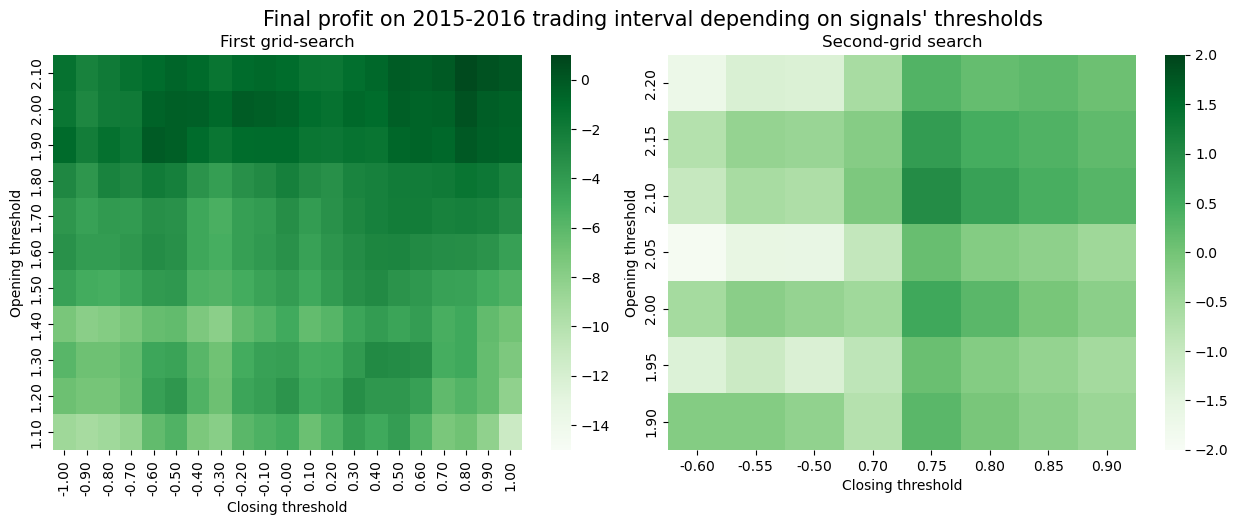
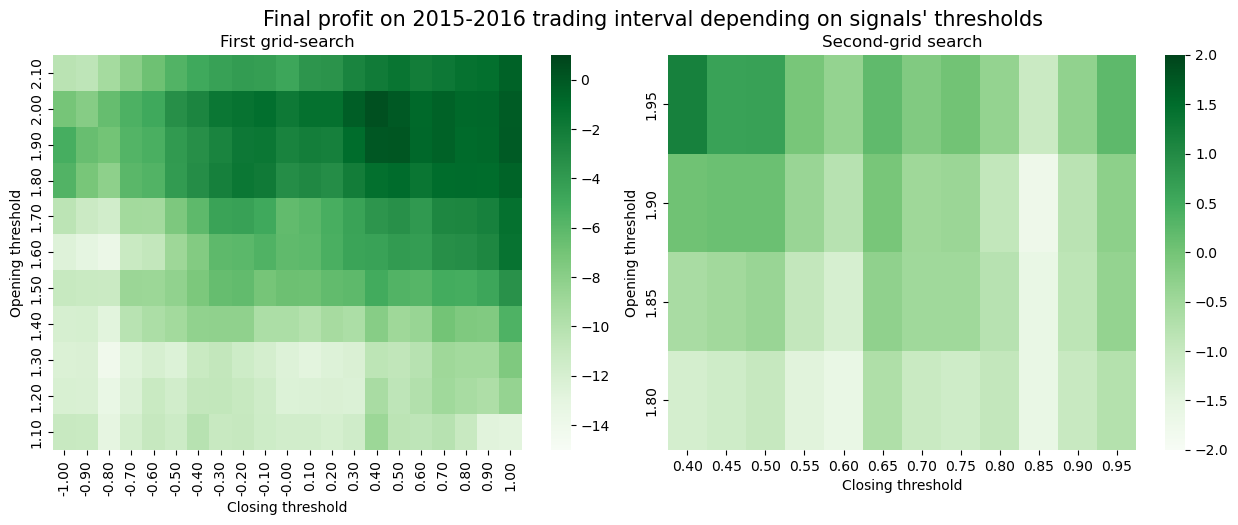
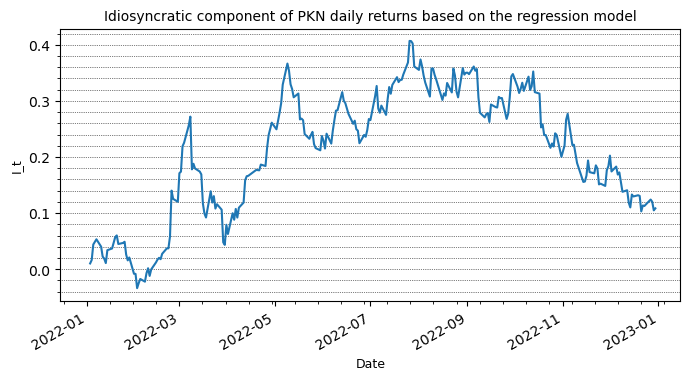
After setting up the scope, all details of the strategy are explained: from the theory behind risk-
factors representation, through the modelling of residuals with Ornstein-Uhlenbeck process till
trading signals generation procedure. They are followed by a separate section concerning specifics
of each replicating technique with a general overview of the method and its application for our pur-
poses. Throughout the entire thesis various examples are graphically made for better understanding
of discussed topics. The final part of the paper concerns testing of the overall Pairs Trading strategy
and of its presented variations.
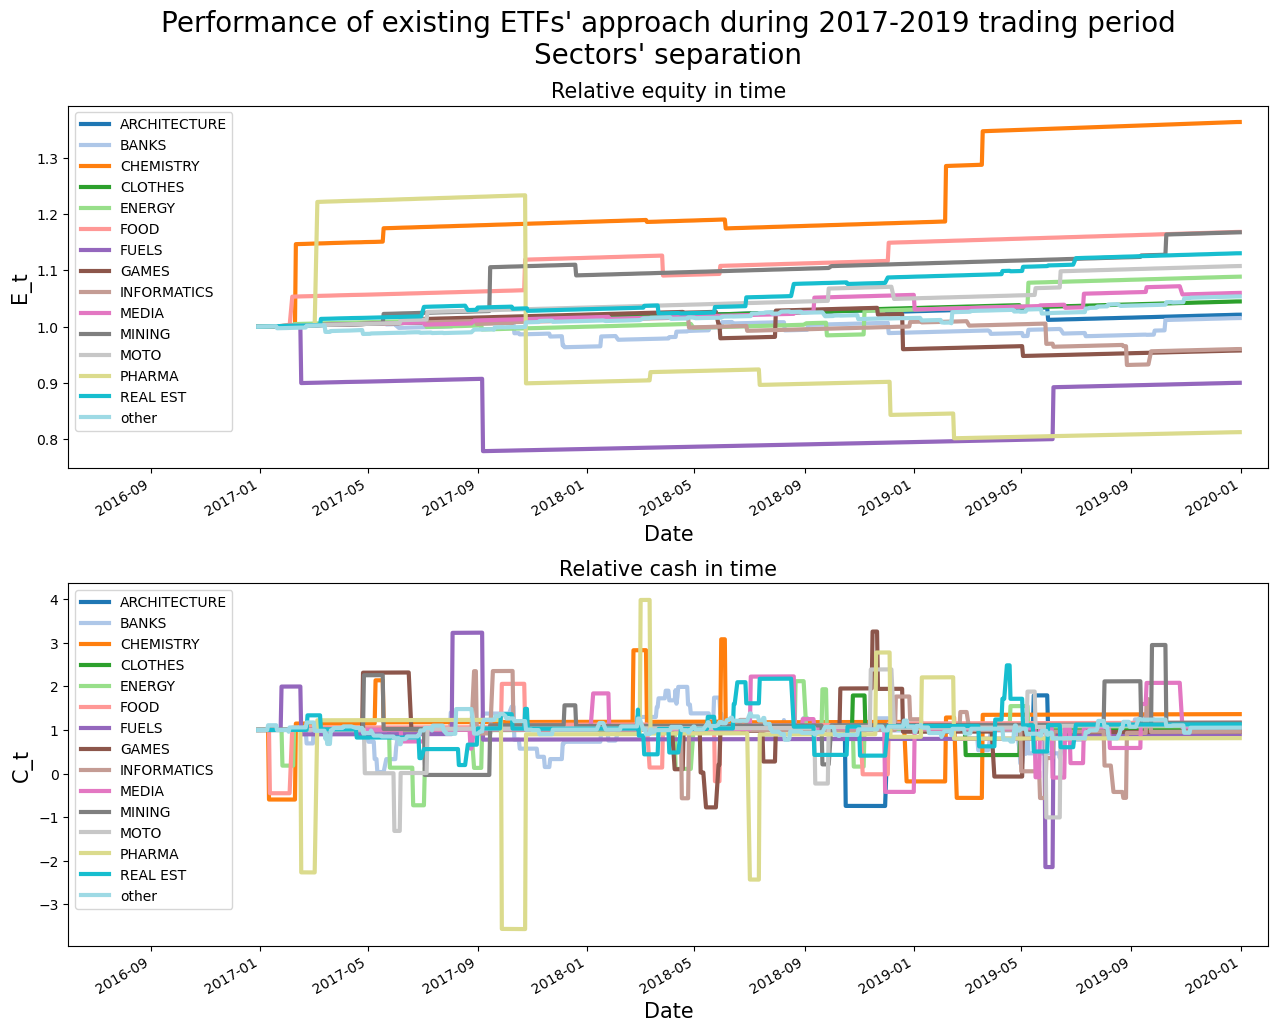
To keep the results relevant and tested in different economic conditions, two backtesting periods
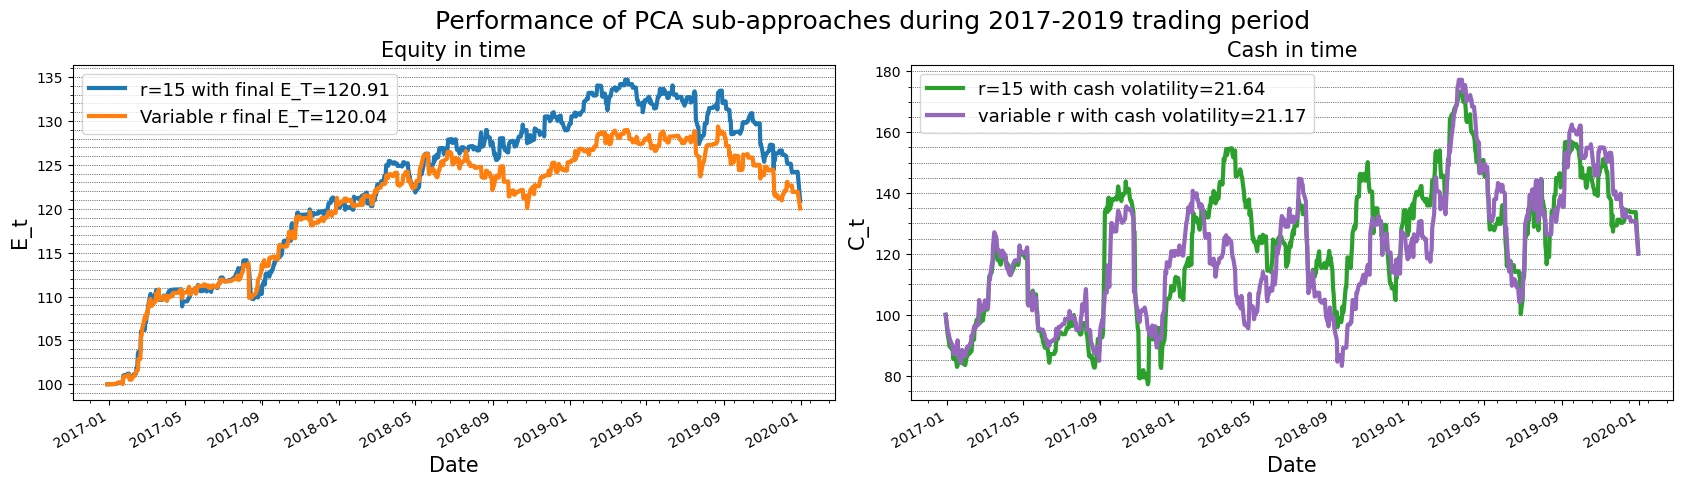
are distinguished: 2017-2019 and a highly recessive 2020. All strategies manage to profit during the
first interval with the PCA approach achieving around 20% of combined return and even up to
2.63 annualized Sharpe ratio (in 2017). Even though a lot of assumptions is changed in comparison
to Avellaneda and Lee’ 2008 paper, received results and main conclusions are highly comparable.
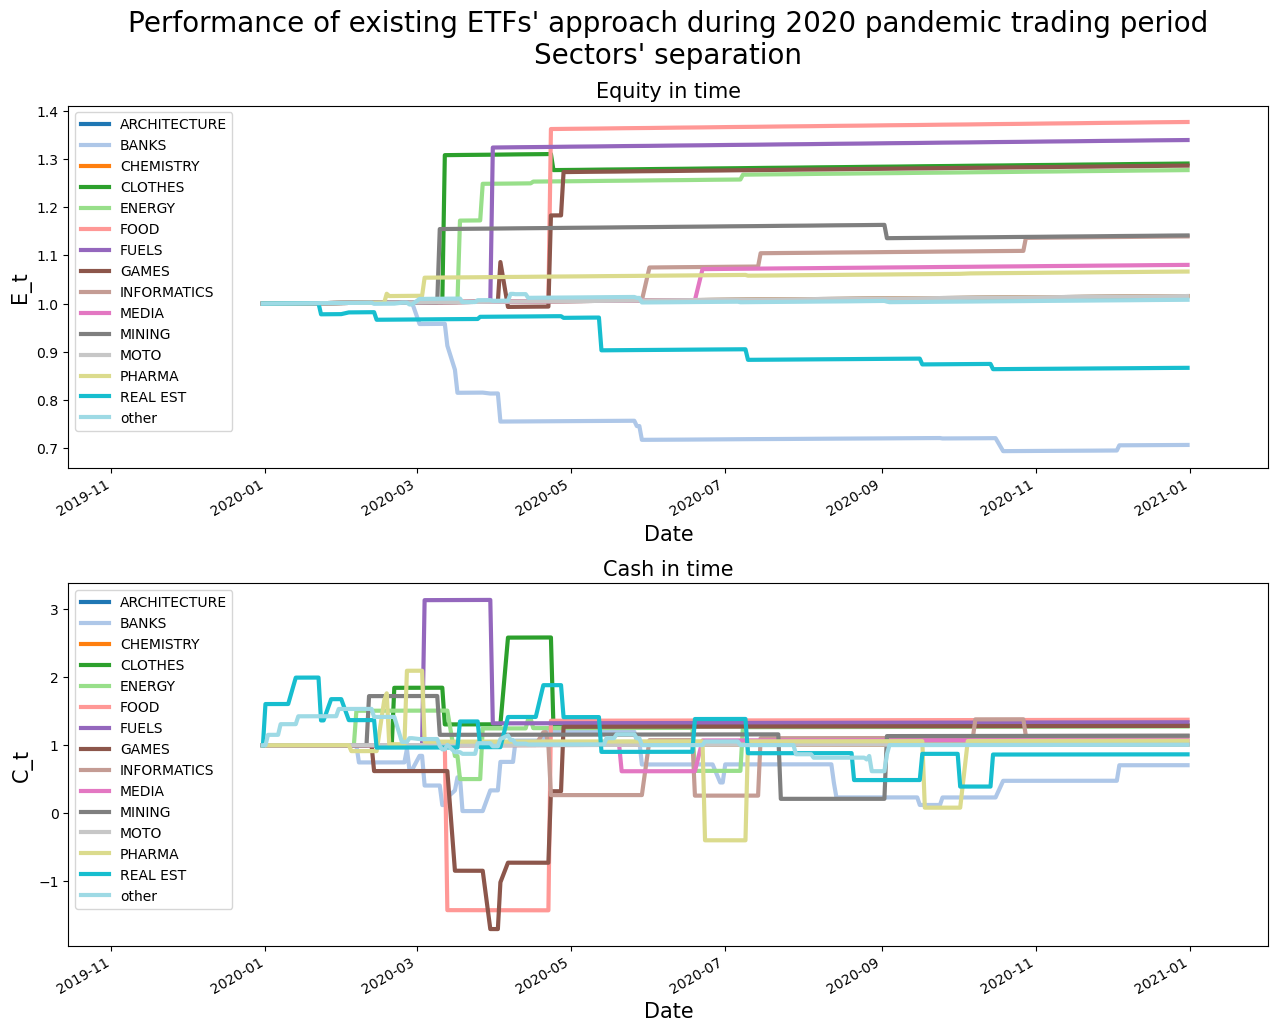
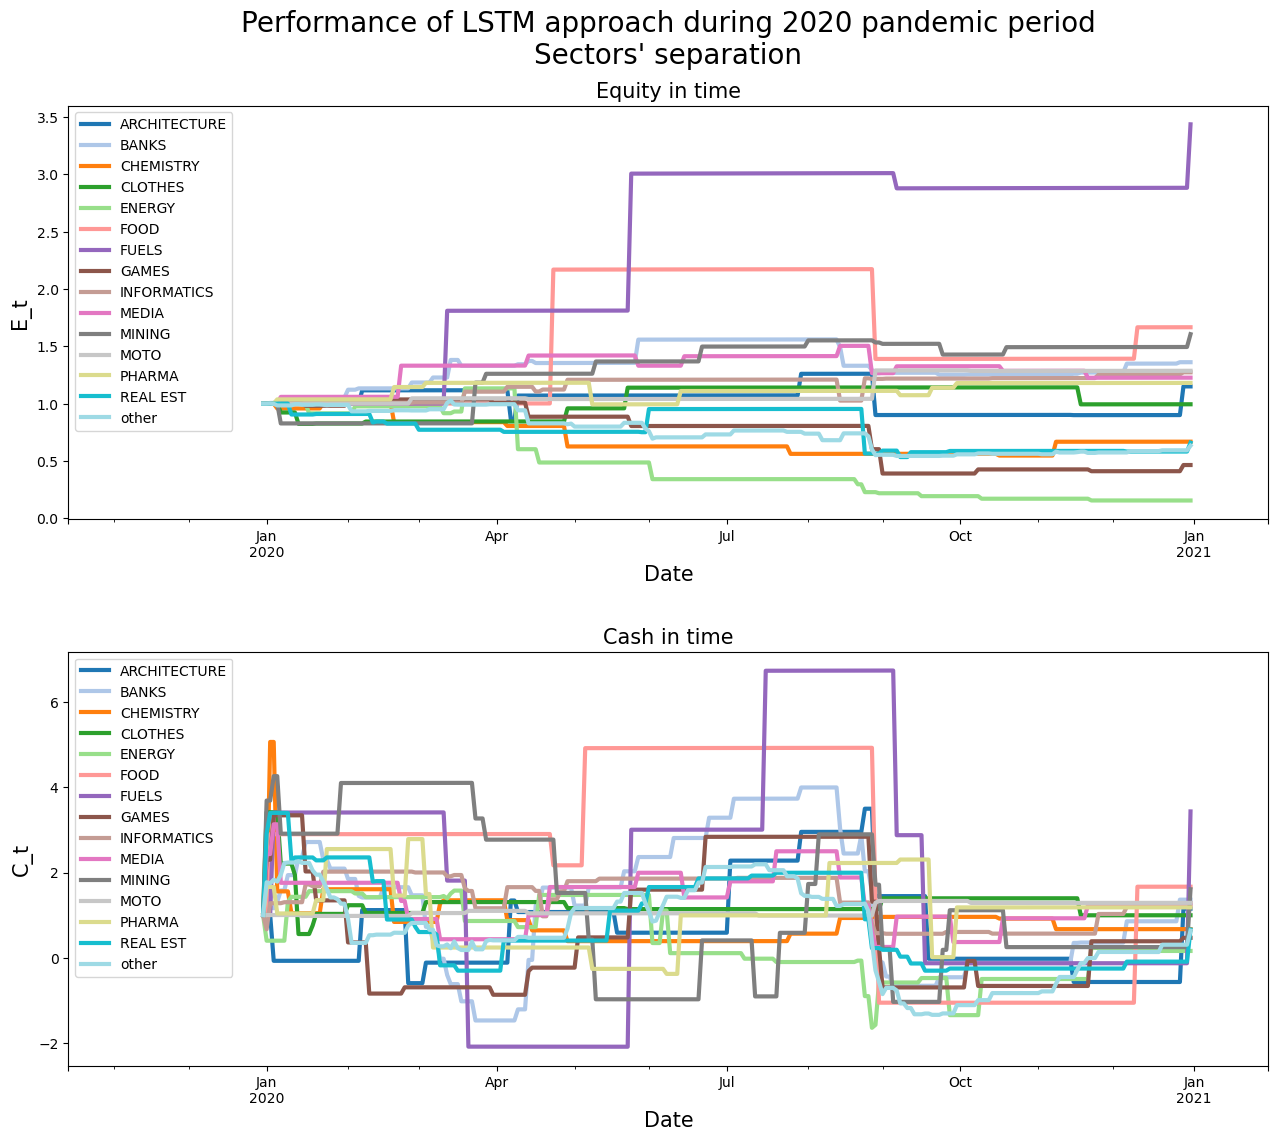
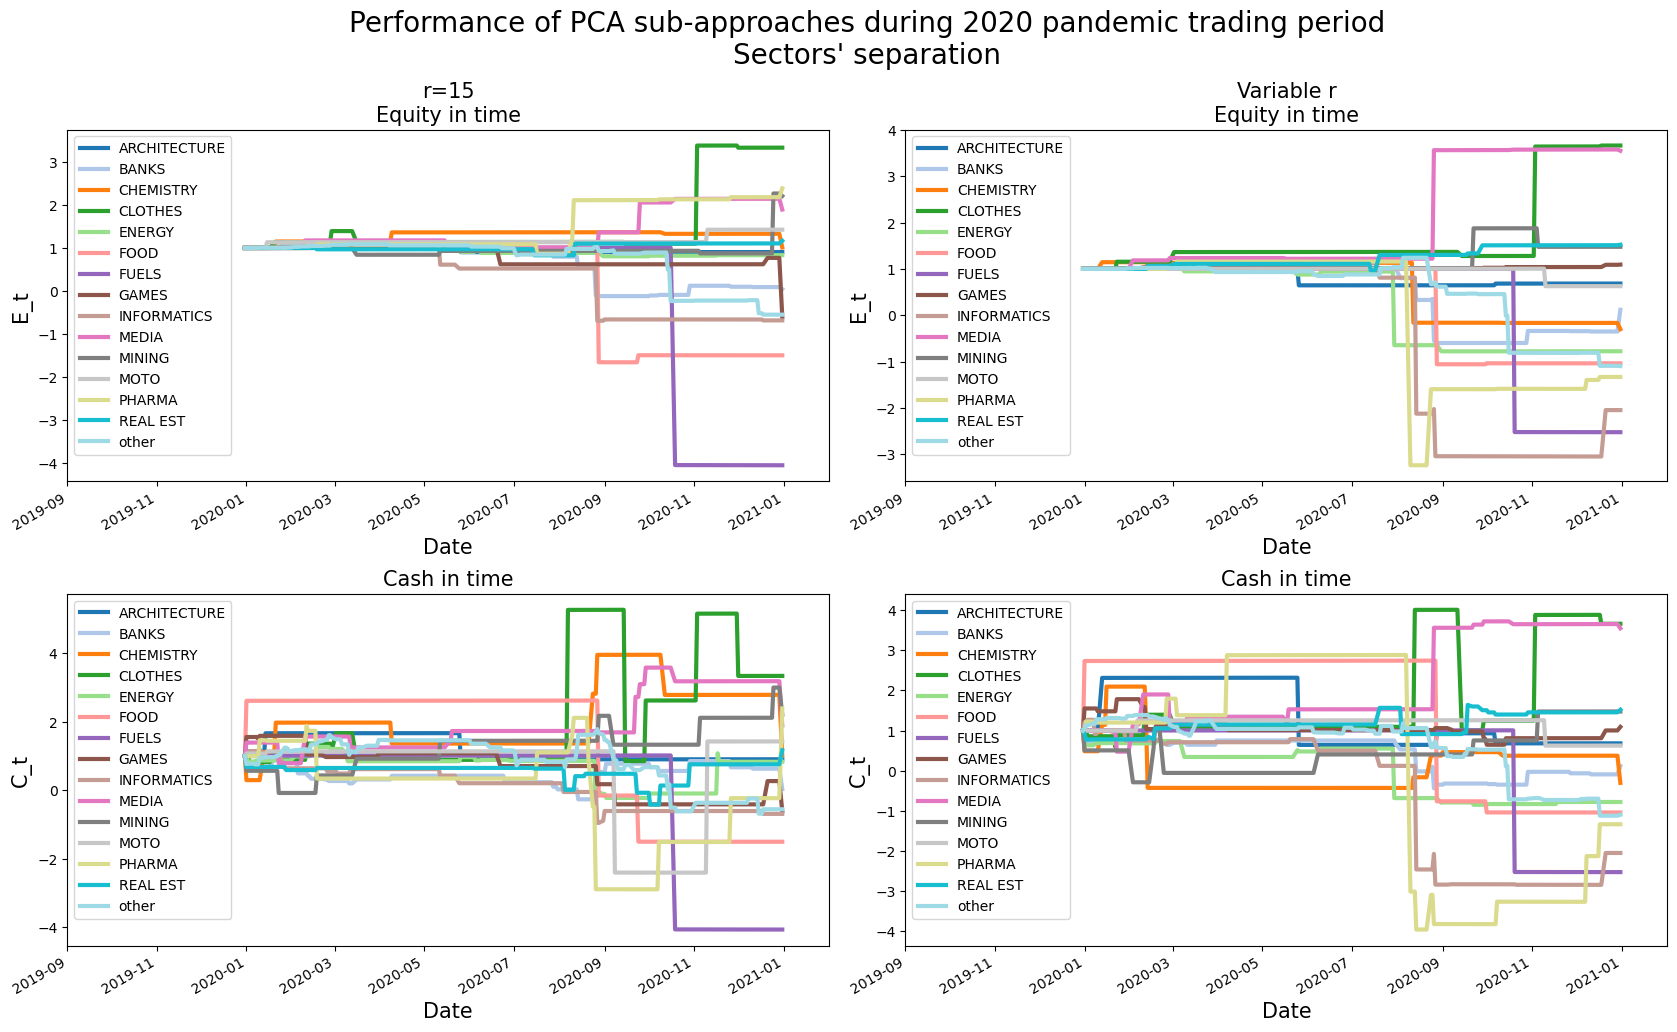
During the COVID-19 recession, ETFs technique are the only profitable one achieving annual re-
turn of 5%- both the PCA and LSTM methods fail to produce any profits. All LSTM results can
be seen as promising and should be optimized in future works, especially since it is possibly the
first take on such application of recurrent neural networks.
Contents
1
Introduction
2
1.1
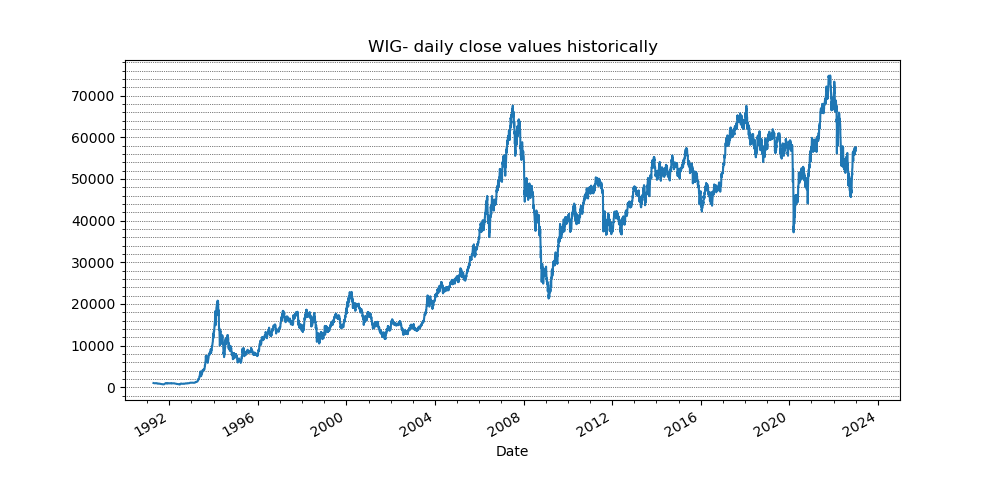
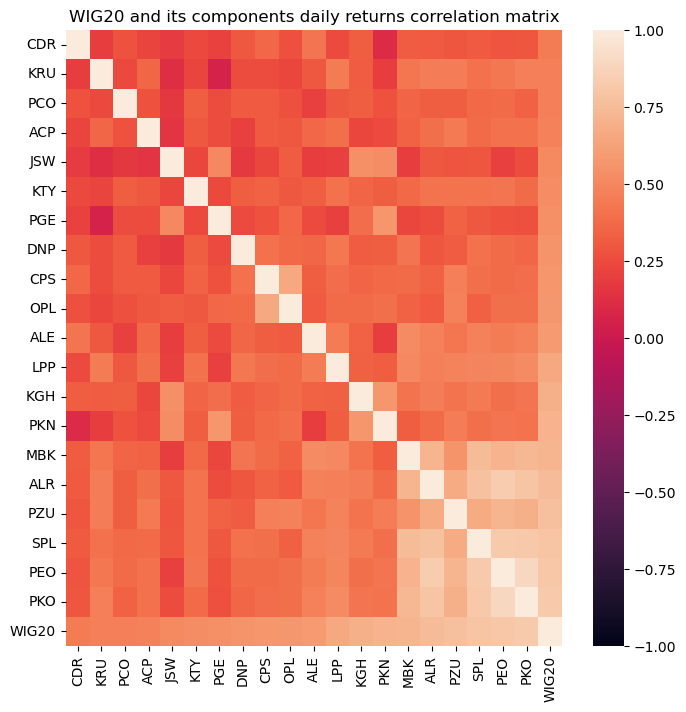
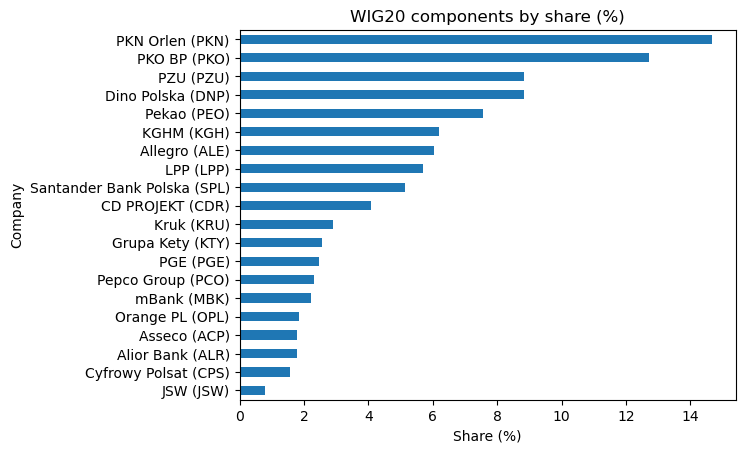
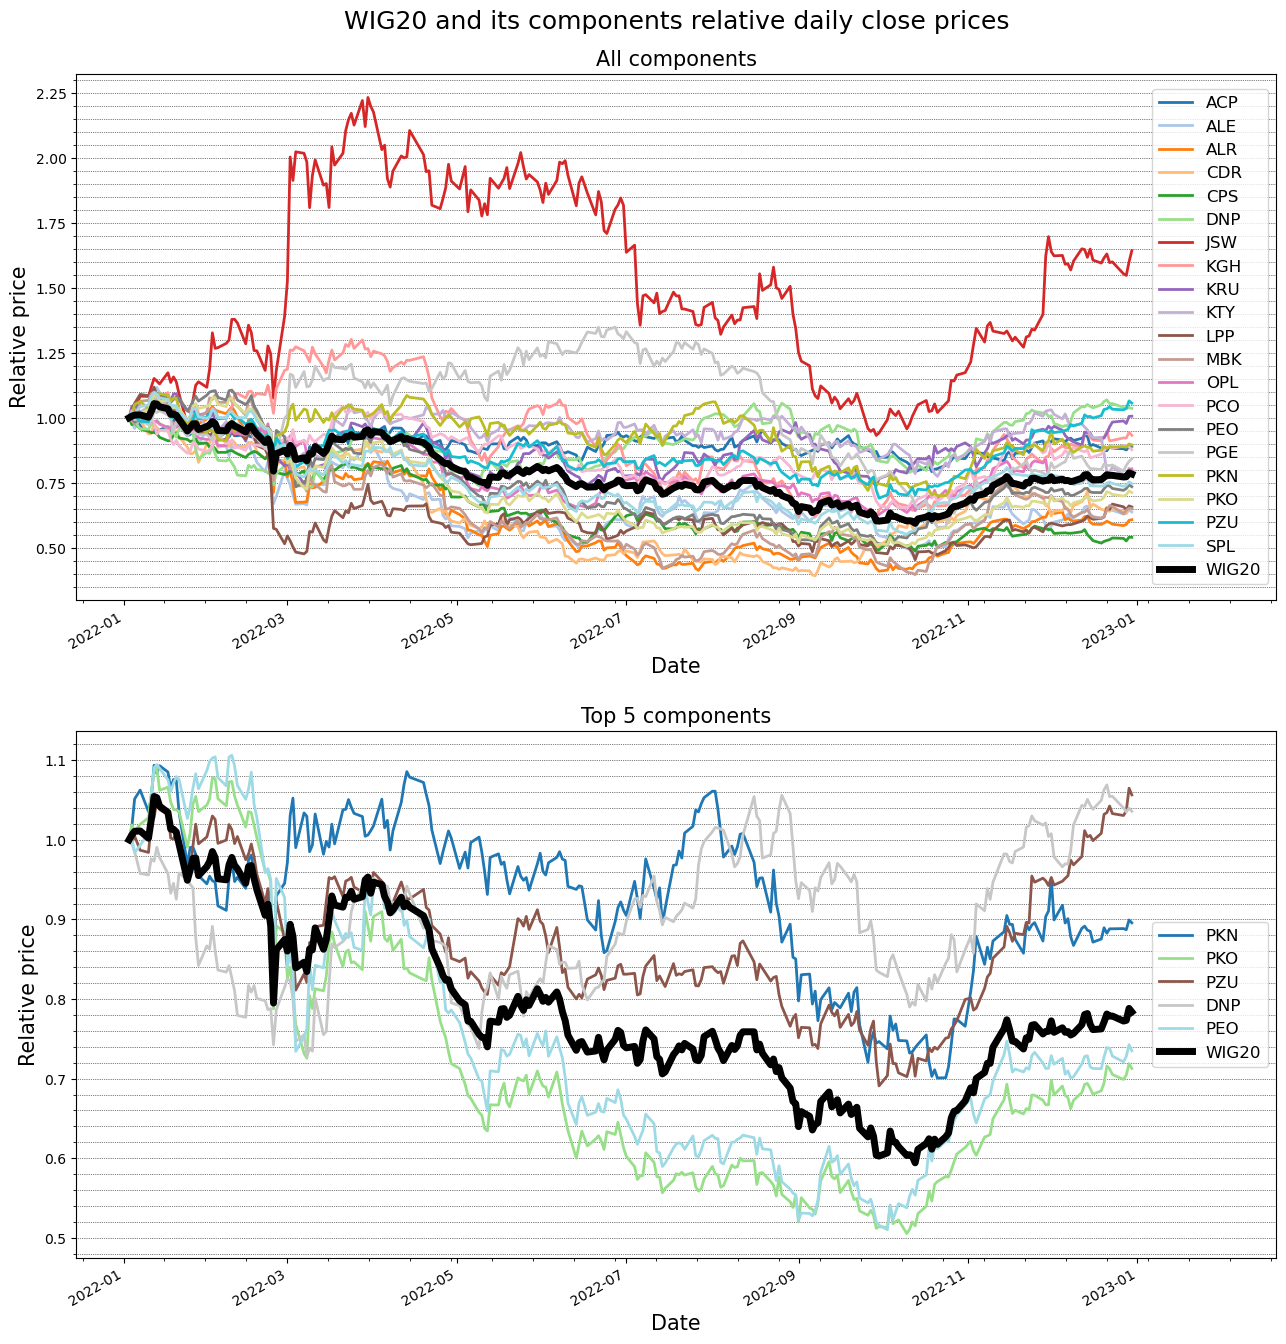
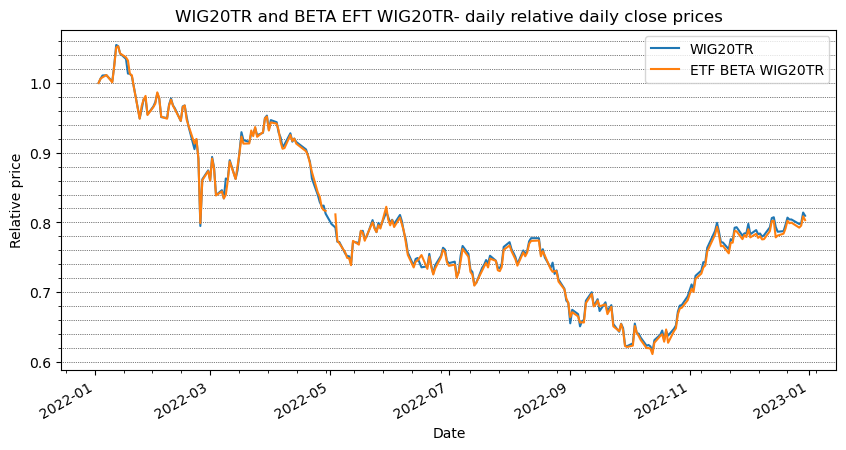
Polish equities market in the scope of our consideration
. . . . . . . . . . . . . . . .
3
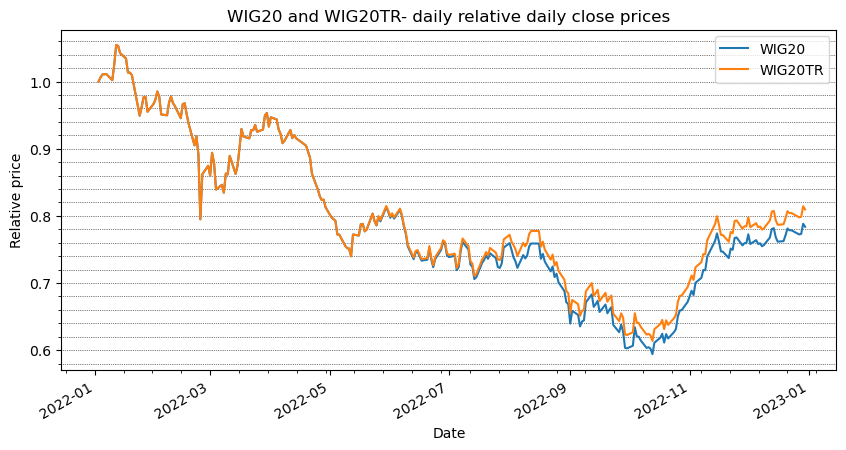
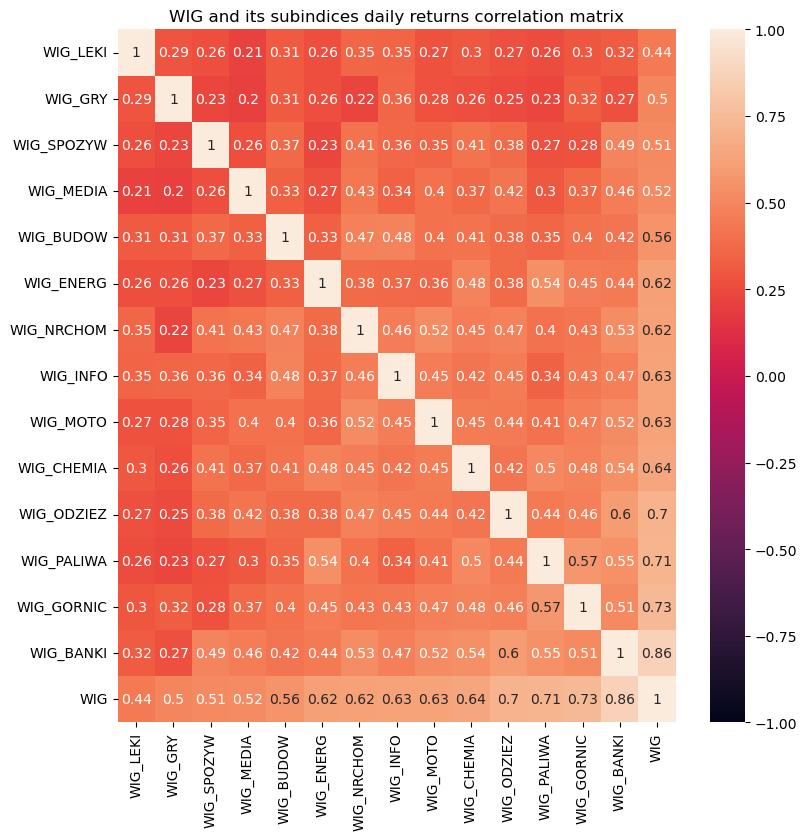
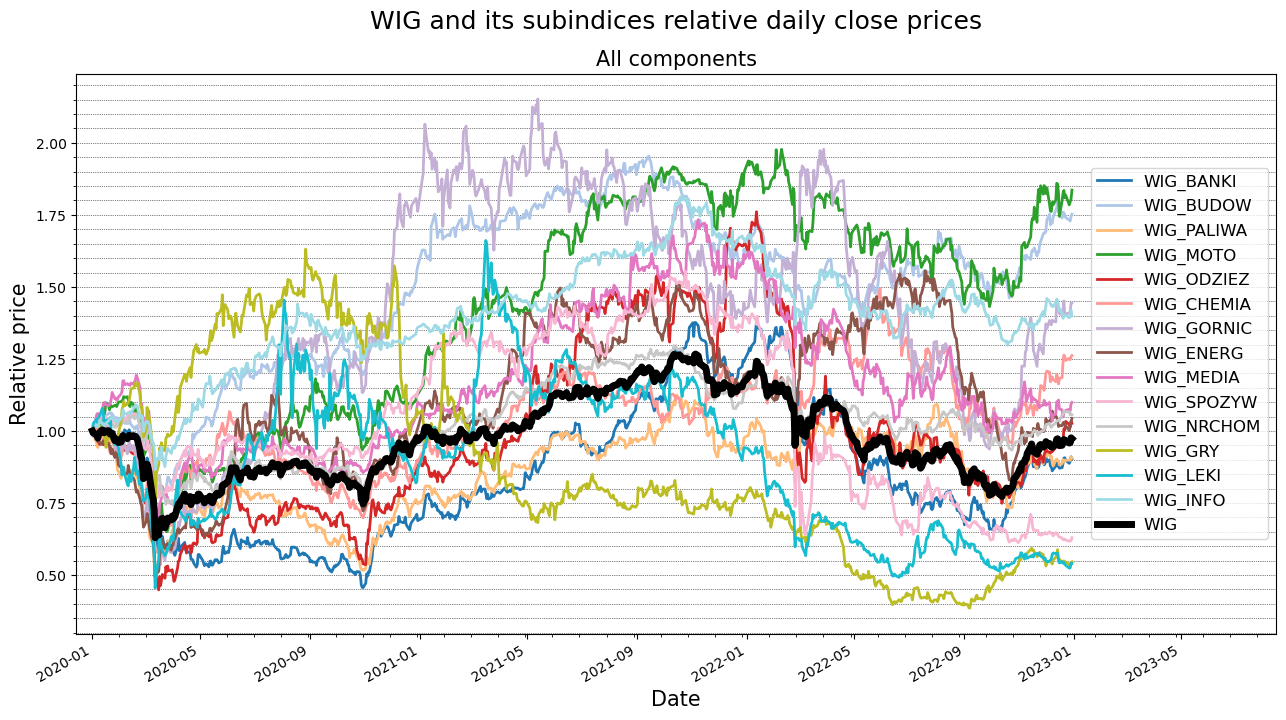
1.1.1
WIG and its variations
. . . . . . . . . . . . . . . . . . . . . . . . . . . . . .
3
2
Theory of Statistical Arbitrage
12
2.1
Pairs trading- what is it?
. . . . . . . . . . . . . . . . . . . . . . . . . . . . . . . . .
12
2.2
Multi-factor β model of returns . . . . . . . . . . . . . . . . . . . . . . . . . . . . . .
15
2.3
Mean-reverting stochastic processes of stocks’ residuals . . . . . . . . . . . . . . . . .
18
2.4
Signals generation
. . . . . . . . . . . . . . . . . . . . . . . . . . . . . . . . . . . . .
24
3
Paired portfolios generation approaches
27
3.1
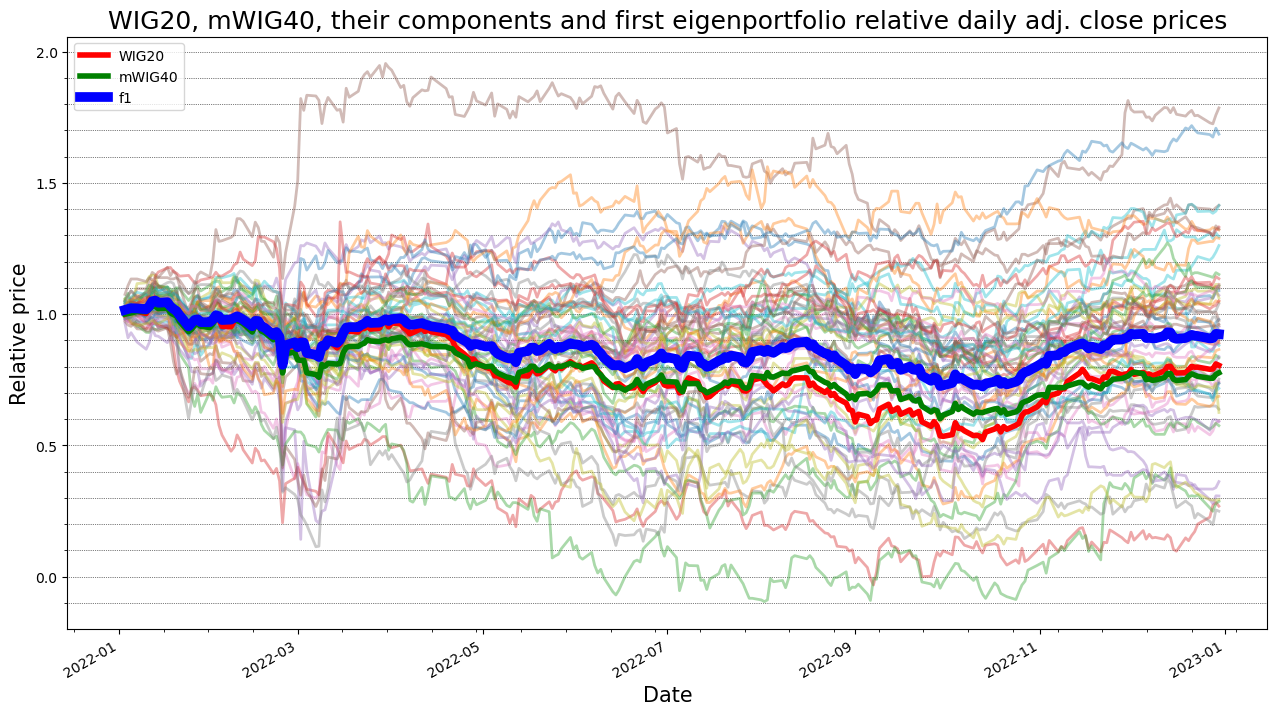
Principal Components Analysis (PCA) . . . . . . . . . . . . . . . . . . . . . . . . . .
27
3.1.1
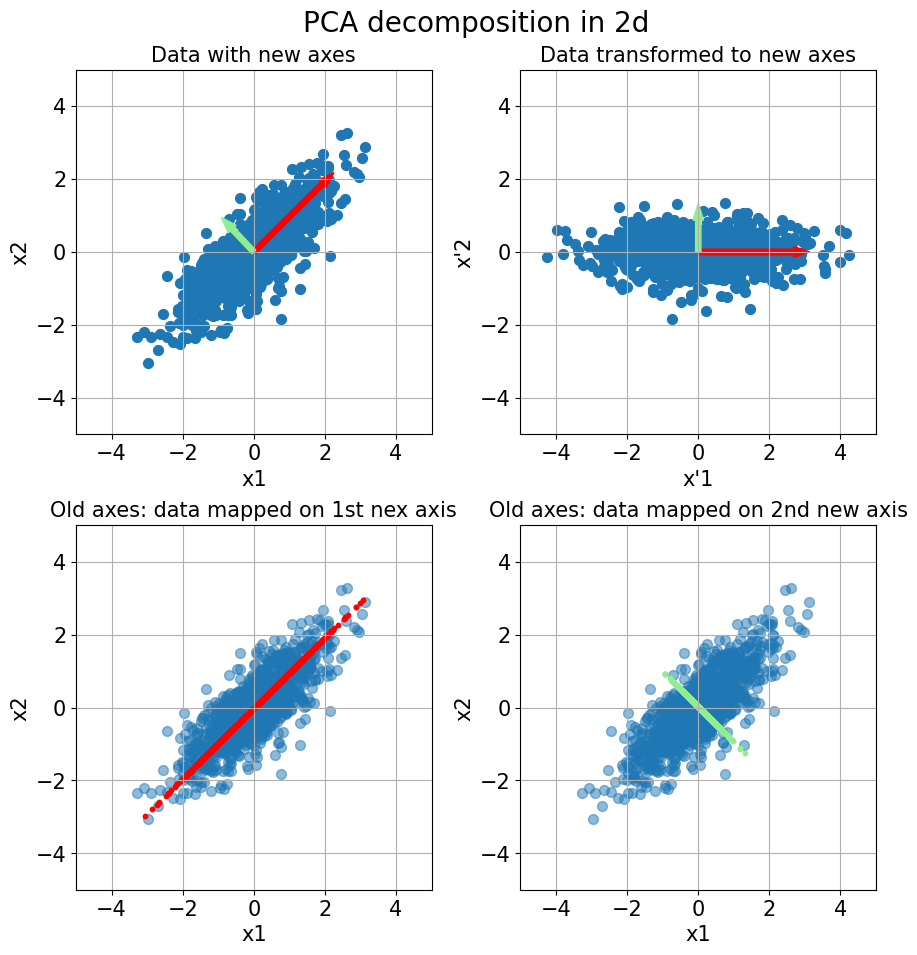
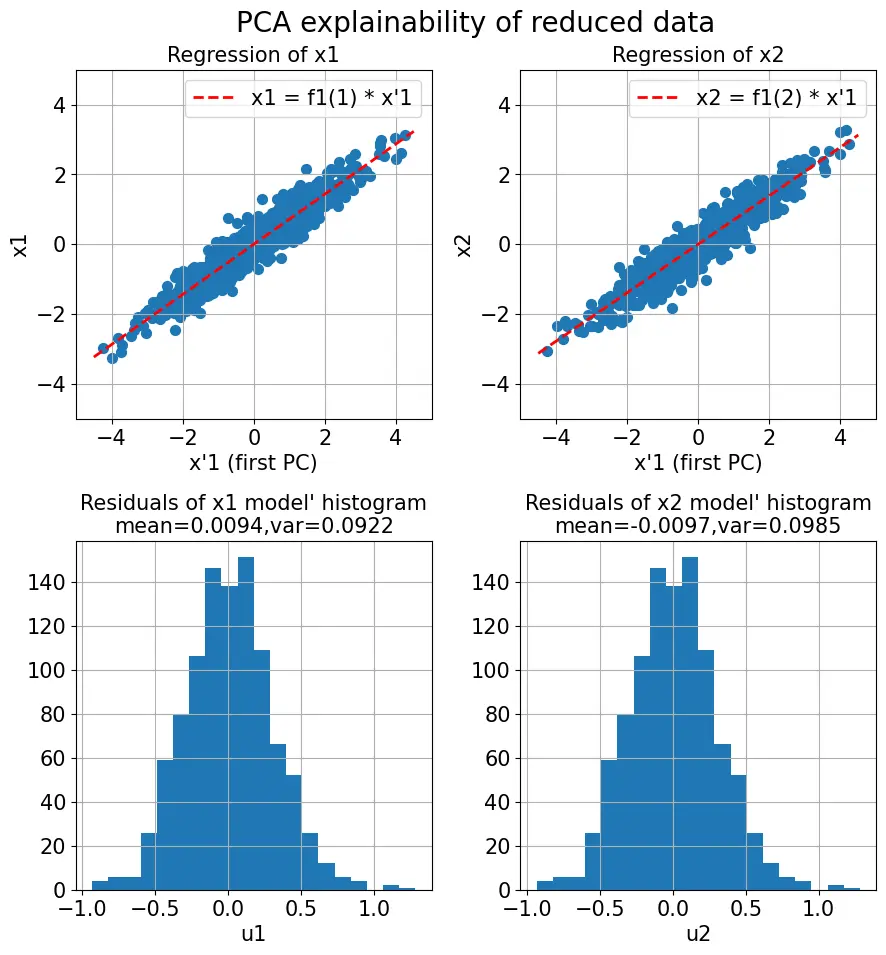
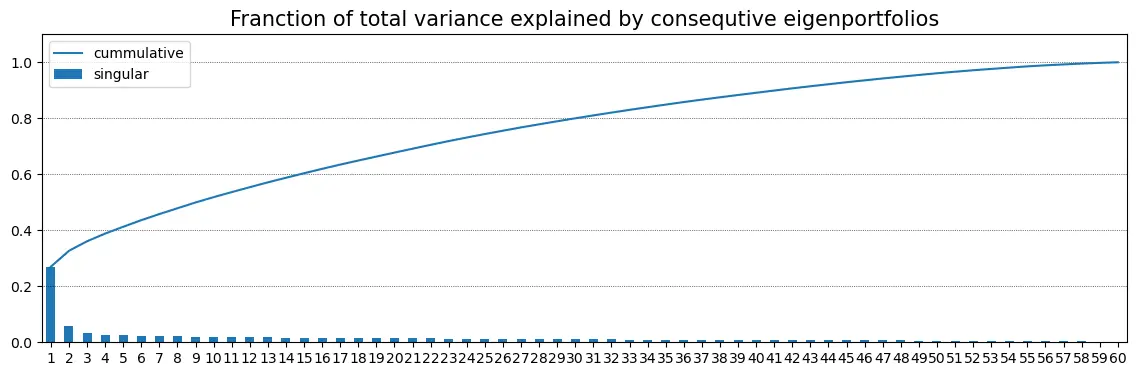
What is PCA?
. . . . . . . . . . . . . . . . . . . . . . . . . . . . . . . . . . .
28
3.1.2
Considered approach . . . . . . . . . . . . . . . . . . . . . . . . . . . . . . . .
31
3.2
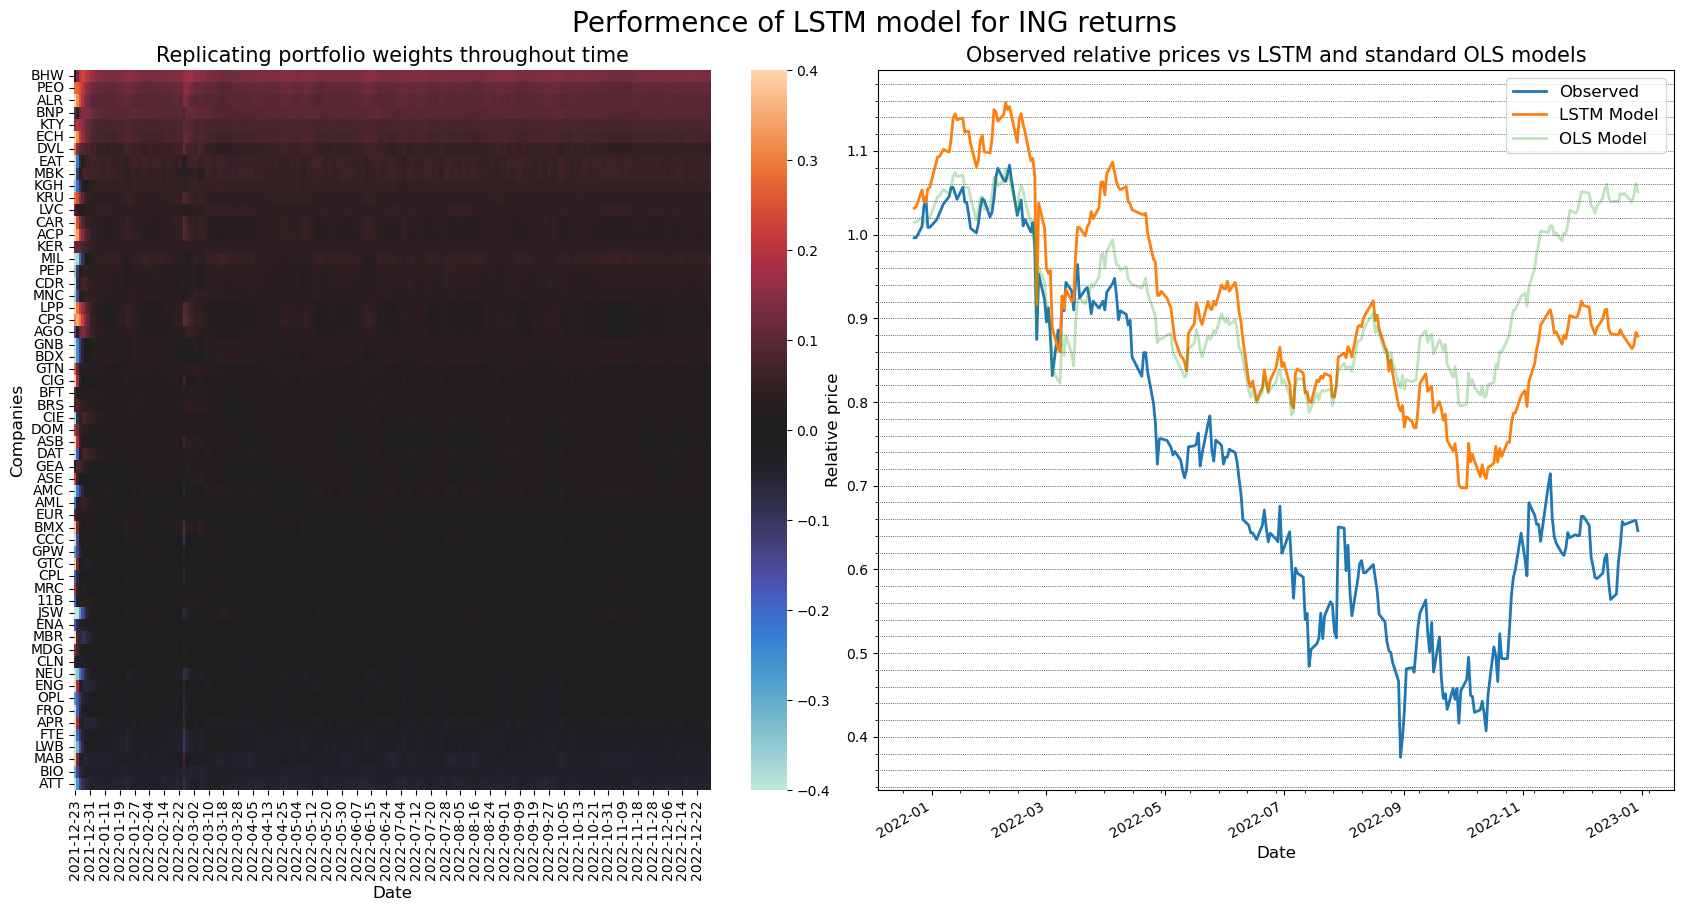
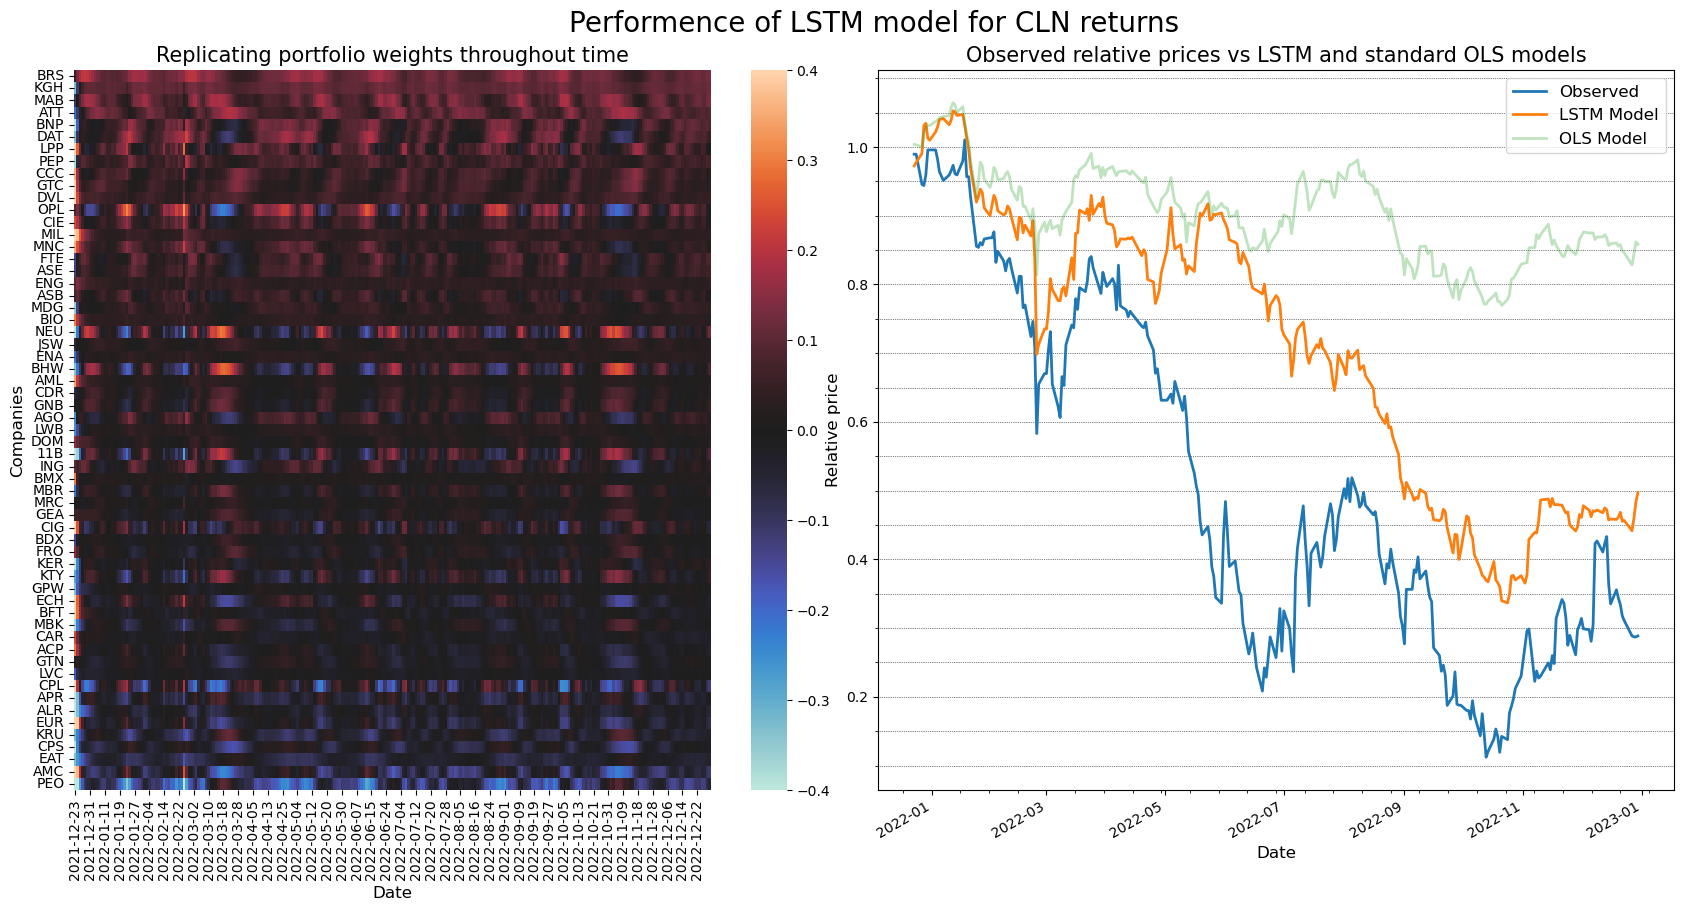
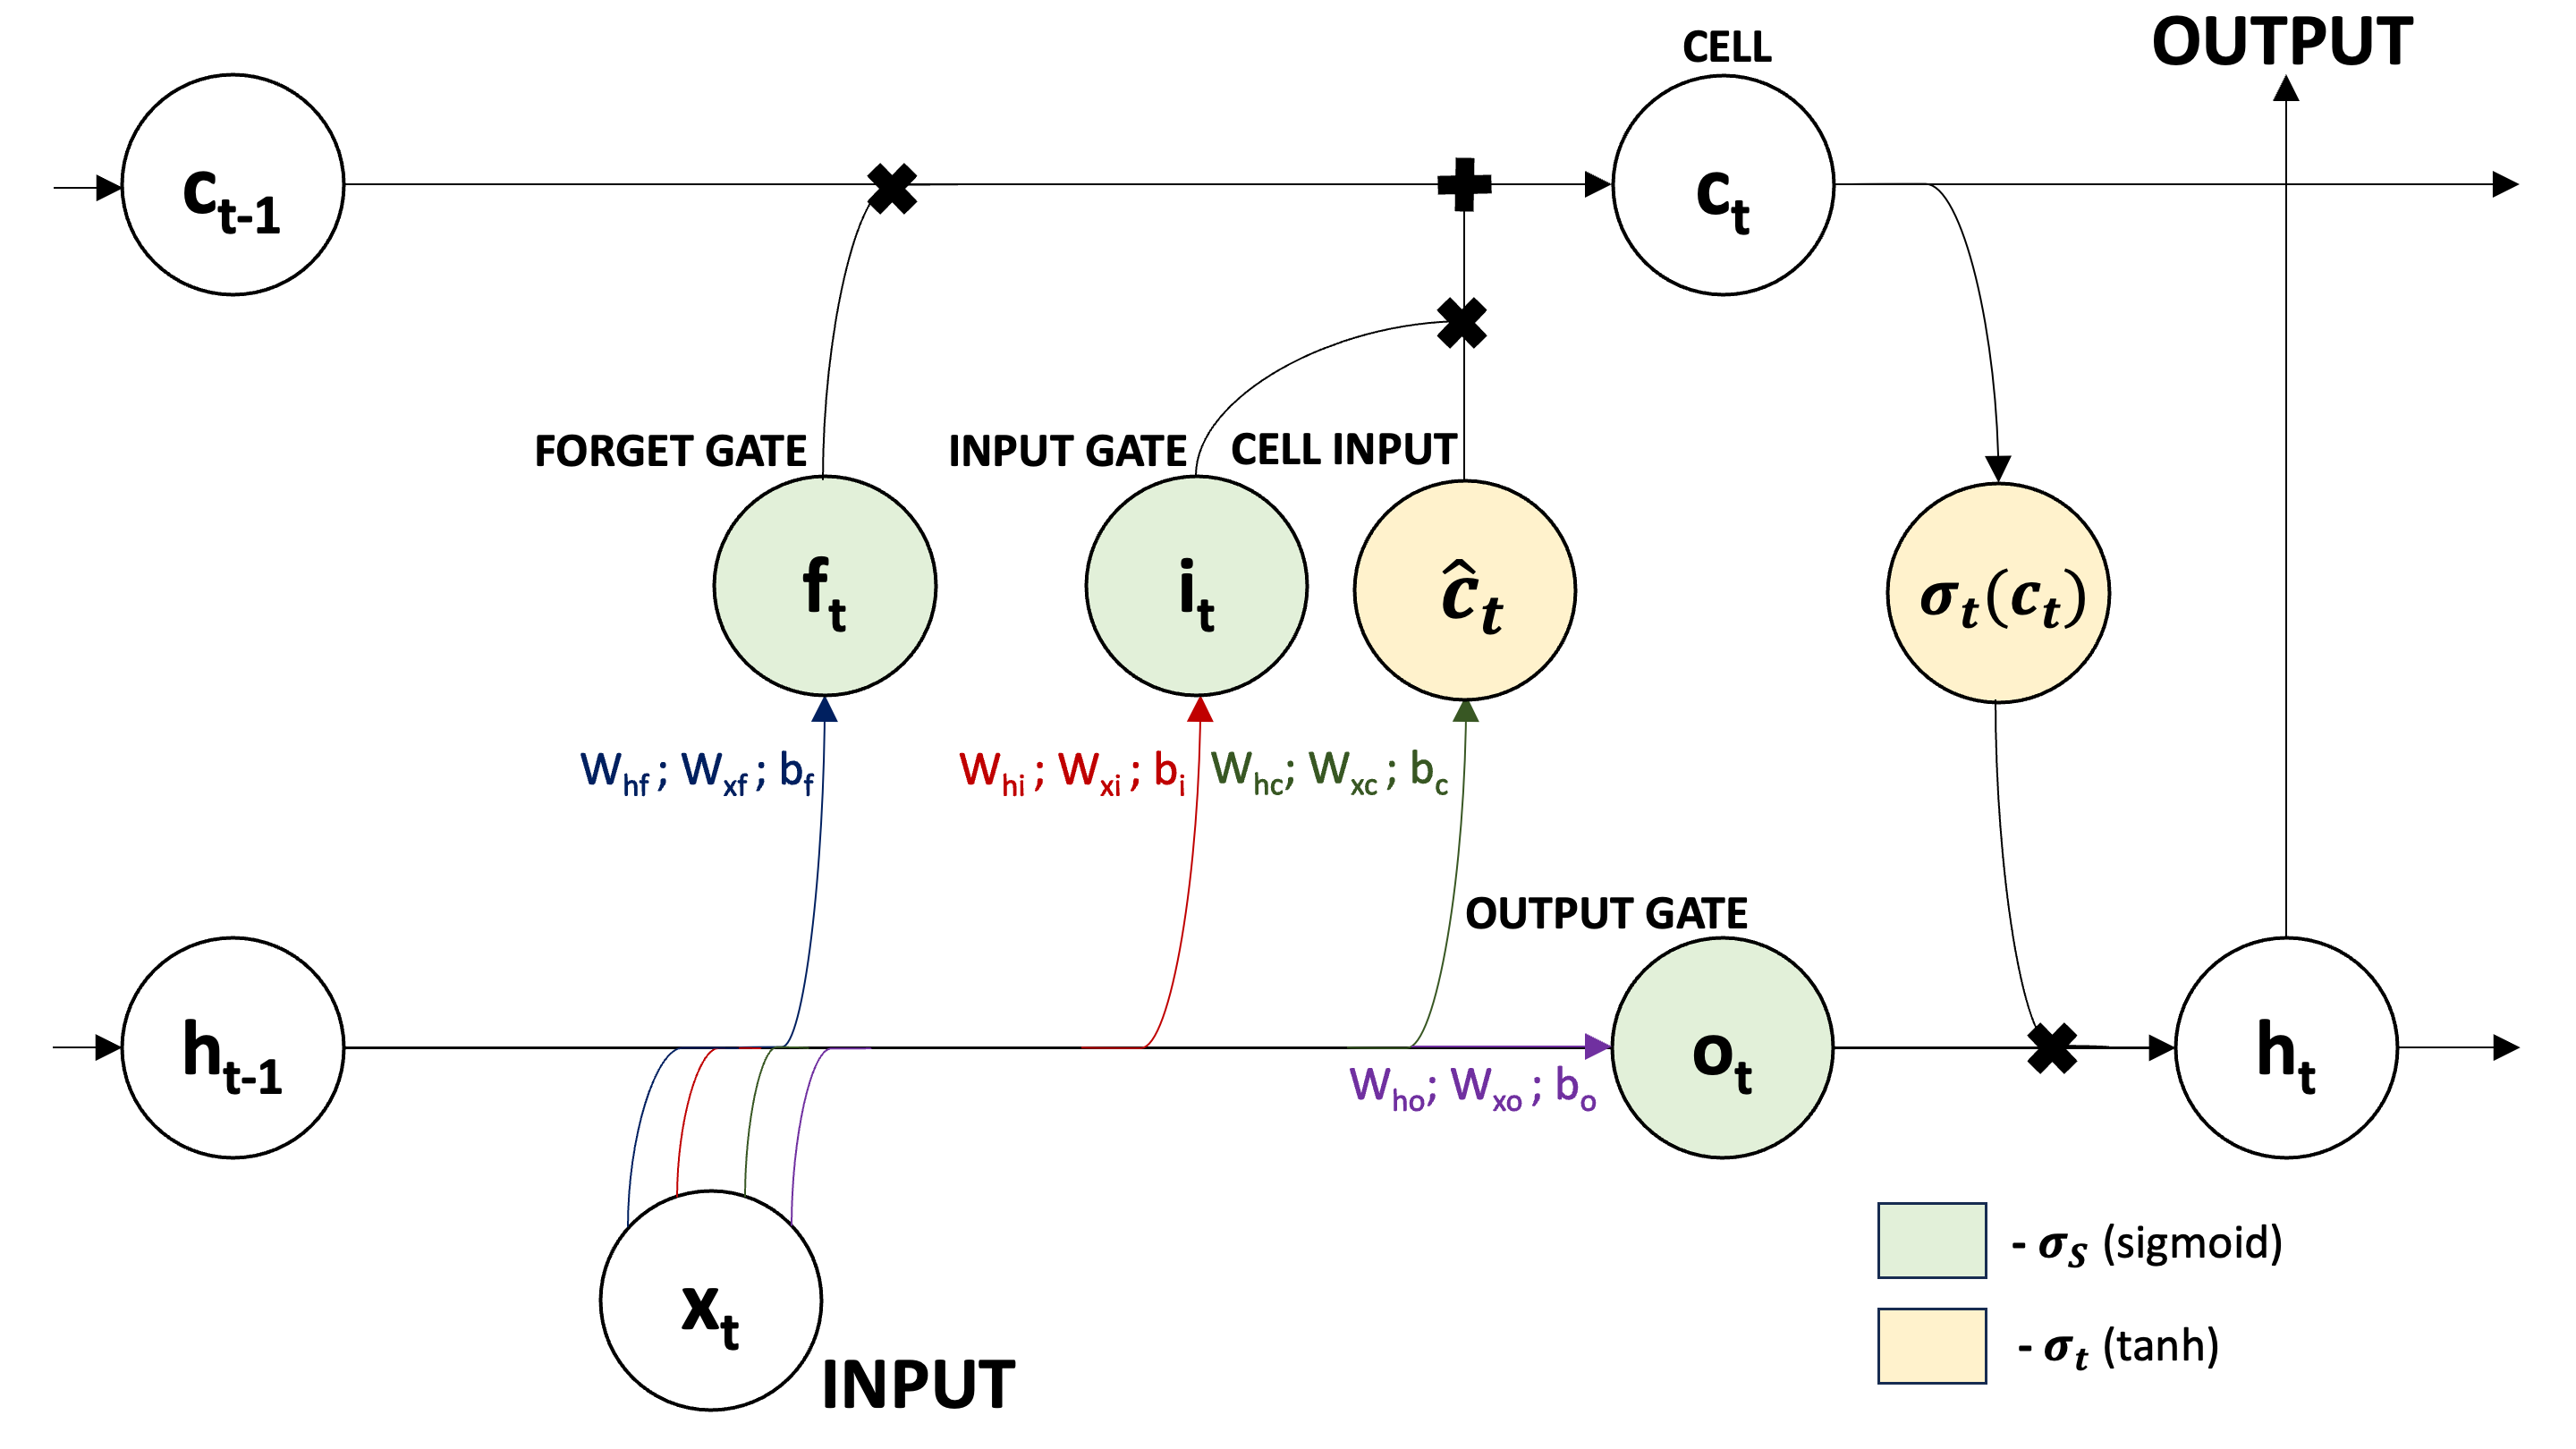
Long short-term memory (LSTM) networks . . . . . . . . . . . . . . . . . . . . . . .
38
3.2.1
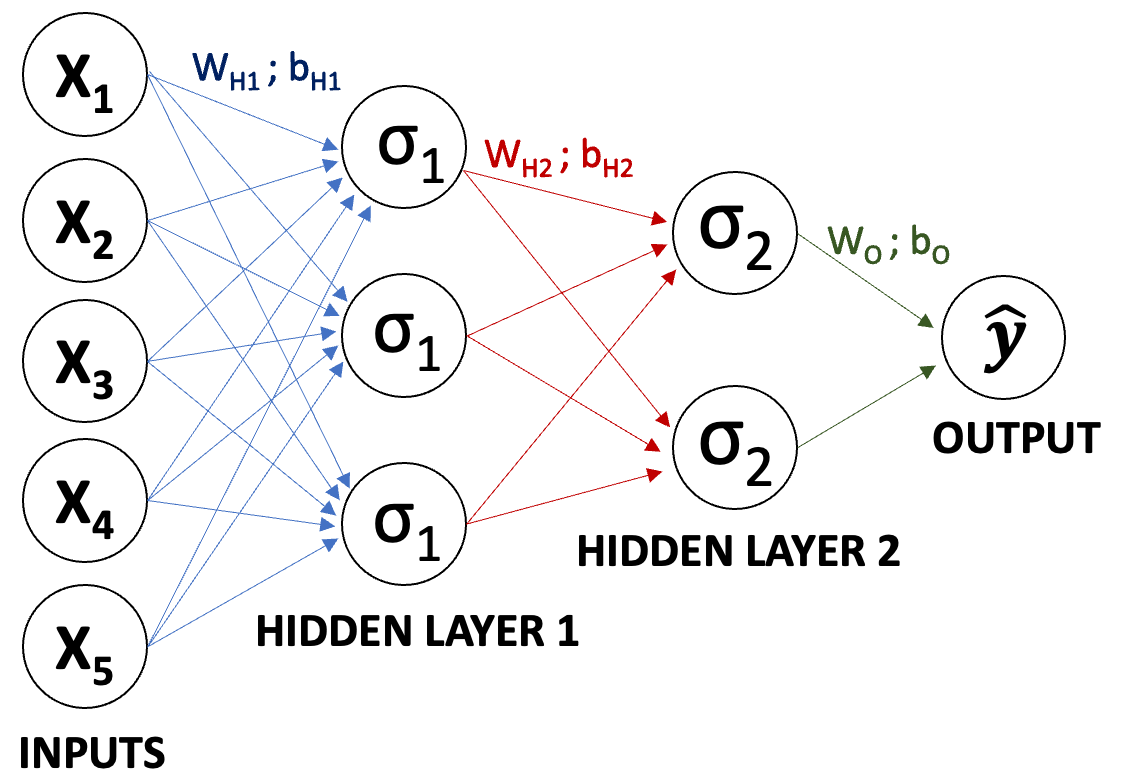
What is a Neural Network? . . . . . . . . . . . . . . . . . . . . . . . . . . . .
38
3.2.2
Recurrent neural networks (RRNs) and Long short-term memory (LSTM) . .
42
3.2.3
Considered approach . . . . . . . . . . . . . . . . . . . . . . . . . . . . . . . .
45
3.3
Exchange traded funds of market indices . . . . . . . . . . . . . . . . . . . . . . . . .
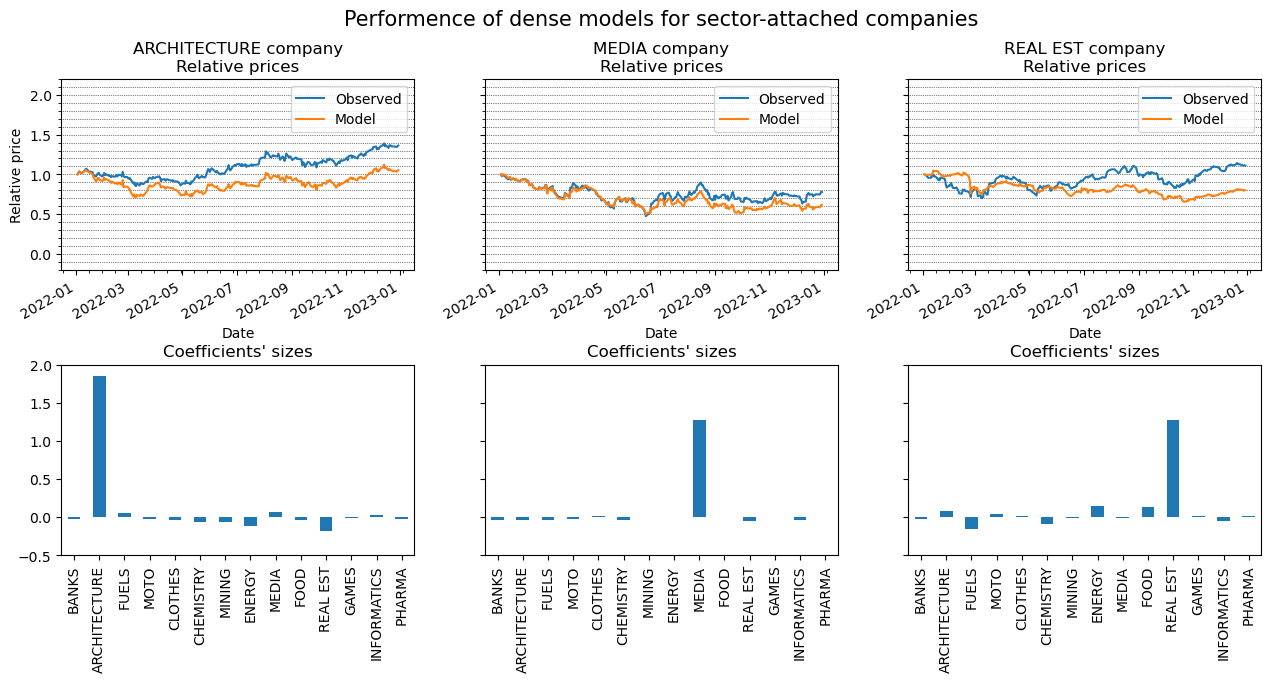
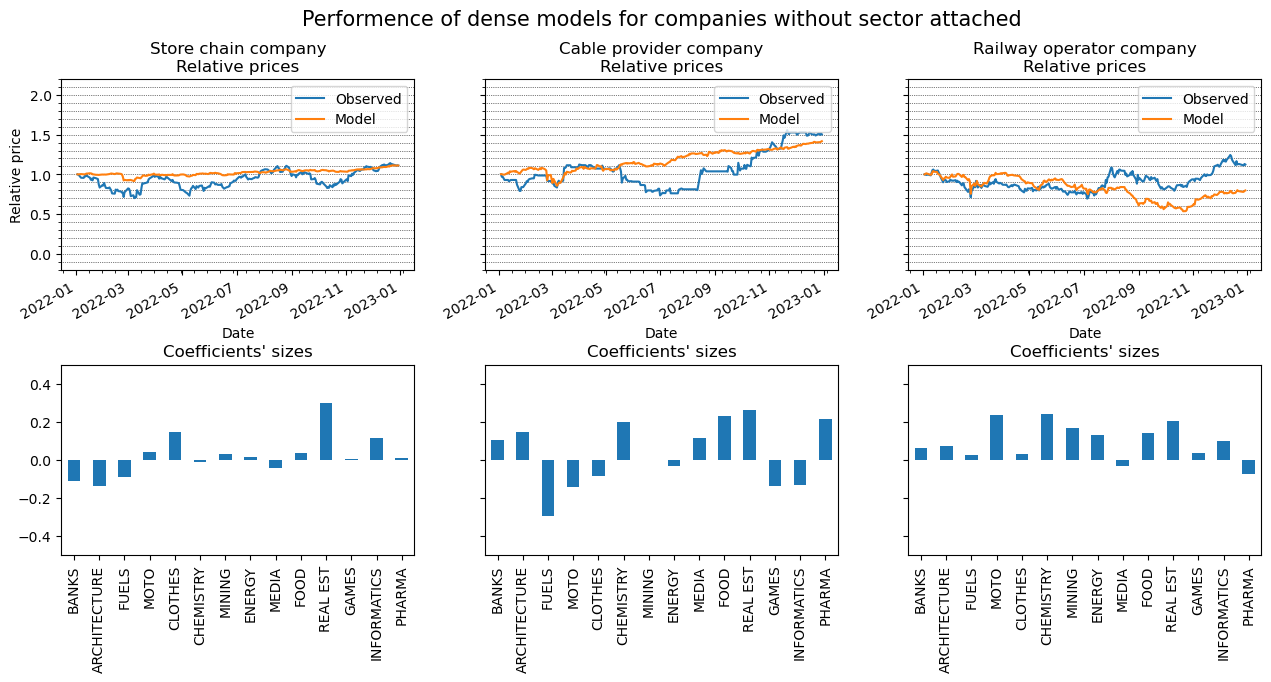
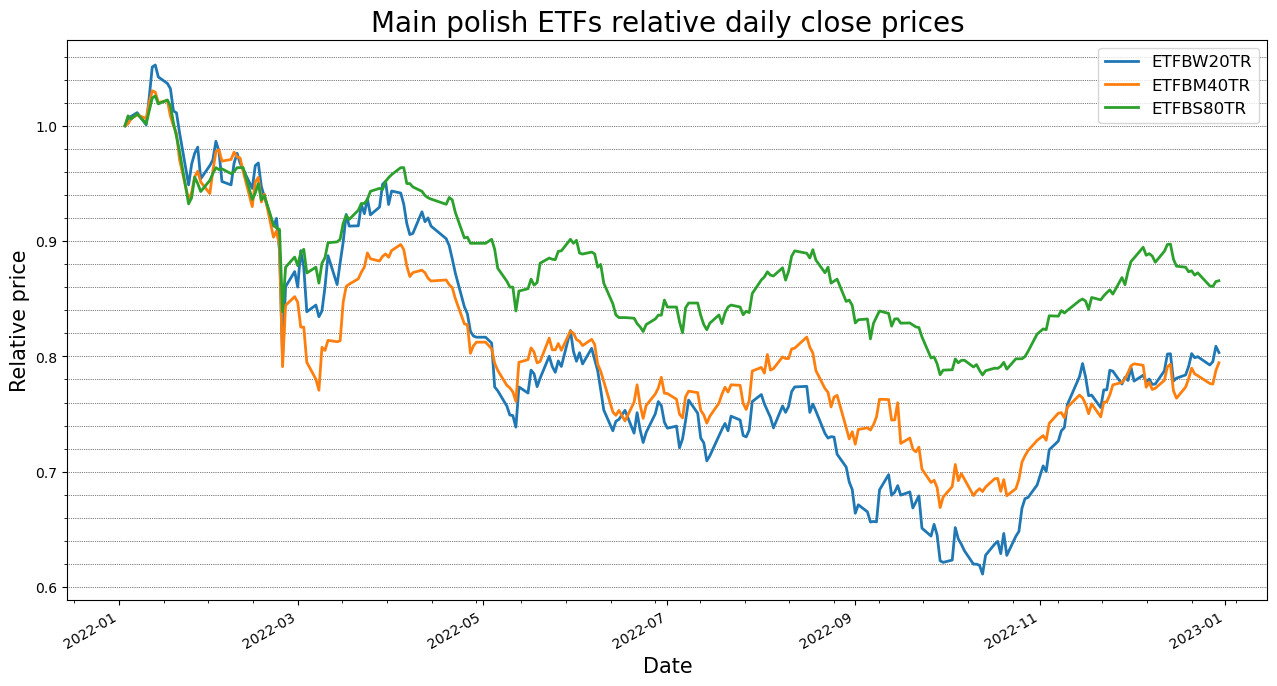
49
3.3.1
Existing ETFs approach . . . . . . . . . . . . . . . . . . . . . . . . . . . . . .
49
3.3.2
Artificial ETFs approach . . . . . . . . . . . . . . . . . . . . . . . . . . . . . .
51
4
Backtesting
54
4.1
Principles . . . . . . . . . . . . . . . . . . . . . . . . . . . . . . . . . . . . . . . . . .
54
4.1.1
Scope of backtesting and market assumptions . . . . . . . . . . . . . . . . . .
54
4.1.2
Trading rules . . . . . . . . . . . . . . . . . . .
…(Full text truncated)…
📸 Image Gallery
Reference
This content is AI-processed based on ArXiv data.