Characterizing Visualization Perception with Psychological Phenomena: Uncovering the Role of Subitizing in Data Visualization
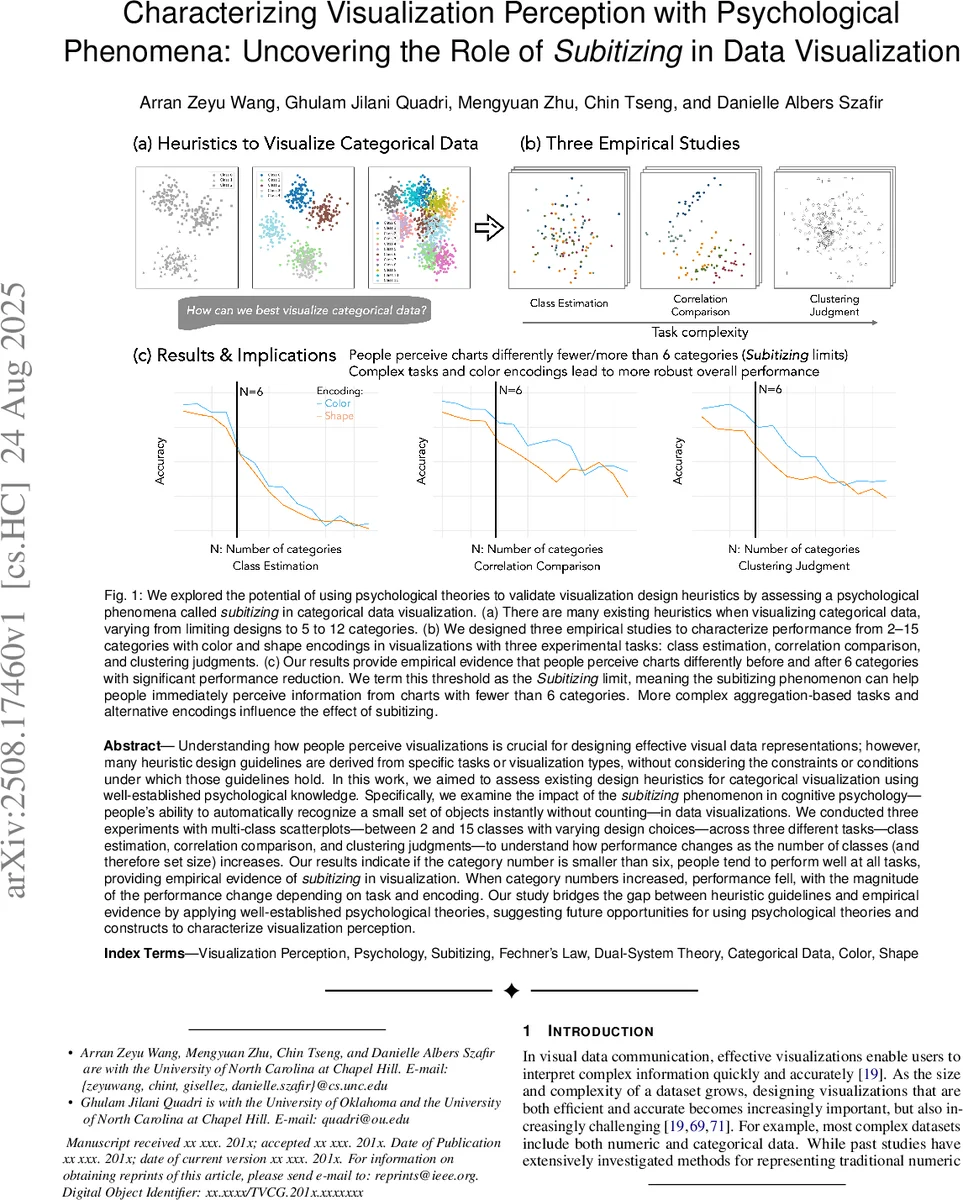
Understanding how people perceive visualizations is crucial for designing effective visual data representations; however, many heuristic design guidelines are derived from specific tasks or visualization types, without considering the constraints or conditions under which those guidelines hold. In this work, we aimed to assess existing design heuristics for categorical visualization using well-established psychological knowledge. Specifically, we examine the impact of the subitizing phenomenon in cognitive psychology – people’s ability to automatically recognize a small set of objects instantly without counting – in data visualizations. We conducted three experiments with multi-class scatterplots – between 2 and 15 classes with varying design choices – across three different tasks – class estimation, correlation comparison, and clustering judgments – to understand how performance changes as the number of classes (and therefore set size) increases. Our results indicate if the category number is smaller than six, people tend to perform well at all tasks, providing empirical evidence of subitizing in visualization. When category numbers increased, performance fell, with the magnitude of the performance change depending on task and encoding. Our study bridges the gap between heuristic guidelines and empirical evidence by applying well-established psychological theories, suggesting future opportunities for using psychological theories and constructs to characterize visualization perception.
💡 Research Summary
This paper, “Characterizing Visualization Perception with Psychological Phenomena: Uncovering the Role of Subitizing in Data Visualization,” presents a rigorous empirical investigation that bridges cognitive psychology and visualization design. It addresses the common but empirically under-examined heuristic in categorical data visualization: limiting the number of visually encoded categories to around six. The authors hypothesize that this guideline may be rooted in the psychological phenomenon of “subitizing” – the human ability to instantly and accurately perceive the quantity of small sets (typically up to four or five items) without serial counting.
To test this, the researchers conducted three crowdsourced experiments using multi-class scatterplots as a standard visualization stimulus. They systematically manipulated key variables: the number of categories (from 2 to 15), the categorical encoding method (color vs. shape), and visual complexity (number of data points). Participants performed three distinct tasks designed to probe different levels of cognitive processing: 1) Class Estimation (low-level: estimating the total number of categories), 2) Correlation Comparison (mid-level: comparing the correlation strength between two specified categories), and 3) Clustering Judgment (high-level: judging how distinctly a given category clusters relative to others).
The results provided clear and compelling evidence for the subitizing effect in visualization. When scatterplots displayed fewer than six categories, participant performance (accuracy) remained high and stable across all three tasks and both encoding types. This aligns perfectly with the subitizing limit, suggesting the visual system efficiently processes small sets of categories. However, once the category count exceeded six, a significant and sharp decline in performance was observed across the board. This performance drop followed a non-linear, asymptotic pattern: the most dramatic decrease occurred just beyond the subitizing threshold (around 6-7 categories), with the rate of decline slowing as the number of categories increased further. This pattern is consistent with Fechner’s Law from psychophysics, which describes a logarithmic relationship between physical stimulus magnitude and perceived intensity, explaining why perceptual discriminability diminishes as category count grows.
Further analysis revealed important nuances. First, color encoding consistently outperformed shape encoding, especially as the number of categories increased, highlighting color’s relative robustness for categorical discrimination. Second, the Correlation Comparison task proved more resilient to increasing category numbers compared to Class Estimation and Clustering Judgment. This suggests that aggregation-based tasks might engage different cognitive mechanisms (like focused attention and comparative judgment) that are less reliant on the immediate, parallel processing characteristic of subitizing.
The study’s primary contribution is not merely validating the “six-category rule” but providing a theoretical and mechanistic explanation for it using established psychological constructs. By grounding visualization design heuristics in cognitive theory, the work moves the field from relying on task-specific empirical observations toward building a more generalizable, theory-driven understanding of visualization perception. It demonstrates a valuable template for future research to deconstruct and explain other design guidelines through the lens of psychological phenomena, ultimately leading to more principled and effective visualization design.
Comments & Academic Discussion
Loading comments...
Leave a Comment