Computational Models of Spreadsheet Development: Basis for Educational Approaches
Among the multiple causes of high error rates in spreadsheets, lack of proper training and of deep understanding of the computational model upon which spreadsheet computations rest might not be the least issue. The paper addresses this problem by pre…
Authors: Karin Hodnigg, Markus Clermont, Rol
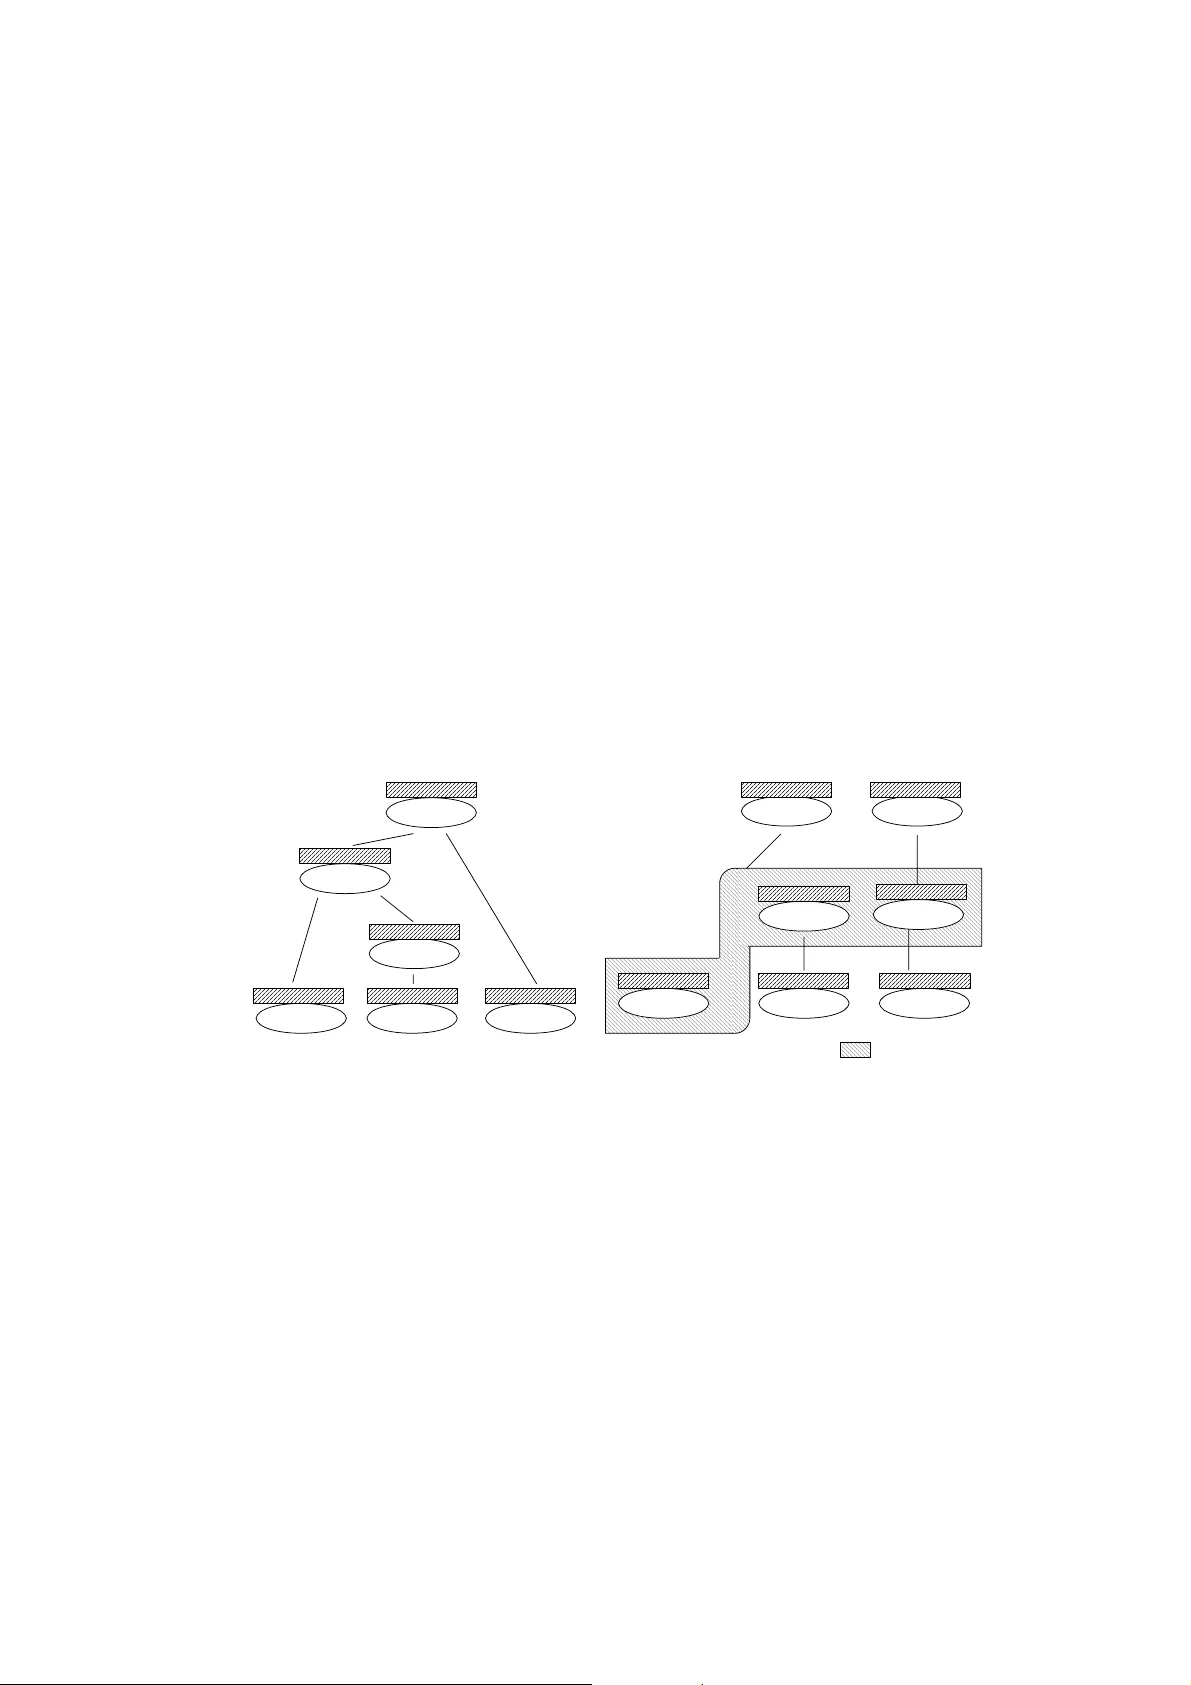
Computational Models of Spreadsheet-Development Basis for Educational Approaches Karin Hodnigg 1) , Markus Clermont 2) , Roland T. Mittermeir 1) 1) Institut für Informatik-Systeme Universität Klagenfurt AUSTRIA Roland.Mittermeir@uni-klu.ac.at , Karin.Hodnigg@uni-klu.ac.at 2) Software Quality Research Laboratory, Department of Computer Science and Information Systems University of Limerick IRELAND Markus.Clermont@ul.ie ABSTRACT Among the multiple causes of high erro r rates in spreadsheets, la ck of proper training and of deep understandin g of the comput ational m odel upon which s preadsheet c omputat ions rest might not be the least issue. The p aper addresses this pr oblem by pres enting a di dactical model focussing on cell interaction, thus exceeding th e atomicity of cell computations. The approach is motiva ted by an investigation how different spreadsheet system s handle certain computational issues imp lied from moving cells, copy-paste opera tions, or recursion. 1 INTRODUCTION This paper departs from the perspective that spreadsheets ar e end-user programs. The main objective of spreadsheet development is “manipulation and presentation of data found in tabular form” [Filby, 1998]. The in tuitiveness of spreadsheet development hides to a large degree that it is actually a programming activity. Typing constant values into some cells and a formula into another cell is not seen as programming. It is rather comparable to using a pocket calculato r. The immediate presentation of the result even supports this notion. This allows introducing n ovices without much ado. One learns to use an environment instead of learning a model. While this can be seen as base for the high popularity of spreadsheet systems, it hides the r eality that spreadsheet developers are expressing themselves in an inherent ly functional for mula language. [Nardi, Miller, 1990] identified immediate fee dback through formula evaluation, tabular grid and related layout definition, the possib ility to shift complexity by splitting formulas over different cells, and the rather declarative nature of most aspects of spreadsheet lan- guages as sources of success. But while these features are certainly helpful for those wri- ting small spreadsheets, they easily become obstacles when co mplexity increases. Cer- tainly with large and evolving sheets, lack of higher level abstractions becomes a burden. Only values are represented (formulas are eag erly evaluated), and formulas, but for a selected single cell, are hidden. This leads to a specific characteristic of spreadsheet pro- grams: hiding control and data flow info rm ation behind “static” values. During main- tenance, this complicates comprehension of existing spreadsheets. Intertwining the layout of results and dependencies of computations is another source of conceptual complexity. Cells can reference each other over larg e geometrical distance. Hence, co mprehension of a spreadsheet is a non-trivial task and consequently many errors are introduced or remain unnoticed. [Sajaniemi, 1998]. High error rates found in business spreadsheets ([Panko, 1998], [Mittermeir et al, 2002], [Brown Gould, 87]) indicate that the spreadsh eet quality issue cannot only be resolved by powerful tools. One has rather to agree with Hoare’s state ment that “a significant challenge for programming theory is to […] develop an understanding to as sist in the selection of an appropriate tool for each purpose.” [Hoare, 1999] . Based on these reflections, this paper first identifies so me crucial aspects of the spreadsheet paradigm. Then, it shows how differe ntly basic issues are solved by different implementations of spreadsheet. This calls for a common conceptual background, which will be developed in section 5. 2 THE SPREADSHEET PARADIGM To identify the target of this resear ch, one is tempted to ask, whether there i s such a thing as a “spreadsheet language” and if so, what th is language might be. For a given product, it makes no difference, whether one types = IF (A1 = B1; …) or =WENN( A1 = B1; …) . These commands have the same effect on the data. Likewise, it makes no difference, whether this command has been typed in, select ed by mouse click from some panel, or copied from a cell holding a similar formula which was edited afterwards. The clue is that the system provides the concept of an alterna tive and this concept is presented in different linguistic forms to the user. But the differences in linguistic form are rather shallow and users have to develop a conceptual model r esting on the concepts behind the functions implemented in various spreadsheet products. Since all of these functions rest on common mathematical concepts, users must not be blamed if they assume that the sheet behaves in exactly the way they expect these mathematical functions to behave. As the mathematics of the functions used in spreadsheets are well known to domain ex- perts, the functional nature of cell-computations makes spreadsheet programming impres- sively simple [Moström, 1998]. Moström and Carr subsume the basic knowledge needed to implement a spreadsheet as follows: - There is a tabular grid consisting of (addressable) cells. - A cell can hold either a formula or a static value. - The formula language is declarative, having the form = [ ] or =(,..,< cell _addrn> [; ]) with system parameter being an element of the spreadsheet syst em rather than the mathematical base of the language. - Cells can be referenced as solitaires ( A1 ) or by range reference ( A1:A12) . A referen- ce can be either absolute or relative. This resembles functional programming and clearly contrasts with “conventional” pro- gramming. The spreadsheet language is math ematically traceable and highly declarative as it “emphasises on the evaluation of expressions” [Montigel, 2002]. Normally, spreadsheet languages focus on spatial relations of data, not on the tem poral sequence. This applies at least to very basic concep ts for i mplementing spreadsheet programs and lead to the statement that the spreadshee t language is a “programming language for the masses” [Moström, 1998]. Even without speci fic training, everybod y can write models based on the writers domain expertise. But there is no warning when those limits are left because extensions of the spreadsheet paradigm like those discussed in section 4 violate basic assumptions of the model. The Conceptual Mismatch For a novice, developing a spreadsheet is like a child’s building a play-house. Form ulas are written into cells like placing bricks on bricks. The inter mediate results can be admired after each step. With sufficiently sm all problems this cell-by-cell approach can follow an implicit DDG almost in breath-first manner. The geometrical placement of cells is almost irrelevant. A B C D 1 1 2 =A1*10 =A2*10 3 100 4 =(B2 +A3)/(B2*A3) f A B C D 1 1 2 10 100 I 3 100 4 0,02 F ormula Vie w Value View =A2*10 Data Flow View Figure 2: A user’s view based upon [Igarashi, 1998] But what is easy during construction might pr ove to be difficult for later comprehension. When perusing cell B2 in Fig. 2, the cell’s value is sh own in the sheet and the underl ying formula is displayed in the formula bar. The const ant values in A1 and A3 and the formulas in A2 and B2 are related by invisible dependencies. Clicking int o one of these cells, the spreadsheet GUI shows the “first level”-dependencies, i.e., the addresses of source cells. A spreadsheet programmer may notice that A2 depends on A1, but which cells depend on B2 remains totally hidden. Thus, changes to B2 may result in changes “anywhere”. Theoretically, any computation might be affected by changes in a given cell. Navarro-Prieto and Can as’ results indicate that spread sheet writers have developed good mental structures for data flow informati on [Navarro-Prieto, Canas, 1999]. [ Tukiainen, 2001], in contrast, points out the need to memorize (invisible) coherence in a spreadsheet without explicit representation. We conjecture that comprehension becomes increasingly difficult with growing size of the sheet. It will matter specifically , when references ex- ceed the window visible on the screen. Assumi ng maintenance of the sheet, the situation is aggravated. With fading memory, the b asis for Navarro-Prieto’s hypothesis is lost. Another issue exhibited by Fig. 2 is a likel y conceptual mismatch between the display ed values and the underlying calculation model. The user does not “see” the data dependen- cies. They are hidden behind (possibly misconceived static) values. For a spreadsheet maintainer a visit of every content-bearing ce ll is necessary to build a mental model of the spreadsheet program. Every visit extends the user’s conceptual m odel, thus only the “final” (i.e. the most recent) model corresponds to the real data flow of the program. The fact that users see data dependence at best in creme ntally is particularly detrimental when those are not in line with the generally assumed left-to-right, top-to-bottom assumption and when the value-perspective allows several data-flow interpretations. 3 SPREADSHEET PROGRAMMING CHARACTERIS TICS Though intuitive, assumed data flow semantics r each their limits in critical situ ations. As stated in [Clermont, 2003 ], spreadsheet progr am s “share many features with data flow concepts”, but “some of the key concepts, such as the consumption of tokens” are not part of the spreadsheet paradigm. Questioning this statement, one realizes that spreadsheet semantics are tool-dependent. Established models to describe programming language semantics are not fully applicable and hence the broa dly shared interpretation of spread- sheets as dataflow programs breaks down. 3.1 Evaluation Strategies A decisive difference between conventional (functional) programs and spreadsheet pro- grams is evaluation time and process. Conven tional programs are fully specified before they are evaluated whereas spreadsheet eval uation takes place after each incremental de- velopment step. The end of the development pr ocess is never made explicit to the system, though. It stops, when the developer is satisfied with the results of the computation. So far, we have been unspecific when refe rring indiscriminately to the functional para- digm and to the data flow paradigm. Addressi ng evaluation, though, one has to recognize that these concepts differ in evaluation order and concept. Data Flow Semantics Data flow programs (DFP) like spreadsheet programs do not need an explicitly defined control flow. Order of execution is implicitly defined. In DFP, data dependencies control the sequence of function evaluation. As a data flow program is usually visualized by a data flow graph, one may conceptualize eval uation of a given node as soon as all its edges bear data, i.e., all required information is av ailable. The data propagated is a token that holds the result yielded by the computation of the node placed immediately downstream. This evaluation concept is based upon the cons umption of tokens. Re-evaluation of the DFP implies re-computation of all tokens. With spreadsheet semantics, however, there is no “value” marking of these edges of the DDG but rather a marking of “change”. [Yoder Cohn, 2002] point to this crucial differen- ce: In a data flow program, a cell is re-evaluated o nly, if all of its sources have new values for processing. In spreadsheets though, a single re-evaluation marker suffices to trigger re-evaluation. This marker is an exp licit element of control: Moreover, for treating loops, DFPs include loop nodes as special concep t. But loops are not part of the standard spreadsheet paradigm. 1 1 ) Excel allows recursion with limited iterations (see 4.2). But this is rather not p art of the standard re pertory of spreadsheet w riters and has concept ual lim its which m ay result in unwanted side-effects. Graph Reduction Semantic Passing control seems akin to functional programming with its graph reduction semantic [Sestoft, 2001], [Dermoud y, 2003]. Here, e ach formula is interpreted as functional statement. Graph reduction semantics imply that a function call and its arguments are replaced with the result of function application. Since the result of a function can be used more than once in a program, reduction has to be repeated for each occurrence. Consequently, [Clerm ont 2003] postulates that spreadsheet program evaluation seemingly follows graph reduction principles. There are two main arguments that show that spread- sheet programs are no pure graph reduction programs though: loops and cha nge propa- gation. - Recursion and Loops: The functional pr ogramming paradigm does not include loops. Recursion is the concept to express repetition. Recursion, however, is not part of the spreadsheet paradigm 2 since it inhibits the visibility of i ntermediate results and postulates inherently the provision of a global control fl ow. - Change propagation: The interactivity of spreadsheet programs leads to a sophisticated change propagation tec hnique [Clermont, 2003] , [Yoder Cohn, 2002]. If a cell’s content changes three st eps happen to maintain consistency: the formula’s value has to be re-evaluated, depending formulas have to be re-evaluated, and formulas within the transitive cl osure have to be re-evaluated. Thus, re-evaluation is mainly token-driven. [Burnett et. al., 2001] coined the term “conti- nuous evaluation” to highlight immediate currency of results. 3.2 Inconsistent Evaluation Strategies To resolve these contradictions, [Clermont, 2003] suggests spreadsheet programs to be considered partly as graph reduction program and partly as data flow program. Which of the two applies in a given situation becomes relevant during spreadsheet maintenance. A distinction has to be made betw een local and global evaluation: - Local Evaluation: Evaluation of a cell’s initial value (starting from its formula) is based upon graph reduction according to the spreadsheet’s DDG. - Global Evaluation: If changes in a cell occur, they are propagated via the data flow graph to all dependent cells through change tokens. This data flow graph corresponds to the reverse DDG of the spreadsheet. Thus, cells are only re- evaluated when needed. Hence, spreadsheet programs incorporate both concepts, depending on viewpoint. Due to interactivity and visibility of all cells, the global evaluation strategy implemented has to be eager. However, this does not prevent lazy evaluation to be locally applied, e.g. Excel evaluates IF-clauses lazily. There is another distinction between functiona l and spreadsheet programs. By the nature of the spreadsheet paradigm, every cell on the spreadsheet has to be considered as output whereas a functional program has a set of selected outputs. In [Yoder Cohn, 1994] an approach is presented that is based upon demand- driven evaluation of the cells of interest only. But the authors rely on “keep ing all cell values up to date”. Looking behind these differences, a spreadsheet program unifies functional and data flow concepts. As stated in the references, the very (natural) base of f unctional languages is data flow graphs where functions are nodes a nd edges represent the data dependencies. 2 ) For excepti ons and a pproxim ations see secti on 4.2. 4 IMPLEMENTATION DIFFERENCES While section 3 discussed principles of spreadsheet evaluation this one concentrates on actual implementations of spreadsheet systems. Ho w do they treat evaluation and where are differences between systems or between concept and implemen tation? Apparently, such differences will constitute risks for de velopment and pitfalls for education. 4.1 System Specific Evaluation Strategies To analyze how system builder s resolve the crucial design issues for an evaluation strate- gy, reducing unnecessary re-computation and maximizing use of available computational resources [Yoder Cohn, 1994], the implementation of Microsoft’s Excel © and Gnumeric are used. For the open source product Gnum eric, the sources used are quoted in the discussion. For Excel (2000) we had to rely mainly on the Online-Help. Excel Value Recalculation and Change Propagation To be efficient, Excel performs so-called “minimum recalculation” using the following strategy [La Penna, 2001]. It keeps an internal list of all linked (interdependent), cells bearing formulas in a workbook (like a2>b2>b4) . Cells with constant values are not part of the list, as they cannot be affected by cha nge propa gation. If a change occurs, all cells (transitively) dependent on the cell that cha nges are marked with a recalculation flag. Recalculation starts according an internal list of dependent cells. Figure 3 Formula Evaluation in Microsoft Excel 2003 Fig. 3 shows Excel 2003’s Form ula Evaluator applied to the sheet of Fig. 2. Th e evalua- tion path starts at the formula in B4 , a data flow sink in this sheet. It continues in a step- wise manner against the direction of data flow to cells B2, A2 , till A1 , a constant. Thus, graph reduction is performed and every single step can be seen by the user. Gnumeric Value Recalculation and Change Propagation Gnumeric distinguishes between two types of dependencies: single dependency, which is a reference to an individual cell ( =A1 ), and range dependency, which encompasses a set of cells ( =SUM(A1:A5). Since it is necessary to determin e dependencies for every (transi- tively) dependent cell, both dependency types ar e mapped to distinctive data structures to ease the lookup of a cell’s dependents. To recalculate values, a recursive approach traverses the given expression tree, r e-calcu- lating each source cell (recursively , if the source cell contains a f ormula). This string re- duction approach is rather inefficient if the same cells are to be re-evaluated more than once. Hence, Gnumeric buffers the cells in an evaluation queue, traversing the dependen- cy data structure. Value recalculation th en corresponds to graph reduction manner 4.2 Circular references and Iteration The spreadsheet paradigm does not provide any kind of global control flow. Thus, loops (iterations) and recursion are not defined. There are spreadsheet sy stems that simply prohibit (even the accidental use) of circ ular references. Francoeur states for an ExcelComp -Tool that ”an admissible spreadsheet contains no directed cycles“, i.e. no re- cursion [Francoeur, 2002]. Accidental use happens though by incorporatin g the cell holding an aggregation function itself into the scope of aggregation e.g. writing =SUM(A1:A3) into A3 . Surprisingly enough, there is no common approach to handle these circular references. Microsoft Excel Circular References Excel provides an ignorable warning. If a circ ular reference is accepted “as is” then every cell containing a function leading to the circ le is considered to be a terminal node (constant). Neither this cell nor its dependents will ever be re-evaluated after the warning has been ignored. Without any special marking, the cell provides the value zero. This is quite problematic since “0” could be a legitim ate value expected by the user and the rupture in the evaluation path will lead to wrong results anywhere. Dependent values will remain on whatever value they had before the recursive case occurred and remain so, even if any of their other sources is changed. By a special command-panel Excel provides an itera tion scheme exceeding the spread- sheet paradigm. It allows to evaluate a ce ll containing a circular reference over a user defined constant number of iterations. If a cha nge anywhere in the sheet, even outside the transitive closure of the cell’s sources occurs, th e cell is re-evaluated. Excel offers this to accommodate requirements of some scientific computations. Nevertheless, the introduce- tion of an even reduced iteration model is a substantia l intervention into the “traditional” spreadsheet paradigm. Gnumeric Circular References Gnumeric includes circular references into its concept. No warning or indication is given to the user. Gnumeric does not consider circul ar referencing cells be ing terminal nodes. In some (!) cases it treats circular references as a kind of two-staged loop. If the value of a cell with a circular reference has to be ev aluated, Gnumeric supposes it to start with a given value zero (0), computes the function over the non-recur sive part and takes this value to recompute over the full extent. If recalculation of that cell is necessary, i.e. if changes in one of its source cells occur, Gnumeric consults the given (old) value and uses it for re-computing the new result. A small experiment s hows this behaviour: A1 holds a constant value ( 1 ); A2 builds the sum of A1 and itself (=A1+A2 ). After the input of this formula, Gnum eric yields 2 in A2 . If the value in A1 is changed to 4 , A2 beco mes 10 . If subsequently A1 is changed back to 1 , A2 becomes 12 . Thus, the “previous” value of both cells and the “new” value of the changed cell are used to build the sum: ( 2 = 1+1+ 0, 10 = 4+4+2, 12 = 1+ 1+10 ). I.e., a non-recursive computation is performed and its res ult is added to the previous value contained in the recursive cell. Aggregation functions such as AVG () and SUM () provide results in a similar way. Trying to incorporate subtraction in A2 ( =A1-A2) leads, unexpec- tedly, to 0 with no re-evaluation taking place though. With this feature, the treatment of circular references seems even more dangerous, since probably incorrect values are computed without any warning. 4.3 Copy/Paste and movement heuristics A discussion of spreadsheets will be incomplete if specialties of the development process such as “drag-and-drop” or “copy/paste” are not considered. As formulas are paramete- rised by (either constants and/or) relative cell references, the way these references are adjusted is crucial for spreadsheet correctness. M oving Cells Moving cells from by a drag-and-drop operation is a common operation in spreadsheet development. It is distinct from cut and re-p aste at a different location, since by drag-and- drop the link to the referenced cells persist while cut-and-paste preserves the geometrical pattern of the relative addresses. To keep the spreadsheet consistent can be resolved in two ways. References pointing to the “movi ng” cells could move with the cells (according to a pointer idea) or references st arting from the cells could rather keep the reference treating them as a “geometrical” pa ttern. In the latter case, the DDG will remain unaffected except that the moving node will get a different address-label. Both systems, Gnumeric and Excel provide this feature with com putational reference keeping dominance over geometrical patterns. This principle is implem ented for both, moving cells, and inserting columns or rows. Th e deletion of cell block contents leads to zeros in cells that refer to the removed bloc k, since the cells exist but do no longer hold any value and zero is considered as default value for empty cells. If whole colum ns or rows are totally deleted, though, a referen ce problem pops up as the referenced cell does not exist any more. In this case Excel displays the error value #REF , Gnumeric does not display a value, although the cell carries the #REF!- value. Aggregation functions such as SUM or AVG play a special role in this context though. The range covered by these formulas dominates over reference or geometrical patterns. Figure 4 highlights the interaction between development steps and aggregation f unctions. Cells A1 and A2 contain constants. A3 and A4 contain the formulas =A1*10 and =A2*10 respectively. A5 contains an aggregation function with the range A1:A2 . If the formula- block A3:A5 is copied to column C , the references are adapted according to the geometrical pattern of their copy source. If the same block is moved from A3:A5 to column B though, the references to the sour ce cells persist. If a referenced cell, say A2 , is moved to D2 , then the referencing cell (still A4 ) adapts and in a notion of pointer semantics points to the new cell cont aining the referenced value. Thus A4 contains the formula = D2*10 . Interestingly enough, the aggregat ion formula does not adapt as well. A5 still contains the formula =SUM(A1:A2) and yields the value 1. The content of cell A6 will in this case yield 31. Apparently, history is only part ly preserved and the notion of physical areas dominates over development history. A B C D 1 1 2 2 =A1*10 3 =A1*10 =A2*10 =C1*10 4 =A2*10 =SUM(A1:A2) =C2*10 5 =SUM(A1:A2) =SUM(C1:C2) 6 =SUM(A1:A4) Fig. 4: Copy and Paste vs. Drag and Drop 4.4 Filling Cells All spreadsheet systems provide “filling” ope rations. Starting from a given cell users can automatically “fill” geometrically neighbouring ce lls either with values or formulas. In all cases, default adjustments are made. Whether these defaults are intuitive and meet the de- veloper’s expectation depends on the situation and on the developer’s conceptua l model. Filling Cells with Values Automated filling with values seems straight forward. Nevertheless, there are some differences between the sy stems considered. Both Excel and Gnumeric provide a “copy of constants” operation to duplicate the value of a single starting cell and a “s eries copy” operation that successively increments values (e.g. a2=a1+1 ). The distinction (common to every spreadsheet program) is based upon the “Control”-key. If more than one value is selected as sta rting point to the value series, Excel tries to figure out the subsequent values by building a geometri c series. So, if a u ser wants to fill a block with four values down a column, let them be ( 3, 7, 2, 5 ), a geometric series is built up ( 3, 7, 2, 5, 4.5, 4. 6, 4.7, 4.8, 4. 9, 5, 5.1, 5.2 , 5.3, 5.4, 5.5 ). This may not be exactly what the user expects. A copy operation with the constant values ( 3, 7, 2, 5, 3, 7, 2, 5, …) is triggered via the control-key, wh ich is in this case non-intuitional. Gnumeric on the other hand takes the differen ces of the last two values of a block to compute sequent values. The filling of a column with the values ( 3, 7, 2, 5 ) leads to a sequence of following values ( 3, 7, 2, 5, 8, 11, 14, 17, 20 , …). In Gnumeric, the control- key does not provide another function. Filling Cells with Formulas When clicking on cells filled with formulas and dragging them over an area, references are treated as geometrical pattern and constants maintain their value. Thus, there is no adaptation as discussed above. If more than one formula is selected to be copied, the block of formulas is taken and cloned, if the selection window is dragged over either rows or columns. Hence, different constants in two successive formulas remain differ ent in the newly filled formula block. In [Igarashi et al., 1998] an interactive graphical induction approach is presented. There, the structure of a spreadsheet program and regular patterns are used to induce a continuative formula pattern. 4.5 Conclusion on differences The comparison showed that even such typical spreadsheet operations like movement and filling of cells by “drag-and-drop” are implemented differently in frequently used sys- tems. This can cause unexpected results. Even if differences seem to be marginal, they indicate that common spreadsheet didactics is hard to achieve and system specifics have to creep in. Worst about these differences is the marginality of distinction. Different spreadsheet systems behave identical in mo st situations, but not always! One has to conjecture that there is no common spread sheet language which can be defined as the union of a distinct formula language and tabular l ayout issues. To fully understand spreadsheet development, one has to learn deta ils of the system too. Moreover, adaptation heuristics, defined to help spreadsheet de velopers, cause effects of non-associativity in the sequence of certain development steps. 5. SPREADSHEET SEMANTICS The previous section has shown limits of comprehending spreadsheets and hence of teaching spreadsheet development on a cell-leve l basis. The naïve perception of spread- sheets as an arrangement of cells (c.f. the bricklayer’s approach described in sect. 2) reaches its limits either when computati ons become too involved or when due to maintenance operations incorporating new requirements the sheet evolves over time. Here, a model is introduced that should help to comprehend the interdependencies between cells without falling into the problems mentioned for data flow semantics or reduction semantics discussed in section 3. As any model describing the semantics of a language, a model for spreadsheet sema ntics has to be expressive and faithful with respect to the intended semantics spreadsheet users and developers of spreadsheet systems have in mind. Further, s uch a model has to be simple in so far as it requires only a minimal number of primitives. Finally, considering the spreadsheet user-community, it has to be highly intuitive. The latter argument is to be seen as a distinction between programming lan guage semantics and spreadsheet language semantics, since the former are to be u nderstood by programming professionals whereas the latter are to be understood by applica tion experts who are rather programming laypersons. As shown in section 4, the divergent semantics of spreadsheet systems conflict with a notion of common spreadsheet semantics. Hence, one must not expect that such a model covers all detailed vari ations implemented. However, ev en if it does not cover them, it should at least not be in conflict with them. 5.1 Relationships and Visibility Another peculiarity of spreadsheets is to be consid ered. According to the bricklayer- semantics, each brick (cell) can be placed anywhere on the sheet. (Transitive) dependencies are established due to the relations hip(s) a formula establishes with the cells it references. These references are normally represented as relative positional distances from the target cell to the source cells. Hence, whenever the target cell moves, the refe- rences to the source cells experience an identical movement irrespective of whether the respective positions in the sheet contain appropriate values or not. Absolute references, i.e., references to fixed positions are also possible but not the norm. However, even in these cases the absolutely refere nced cell can be anywhere on the spreadsheet. Cells ser- ving as parameters (or data sources) for a particular formula can be arbitrarily spread over the sheet. Modifying the spreadsheet program by inserting or deleting rows or columns affects neither relative nor (interestingly!) absolute references. The relationship once esta- blished to a particular cell (with its content, either constant value or computed value) remains. Thus distance (relative) or address (abs olute) is adapted as shown in section 4.3. The relationships holding in the computational perspective of the sheet are stronger than the positional aspects. This freedom is lost with aggregation func tions. For them , the concept of a (physical) area has been defined. This is a rectangular block of horizontally and vertically con- secutive cells. In this case, however, the target cell r eceives its value from cells placed within the geometrical confinement of this r ectangle. Deletion and/or insertion of rows or columns may affect this area, if they take pl ace within the borders of the area (not, if they take place at the border). Thus the area has a certain degree of flexibility. Further, areas yielding results into aggregation functions placed in different cells might overlap (which would be a contradiction with pure data-flow semantics). Thus, there is, like with indivi- dual source cells, no unique ownership of sources. While cells on a yet empty sheet and cells containing only constant literals are globally visible indeed, this does not hold for cells containing formulas. A cell holding a formula that references only constants might still be conceived as globally visible. However, this cell cannot “see” any cell that directly or indir ectly serves as target for the value of its own computation. Otherwise, the comput ation would contain circular references. 3 Thus, there is an implicit visibility arrangement be tween cells. This arrangement depends on the (transitive) target-source relationship between cells. 5.2 The Projection-Screen Model Computations confined to individual cells are not a problem in spreadsheet education, since they are conceived as functions well understood in the application domain. The functional nature of cell-based computati on provides clear scoping. The global model remains conceptually unsupporte d though. It is not adequate ly addressed in introductory teachings, conventional models cannot fully acc ount for all effects, and typical spread- sheet operations might conflict with them. Therefore, we present a model based on the interrelationship of cells. Drawing upon the instant visibility of results of any computa tion and the implicit rela tionship betw een cells due to data dependency, we interpret cells as optical devices, reading results from screens (cells) placed in front of them and projecti ng the result of their computation on their own screen which supposedly is placed on the back of the viewing mechanism . Projection-Screens without aggregation Spreadsheets containing just empty cells, cells with constants and cells with non- aggregative formulas serve as point of departure. For all cells hold: - Empty cells can be ignored, since they do not partake in any computation. - Cells containing constant literals might contain labels or constants to be used in computations, i.e. by other formula cells. o Labels do not partake in any computation. Hence, o ne might be tempted to treat them like empty cells. However, not the cell holding a literal decides on its usage. A literal cell is globally visible. Hence, any other cell in the sheet can at any time in the develop ment process reference this cell. Hence, labels are treated like computational literals. o Computational literals (usually numeric values) are treated as primitive 0- argument formulas. Their result is the value denoted by the very literal. 0- 3 ) For excepti ons see sectio n 4.2, treat ing circul ar reference s in dif ferent im plementa tions. argument formulas (e.g. NOW() ) look at no other screen. They only present their own value on their own screen, thus making it globall y visible. - Non-aggregative formula cells have as many arguments as they are (relatively or absolutely) referencing cells in their fo rmula. They read in a non-destructive manner the values from screens mentioned in the for mula and project the result of their computation on their own screen. The screens they read from have to be conceptually positioned “in front of the m”. This model requires a unique viewing dir ection am ong screens. But it is completely independent of geometrical placem ent of source or target cells and neutral with respect to computations referencing individual cells. It shares directionality with the data-flow model, but in contrast, nothing flows. F ormula cells just read from the projection-screens “in front” of them and hide their own results from screens “in front.” As the viewing devices are constantly attentive, they realize wh en a value of one of the screens in front of them changes. This leads to re-evaluation of the own form ula. Thus, intermediate results, whether they stem from literals (0-argument formulas) or regular formulas, can be shared by as many target formulas as needed as long as the direction of visibility ”look in front of you, write the results on your back” is upheld. However, from a risk assessment perspective, one might check, whether the direction of visibility can be linearly mapped to a partial order in the geometric placement of cells. Deviations might serve as complexity measure . Computation of related risk indices would go beyond the scope of this paper though. value value value value value literal literal formula formula formula literal value value value value value value literal literal formula literal formula formula value value aggregation formula aggregation range a) b) Figure 4: Projection Screens a) without und b) with aggregation functions Projection-Screens with aggregation One might be tempted to treat aggregation functions sim ply as shorthand for explicitly mentioning a (huge) set of arguments. But section 4.3 shows that aggregative and non- aggregative functions differ from an evoluti onary perspective. Thus, the semantics of aggregation needs special treatment. Still resting on visibility, one might consider the area under aggregation as the set of screens illuminated by a common spotlight. This concept withstands evolution, since deleting a portion will reduce the area of visibility, while inserting empty space will enlarge it. If, later on, this empty space is filled, it is seen by the aggregation-function’s viewing mechanism as if it had ever been there. Like on stage, the aggregation function sets a spotlight on that ensemble of actors (still all looking up-front, carrying their result clearly displayed on the screen carried on thei r back) that partake in this particular aggregation. Like on stage, different spotlights ( on the stage they have possibly different colour) might illuminate different actors (cells) and some of them might be in the focus of different spotlights. Hence, they yield thei r values f or different aggregation functions. Actors leaving the illuminated areas are no longer seen by spectators. 5.3 Discussion of selected evolutionary steps For the sake of demonstration, some prototypical patterns frequently recurring on spreadsheets are analyzed with resp ect to the projector-screen model. Many-handed figures Certain goddesses such as Bodhisattvas are depicted with many hands reaching out in different directions. Reducing this to spr eadsheets amounts to a cell (or block of cells) affected by evolution that has several dependencies outside of t he block manipulated. In its most concentrated form, one might conceive of an IF-statement , consisting of < condition >, < argumentT >, < argumentF > where each of the three formulas might have references to other cells th at extend over the geometrical area affected by movements, insertions, or deletions. As long as these mani pulations do not affect a cell directly addressed in this “many-handed-statement” (whi ch could happen with deletions or with movements over an area where such a source- cell i s located), the computations in the statement are not affected. The principle that computational references dominate over location-based references applies. Thus, not only relative addresses ar e adjusted properly. Even absolute references are adjusted to maintain established data connections. This is consistent with the projection-screen model. Visibility is strictly based on position of the screen relative to th e screen it reads fro m. On the first level, those exhibit only constant values (either input cells or cells u sed as constants of the spreadsheet program). Every formula computing intermediate results used by a cell on the path between th e panel of constants and the cell considered puts this cell one level towards the rear of this screen/projector scene. But as insertions of rows or columns have no effect on this dis- tance nor do deletions of rows or columns (tha t do not directly affe ct a node on this chain) have any effect on this arrangement, the proj ection-screen model is consistent with such operations. The same applies if not a single ce ll but a block of cells is considered. Even if insertions (deletions) modify the size of this block, no changes in screen positioning are needed and, therefore, no visibility changes are induced. Queue on a staircase The previous case considered independent cells or independent areas. There are cases with connections within a block of cells that is treated as conceptual entity. Running numbers are the simplest example. One starts with so me constant, say 1 in e.g. cell C3 , writes =C3+1 into cell C4, and fills cells C5 till Cnn by dragging down C4 . Right to these running numbers, usually information with application sem antics is given. It might be necessary to insert or delete a row or to move part of this construct to some other place. Although the block with running num bers is a conceptual entity, the spreadsheet system deals with it as set of neighbouring ce lls with each one having just one external reference. Hence, the rules for the many-handed figures (here: single-handed) apply. This also holds for the projection-screen model. One might envision a staircase where the front element holds the constant (here 1 ) and displays it on the screen on its back. All other elements are looking at the (single) screen immediately in front of them and display whatever they read incremented by 1 . Adding a step to this staircase, or moving the tail of the queue some steps back (or the front of the queue some steps forward) does not change this visibility. Geometrical reference is adjust ed to maintain the relationship to the visible screen in front of the viewer directly affected by the geometric rupture. Deletion of individual cells, however, does have an effect in this case, sin ce not only the step of the deleted is removed; its screen is also bli nded. Hence, reference is lost and #REF is displayed as error message for the cell that lost its ancestor, but also for the cells “in the back” of the respective cell. However, when the head of this affected sub-queue gets fixed, its tail and thus the complete queue is fixed automatically. The general visibility system and the computation mechanism of the de pendent cells is not affected in this case. Those cells just cannot produce interpretabl e results because (one of) their ancestor(s) shows no result on its otherwise perfect screen. 4 But what, if not the cell but just the formula is deleted? In this case, the queue starts with 1 again without reporting any problem. Is this c onsistent? It is! Due to the default value 0 for empty cells, the cell behind the empty one notices 0 in the predecessor, increments it and thus displays 1 and all cells behind it act accordingly. Thus, a new queue is defined. Flying carpets Finally, one should look at aggregation functi ons. Here, the cells to be aggregated over are affected by operations relating to the geometrical arrangement of the sheet. But the cell containing the aggregation function can, like a flying carpet, be freely moved to a new geometric position without loosing sight. One might assume that this causes problems in a model relying strictly on data dependencies. The spotlight-interp retation of visibility helps though. The spotlight covers an area (on stage as we ll as on the sheet). This illuminated area is independent of whether the area is populated or not. The viewing mechanism has always to be in the back such that all items in the illuminated part can be seen. Thus, con- ceptually, it might be necessary to step back, if something is inserted that is already at a level far away from the front panels showing constants. If maintenance operations change the size of the illuminated area, it is i mportant to note that the scope of illumination is always defined by the fringe positions. This border does not change. Hence, deletions shrink and insertions widen the focus. Other than that, the basic mechanism remains and thus the analogy holds. Since aggregation requires only visibility, the analogical model creates no contradictions, if parts of the illu minated area are illuminated by different spots (say, different wave-length) such that each spot serves to identify the input to its particular cell holding some di stinct aggregation function. Recursive images As there are different implementations, we cannot give a single consistent answer for recursion. However, the projection-screen model can cope with both situations men- tioned. The single evaluation step identifies a problem, shuts off projection and replaces it with a still-picture. The pseudo-recursion implemented as limited number of iterations places an additional mirror in a slightly angl ed position such that each iteration can see the non-recursive portion as well as the result of the last iteration. 4 ) In a variation of the queue in a staircase, one m ight think of situations where only every n-th step holds an incrementing form ul a. In thi s case, the argum ent raised fo r deletions obviously applies only if a formula bearing cell is deleted. Otherwise, the many-handed figure case applies. 6. Summary Cell based specification and immediate feedback made spreadsheets a programming device for non-programmers. Spreadsheets provide abstraction through information hi- ding and modularity. Operations such as copy/paste, drag, and fill support a “ next cell”- development approach. While this is conve nient when developing a spreadsheet, it is harmful if changes and modifications have to be made. Here, a solid conceptual model is needed. Current spreadsheet implementations do not strictly follow an y of the established conceptual models. They rather follow a tele ological approach of “what the user probably intends to do”. But phrases containing the word “probably” are problematic as they do not hold for all situations. This poses a challe nge for education. If limits and “critical factors” remain unnoticed or misconceived, spreadsheet quality is seriously impacted. This paper presented a model to explain spread sheet mechanics to beginners that extends to expert level concepts. It should not be one of the dangerous crutches that break when users try to leave their cradle. Whether this is true has yet to be tested in formal experi- ments and by exposing the model to the commun ity. After all, with spreadsheet education one has to consider that spreadsheet progra mmers are not interested in programming per se [Peyton-Jones, Blackwell, Burnett, 2003]. But nevertheless, progress needs education. This holds for spreadsheets as fo r any other intellectual activity . 7. REFERENCES [Brown Gould, 1987] Polly Brown and John Gould (1987) “An experiment al study of people creating spreadsheets”, ACM Transactions on Information System s, Volume 5 (3), pages 258-272. [Burnett, 2001] Margaret Burnett (2001), “Software Engineeri ng for Visual Programming Languages”, Handbook of Software Engineering and Knowledge Engineering Vol. 2, pages 77-92. [Burnett et. al., 2001] M. Burnett, J. Atwood, R. Djang, H. Gottfried, J. Reichwein an d S. Yang (2001) ”Forms/3: A First-Order Visual Language to Explore th e Boundaries of th e Spreadsheet Paradigm“, Journal of Functional Programming 11 (2), pages 155-206. [Clermont, 2003] Markus Clermont (2002) “A Scalable Approach to Spreadsheet V isualiz ation”, Ph D-Dissert ation (University of Klagenfurt). [Filby, 1998] William G. Filby (1998) “Spr eadsheets in Science and Engineeri ng”, Springer, 1998 [Francoeur 2002] Joe Francoeur (2002), “Algorithms using Java for Sp readsheet Dependent Cell Recomputation”, Technical Paper at The MITRE Corporation, http://arxiv.org/abs/cs.DS/0301036 , 16 .30 p.m. 2004/4/8 [Hoare, 1999] C.A.R. Hoare (1999) “Theories of Programming: Top-Down and Bottom- Up and Meeting in the Middle”, Correct System Design 1999 (Lecture Note s in Computer Scien ce), pages 3-28 [Igarashi et al., 1998] Takeo Igarashi, Jock Mackinlay, Bay-Wei Chang a nd Polle Zellweger (1998) ”Fluid Visuali zation of spreadsheet structures“, Proceedings of the 1998 IEEE S ymposium on Visual Languages, pages 118-125 [LaPenna, 2002] Loreen La Penna (2002), “Recalculation in Mi crosoft Excel 2002 ”, Microsoft Corporation, http://msdn.mircosoft.com/libr ary/en-us/ dnexcl22/htm l/odc_xlrecalc.asp ?frame=true , 16.30 p .m. 2004/4/8 [Meeks, 2001] Michael Meeks (2001) “A discussion of the new dependen cy code, version 0.2”, Gnumeric ( 1.1.16) Docs [Mittermeir et. al, 2002] Roland Mittermeir, Markus Clermon, Christian Hanin ( 2002) ”A spreadsheet Auditing Tool Evaluated in an Industrial Context“, Proceedings of the 3rd A nnual Symposium of the EuSpRIG, pages 35-46 [Montigel, 2002] Markus Montigel, ”Visual Programming Languages (Spreadsheet languages)“, 14.3 0 p.m. 2004/5/8 http://www.cs.uno.edu/~markus/02_Courses/ past/csci6990/6990.03_Spreadsheet.ppt.pdf [Moström Carr, 1998] Jan Erik Moström and David A. Carr (1998) , “Pr ogramming Paradigms and Pr ogram Comprehension”, Proceedings of the 10 th Annual Workshop of the PPIG’98, pages 117-127 [Nardi, Miller, 1990] Bonnie Nardi and James Miller, “An Ethnographic Stud y of Distributed Problem Sov9ing in Spreeadsheet Development. In Proc. CSCW, ACM, October 1990, pp. 197 – 208. [Navarro-Prieto Canas, 1999] Raquel Navarro-Prieto and Jose J. Can as (1999), “Mental Representation and Imagery in Program Comprehension”, Proceedings of PPIG99 (Psy chology of Programming Interest Group) [Panko, 1998 ] Raymond R. Panko (1998) “What we know about spreadsh eet erro rs”, Journal of End User Computing, Volume 10 (2), pages 15-21 [Pennington, 1987] Nancy Pennington (1987), “Comprehension Strategies in Programming”, Empirical Studies of programmers: Second Workshop, pages 100-113 [Peyton-Jones et al., 2003] Simon Peyton-Jones, Alan Blackwell and Margaret Burnett, “A User-Cen tred Approach to Functions in Excel”, http://research.m icrosoft.com/~sim onpj/Papers/excel , 14 .30 p.m. 2004/4/6 [Sajaniemi, 1998] Jorma Sajaniemi, (1998), “Modelling Spreadsheet Audit: A Rigorous Approach to Automatic Visu alization”, Technical Report A-1998-5, University of Joensuu [Sestoft, 2001] Peter Sestoft (2002) “Demonstrati ng Lambda Calculus Reduction ”, in “The essence of computatio n: complexity, analysis, transforma tion”, pages 420-435, Springer Verlag [Tukiainen, 2001] Markku Tukiainen (2001), “Comparing Tw o Spreadsheet Calculation Parad i gms: An Empirical Study with Novice Users”, Interacting with Co mputers (IWC) , 13 (4), p. 427-446 [Yoder Cohn, 1994] Alan G. Yoder, David L. Cohn (1994), “Observations on Spreadsheet languages, Intension and Dataflow”, (TR 94-22), http://www.cse.nd.edu/resear ch/tech_reports/1994.h tml , 16.30 p.m. 2004/4/8 [Yoder Cohn, 2002] Alan G. Yoder, David L. Cohn (2002), “Domain-sp ecific and General-Purpose Aspects of Spr eadsheet Languages”, http://www-sal.cs.uiuc.edu/~kamin/dsl/papers/yoder.ps 16.30 p.m. 2004/4/8
Original Paper
Loading high-quality paper...
Comments & Academic Discussion
Loading comments...
Leave a Comment