MuseCL: Predicting Urban Socioeconomic Indicators via Multi-Semantic Contrastive Learning
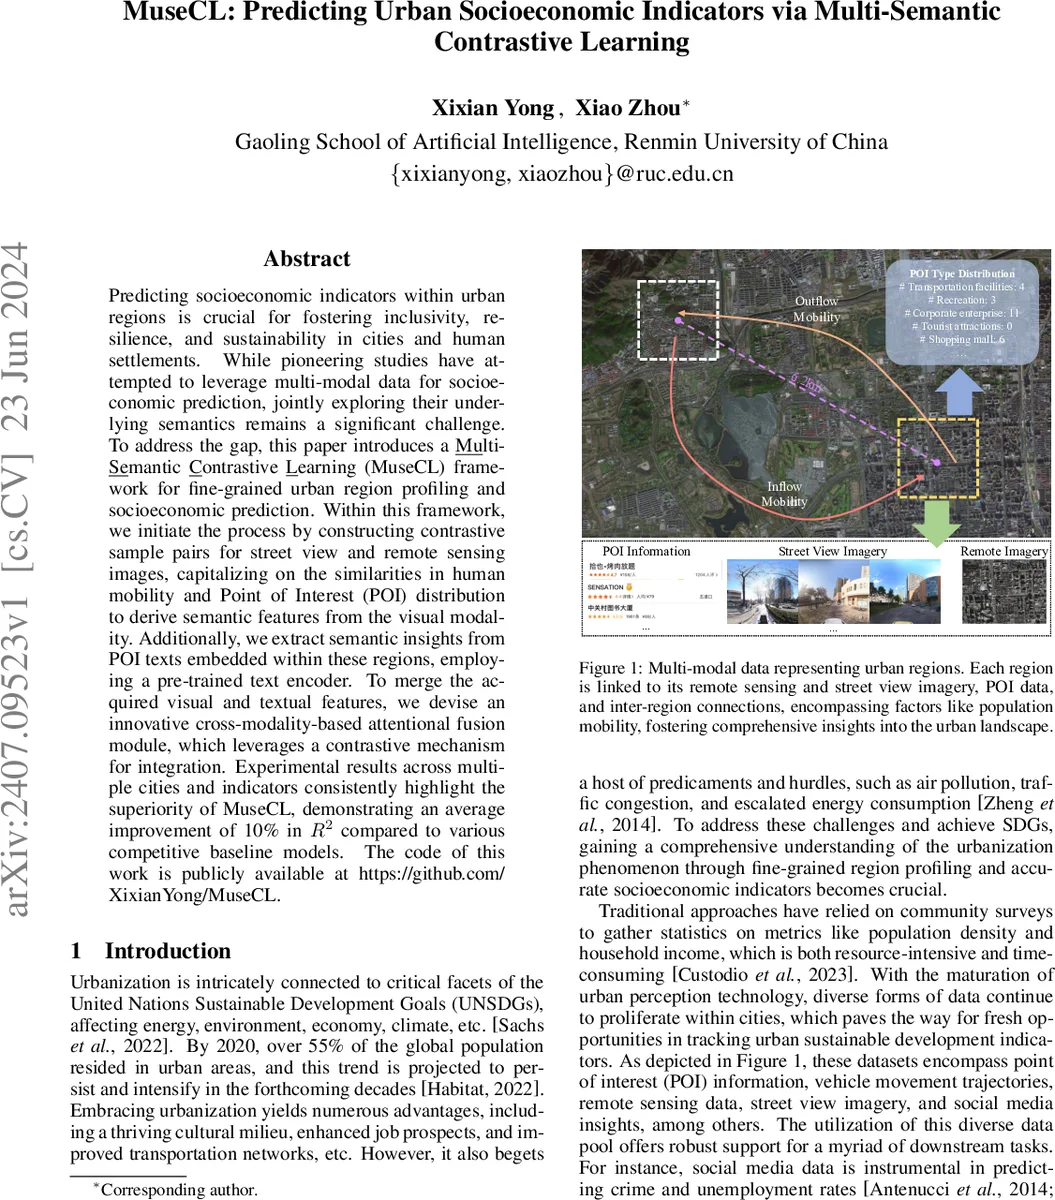
Predicting socioeconomic indicators within urban regions is crucial for fostering inclusivity, resilience, and sustainability in cities and human settlements. While pioneering studies have attempted to leverage multi-modal data for socioeconomic prediction, jointly exploring their underlying semantics remains a significant challenge. To address the gap, this paper introduces a Multi-Semantic Contrastive Learning (MuseCL) framework for fine-grained urban region profiling and socioeconomic prediction. Within this framework, we initiate the process by constructing contrastive sample pairs for street view and remote sensing images, capitalizing on the similarities in human mobility and Point of Interest (POI) distribution to derive semantic features from the visual modality. Additionally, we extract semantic insights from POI texts embedded within these regions, employing a pre-trained text encoder. To merge the acquired visual and textual features, we devise an innovative cross-modality-based attentional fusion module, which leverages a contrastive mechanism for integration. Experimental results across multiple cities and indicators consistently highlight the superiority of MuseCL, demonstrating an average improvement of 10% in $R^2$ compared to various competitive baseline models. The code of this work is publicly available at https://github.com/XixianYong/MuseCL.
💡 Research Summary
MuseCL introduces a novel Multi‑Semantic Contrastive Learning framework for fine‑grained urban region profiling and socioeconomic indicator prediction. The authors recognize that urban environments generate heterogeneous data streams—street‑level photographs, remote sensing imagery, point‑of‑interest (POI) textual descriptors, and population mobility flows—and that existing methods either treat these modalities independently or fuse them without respecting their distinct semantic relationships. To bridge this gap, MuseCL proceeds in three stages.
First, visual semantics are learned separately for street view and satellite images. Instead of relying on geographic distance alone (the classic First Law of Geography), the authors construct contrastive sample pairs based on functional similarity: street view images are paired according to mobility similarity (λ_PM) derived from inbound/outbound flow counts, while satellite images are paired according to POI type distribution similarity (λ_POI) computed via Euclidean distance over K POI categories. For each modality, an anchor image, a positive sample (high similarity), and a negative sample (low similarity) are formed, and a shared CNN encoder maps them into a low‑dimensional space. A triplet loss with cosine similarity pushes anchors toward positives and away from negatives, yielding modality‑specific embeddings that encode human activity patterns (street view) and built‑environment characteristics (satellite).
Second, the textual dimension is incorporated. POI records are tokenized into bag‑of‑words that capture categories, ratings, and reviews. A pre‑trained language model (e.g., BERT) encodes each region’s POI text into a semantic vector. To merge visual and textual cues, the authors devise a cross‑modal attentional fusion module: visual embeddings serve as queries, while text embeddings act as keys and values. The attention mechanism computes relevance scores, allowing the model to weight textual semantics according to visual context. This results in a unified region representation ε_i that simultaneously reflects visual appearance, functional land‑use, and socio‑cultural descriptors.
Third, the learned ε_i vectors are fed into downstream regression or classification models to predict a suite of socioeconomic indicators such as median household income, employment rate, education level, health outcomes, and business vitality. Experiments are conducted on three major Chinese metropolises (Beijing, Shanghai, Guangzhou) across ten indicators. MuseCL consistently outperforms state‑of‑the‑art baselines—including multimodal graph embeddings, CrossMap, and simple concatenation approaches—by an average of 10 % in R². Ablation studies reveal that (a) the mobility‑guided street view contrastive learning contributes the most to activity‑related indicators, (b) POI‑guided satellite contrastive learning benefits land‑use‑related metrics, and (c) the cross‑modal attention fusion yields a 4‑6 % boost over naïve feature concatenation.
The paper’s contributions are: (1) a semantics‑aware contrastive sampling strategy that moves beyond pure spatial proximity, (2) a triplet‑loss driven visual encoder that respects functional similarity, (3) a cross‑modal attention fusion that aligns visual and textual semantics, and (4) extensive multi‑city, multi‑indicator validation demonstrating robust performance gains. Limitations include dependence on high‑quality POI text, the need for reliable mobility data (which may be unavailable in some regions), and the computational overhead of generating large numbers of triplet samples. Future directions suggested are (i) incorporating temporal dynamics of mobility for a time‑aware contrastive loss, (ii) designing lightweight attention mechanisms for real‑time city‑scale deployment, and (iii) testing generalization on smaller cities or rural areas. All code and data processing pipelines are released on GitHub, promoting reproducibility and facilitating further research in urban informatics and policy‑driven analytics.
Comments & Academic Discussion
Loading comments...
Leave a Comment