The green hydrogen ambition and implementation gap
Green hydrogen is critical for decarbonising hard-to-electrify sectors, but faces high costs and investment risks. Here we define and quantify the green hydrogen ambition and implementation gap, showing that meeting hydrogen expectations will remain …
Authors: Adrian Odenweller, Falko Ueckerdt
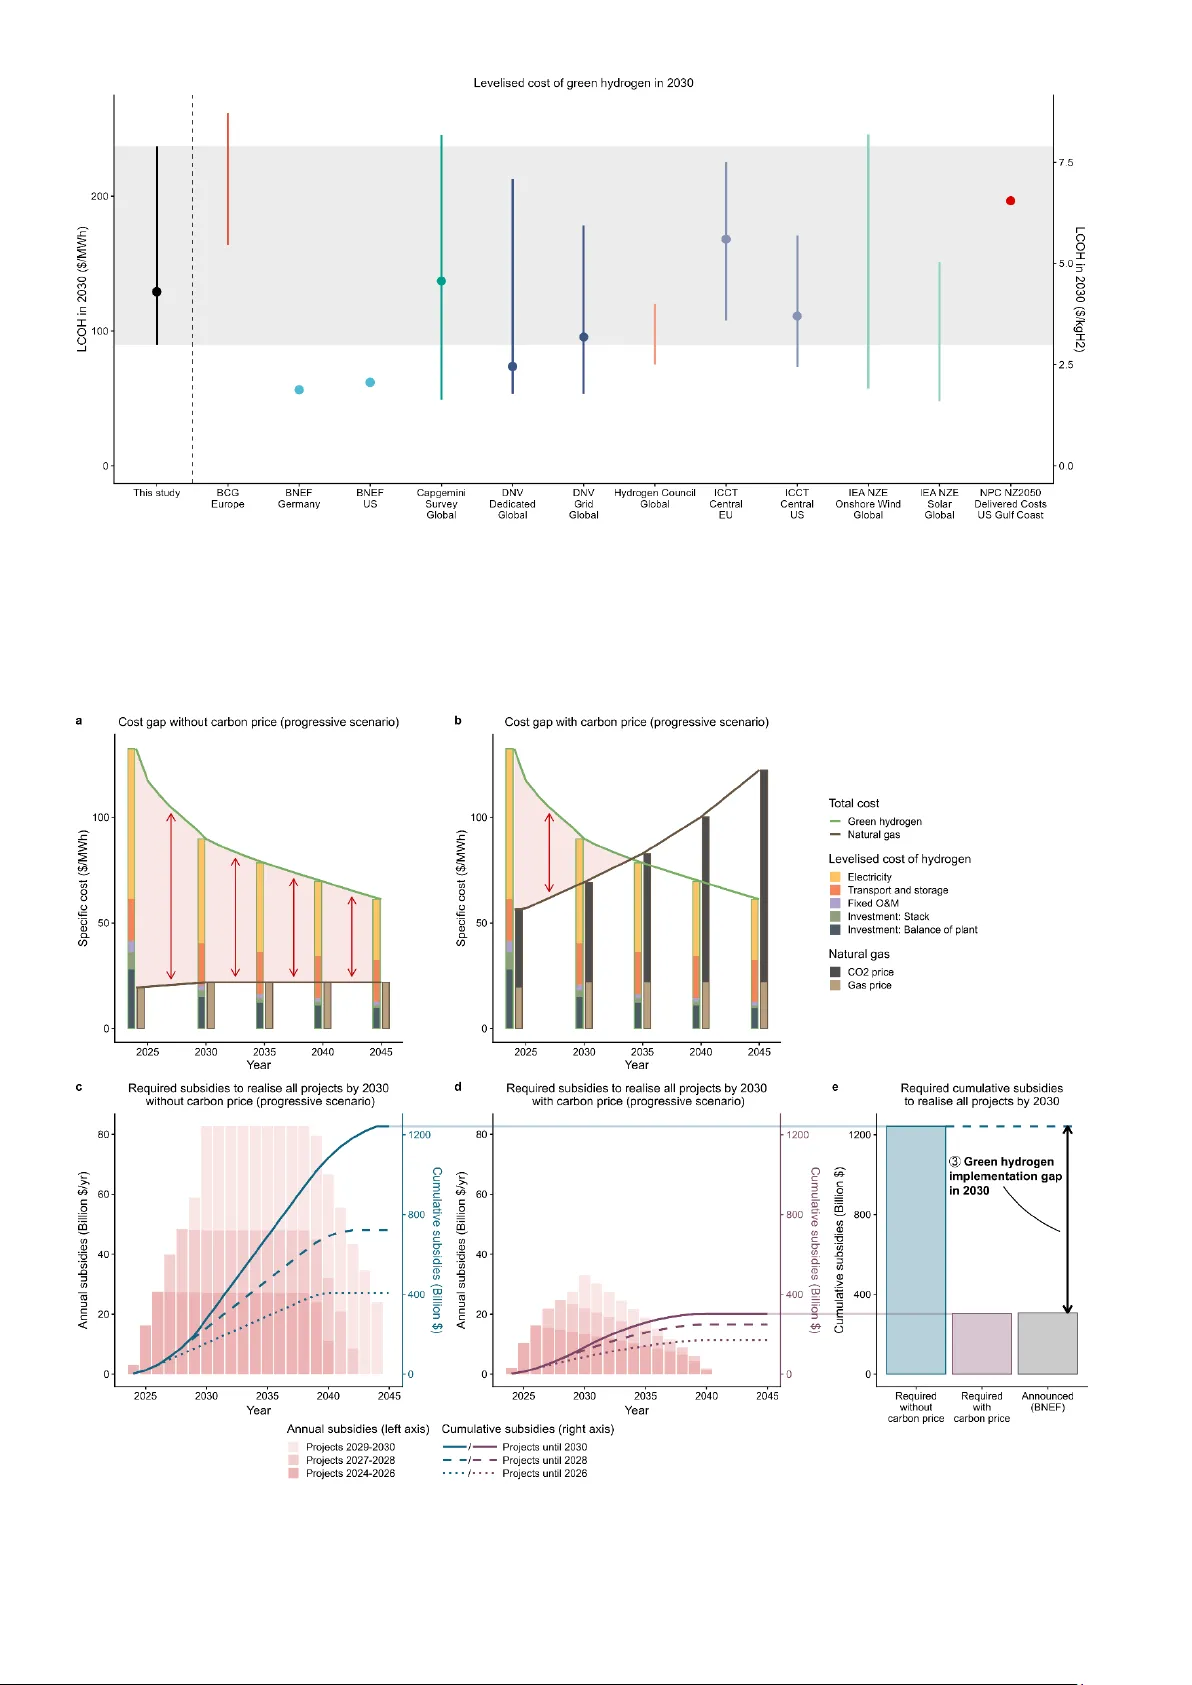
1 T he gr een h y dr og en ambition and implementa tion g ap Adria n Odenwell er 1,2 , Falko Ueckerdt 1 1 Potsd am Insti tute for C limat e Impac t Resear ch, M ember o f the Leib niz As sociatio n, Pot sdam, German y 2 Global En ergy Systems Anal ysis, Technical Uni versity of B erlin, Berlin, German y Abstr act Green hyd rogen is critical for decarbon ising hard - to - ele ctrif y sectors, but fa ces high costs and inv estment ris ks . H ere we de fine and quantify t he gree n hydrogen ambi tion and impleme ntation gap, show ing that meeting hydrogen expecta tions will rema in challe nging despite s urging announcements of projects and subsi dies. Tracking 137 proj ects over thre e years, w e ide ntify a wide 2022 i mplemen tatio n gap wit h only 2% of glo bal capacity announce ments finis hed on schedule. In contrast , the 2030 ambitio n gap to wards 1.5°C scenario s is gradually clo sing as the announced proje ct pipeline has ne arly tripl ed to 441 GW within thr ee years. H owever , w e estima te that , without carbon pricing, realising all th ese project s would r equi re global sub sidie s of $ 1.6 tri llion ($1. 2 – 2.6 trillion r ange), far exceed ing announced s ubsidies. Given past and f uture implementation g ap s , policyma kers must prepar e for prolonged green hydrogen s carcity. Pol icy support nee ds to sec ure hydrogen i nvestments , but should focus on applications where hydrogen is indis pensable. Introduction There i s a widespre ad consensus among scientist s 1–5 , industry 6 and increa singly also policymak ers 7 that gree n hydrogen, produce d from rene wable el ectric ity via electrol ysis, is critica l for reducing emission s in end - use app lications that de fy straightforward electrification . Addi tionally, hydroge n is a promising candidate for long - duration e nergy storage of renewa bles 8,9 and the pre cursor to all electrofue ls 10 , which are highly versatile yet costly 11 . Consequently , p olicy measure s to stimulate the hydrogen market ramp - up are gaining momentum as more than 40 gover nmen ts h ave already adopted hydroge n strate gies 1,7 . Promi nent example s are the suppl y - sid e subsid ies im pl emente d through the US Inflation Reduction Act 12 and t he EU Hydrog en Bank 13 . Such pol icy suppor t is urg ently require d : to meet the media n ambition in 1.5°C scenarios, 350 GW by 2030 , gree n hydrogen produ ction needs to gro w at least 1 90- fold , mor e tha n doubling ea ch year . However , imp lementa tion is not goin g according to plan . Following a surge of ent husiasm 14, 15 , the g r een hydr ogen mark et and as sociate d expec t ations ha ve rec ently ent ered a pha se of consolidat ion 16 as high cost s 17 , limited dema nd 18 and laggi ng implement ation of support policies 1 are hampering deploym ent . Shortfa lls in the announce d deployment of elect rolysers , th e key component for green hydrogen producti on, are repres entati ve of the syste mic cha lleng es of scalin g up supply, demand and infr astructure at the sa me time. In 2022, instead o f the 3 .8 GW electrolysis capa city initiall y expected, eventually only 0.63 GW was reali sed on time ( Fig ure 1a) . Similarly , in 2023, of th e 9.4 GW expected , onl y 1. 86 GW will be rea lised a t best. I n stark contrast t o th ese r ecent setba cks, announced futur e growth rates of gr een hydrogen have incr eased substantia lly over the pa st th ree yea rs , indicating a backlog of p roject s as well a s fu rther in creas in g ambition ( Figure 1 b) . Th is ra is es que stion s such as ( i) can re cent failure ra tes and th e looming “ valley of deat h” 19 be o vercom e to meet update d project announc ements, ( ii) did the e xp ected role o f hydrogen in ambitio us climate chan ge mitigat ion scenarios change, an d (iii) what are plausible im plementation pathw ays under current ly announc ed hydrogen s up port policies ? In this pa per , we struct ure and analyse the past and future chal len ges of t he nasce nt green hydrog en industr y by intro ducing and quantifying the green hydr ogen ambiti on and implem entation gap . This buil ds on the well - establis hed con cept s of emi ssion g aps 20 and recent extens ion s towards a car bon dioxide removal gap 21 . Looking back, w e defi ne the past implementation gap as the 2 differ ence bet ween announced an d eve ntually realis ed pro ject capa city in 2022 an d 2023 ( Figure 1a, ① ). Looking ahead to 2030 , we defin e th e ambition g ap as the di fferenc e bet ween 1.5°C scenari o requirements and announc ed projects , and find th at it has been gradu ally closing in the past t hree y ears ( Fi gure 1 b, ② ) . Howe ver, on the other hand, this has been accom pa nied by a wideni ng futu re impl emen tation gap, wh ich we de fine a s th e diffe rence between a nnounced projec ts and projects that are backed by policies in 203 0 ( Figure 1 b, ). Analys ing the competit ion of green hydroge n with natural ga s, we estimate that g reen hydrogen will require sub sidies , or alternat ive policies such as end - use quotas, for at least anothe r decade – even wi th ambitious car bon pricing and much longer wit hout. Th is article is struct ure d along t hese thr ee gap s , followed b y a discussion of policy i mplication s in order to safegua rd climate targe ts against unce rtain green hydro gen supply. Figure 1 : The g reen hydrog en ambi tion and imple mentation ga p in the past and the futur e . a, Past gr ee n hydrogen i mplement atio n gap in 2022 and 2023 , defi ned as the dif ference betwe en pro ject annou ncement s and reali sed proj ects (see Figure 3). b, G reen h ydrogen ambitio n and imple mentatio n gap in 203 0 . We define t he 2030 ambition g ap as th e difference between 1.5°C scenari os and pro ject anno unceme nts ( see Figure 4b) . T he depic ted scenario range shows the IEA Net Zer o Emissions by 2050 Sce narios , while t he full anal ysis inc ludes furt her sc enarios ( see Figure 4a , Exten ded Data Fi gure 2 and Methods ). We define the 2030 green h ydrogen im plemen tation gap as the difference between projec t announce ments a nd our e stimate of projects that are supporte d by implem ented de mand - side policies or can be fin ancially s upporte d with cur rently announced subsidies (see Figure 5 and Extend ed Data F igure 9) . The grey line i ndicat es our ce ntral esti mate , while the light grey corri dor indicat es the unc ertaint y range sp anned by the sensitivity analysis ( see Method s ). Gree n hydrogen pr oject an nouncement s are s hown in terms of electr ical inpu t capacity of the electrolyser . The wide green h ydrogen i mplementatio n gap in 2022 and 2023 Green hydro gen project announce ments revea l two opposi ng trends o ver the pa st three y ears . Fi rst, there has been a notable shor t - term setb ack, wi th expe ctati ons of rea lised capa city diminishing as proj ects approa ch thei r announced launch ye ar ( Figure 2 a) . T his trend of downward - adjus ted expect ations pers ists in both 2022 and 2023, indica ting a dramatic green hy drogen imple mentati on gap in recen t yea rs. Secon d however , this trend re verse s from 20 24 o nward s , wit h project announce ments increa sing steadil y over the past three ye ars ( Figure 2 b) . The announc ed steep mid - ter m gro wth is most ly drive n by the EU, whic h accounts for t he largest share of anno unced capacit y by 2030, followed b y Australia, an d Central and South America ( F igure 2 d ). These opposing trends r aise the question whet her future promise s can overcome past setbac ks. We address this question in th e next sect ion, follo wing th e qua ntification of th e 2022 and 2023 green hydrogen implementatio n gap. Track ing 137 indivi dual green hydroge n projects announced gl obally for 20 22 over the pas t three years (see Methods ), w e obse rve a subs tantial implem entation gap ( Figure 3a ). A compari son of expectation s in 2021 with the final outco me reveals tha t only 2% of the total capaci ty ann o unced for 2022 was realis ed on time, with 42 % experiencing d elays and 56% disappearing a ltogether ( Figure 3 b). Even within the s ubset of projects that had secured final investmen t decision s (FIDs) or were already unde r construction , only 15% were comp leted on time. Similar ly, comparing exp ectations in 202 2 with the final ou tcome, merely 4% of total announced capacity was re alised on time, with 71% faci ng delays and 25% disappearing ( Figur e 3 c). Notably, proj ects in the feasibi lity study or co ncept stage had a succe ss rate of z ero, implying that proj ects la cking a n FID at the time of a nnoun cement 3 were n ever reali sed on tim e. These hi gh failure rates are not compensate d by the influx of newl y announced projec ts or proje cts that were delay ed fro m previo us years (g rey b ars in Figure 3 a) such that a dramatic gre en hydrogen implement ation gap of mo re than 3 GW, equivalent to more than 95% of initiall y announced capaci ty, rema ins in 2022. Figure 2 : Green hy drogen project announcem ents as expecte d in 2021, 2022 and 2023. a- b, P roj ect annou ncements by status from 2020 -2024 and 2024 - 2030, re spectively. FID stands for final investmen t decision. c- d, Proj ect announc ements by region from 2020 - 2024 an d 2024 -2030, respect ively. F or each ye ar of pro ject launc h there are three bars. The left bar shows th e ex pectatio n in 2021, the middle bar sh ows the expec tation in 2022 , an d the righ t bar shows the expe ctation in 20 23 , each of w hich corr espond to different project database sn apshots (see Methods ). Two main tr ends are v isibl e. First , in 2022 an d 2023 project announcem ents decre ase stro ngly as the y ear of p roject l aunch appro aches (a , c ), l eading t o a wid e green hydro gen implem entati on gap (se e Figure 3) . Seco nd, af ter 2024, this pattern reverses as the project pipelin e has sur ged over the past t hree years (b, d), there by grad ually closi ng the green h ydrogen am bitio n gap to 1.5°C scena rios ( see F igure 4) . However, t he vast majorit y of projec ts have no t secure d a n FID yet (b) , which gives rise to th e 2030 gree n hydroge n implem entatio n ga p due to a m ismatch o f required and announc ed poli cies (see Figure 5). The hig h failure r ates of green hydrog en projects in 2022 could be linked to suppl y chain dis ruptions caus ed by the COVID - 19 pandemic and surgin g electri city prices du ring the European ene rgy crisis . However, trac king 207 ind ividual proje cts anno unced for 2023 reveal s similar tr ends ( Extended Data Fi gure 1 ). F or 2023, som e uncertainty remains since the datab ase is released in October , meaning the final outcome of project a nnouncements c an only be deter mined in the fol lowing yea r (see Methods ). Despi te this uncer tainty, already by October 2 023 expec tations had dropped substantial ly, indicating that no more than 14% of the total ca pacity annou nced for 2023 would be realised on time ( Extended D ata Figure 1 c). Simi lar to 2022, the succ ess rate of project s in the feas ibility study or c oncept stage announced for 2023 will be 1% at best. In sum mary, althoug h likely not as wide as in 2022, the impl ementatio n gap is set to persist in 2023. 4 Figure 3 : The 2022 green hydr ogen implem entation ga p . a, Sanke y diagram s howing t he devel opment o f green hydro gen pro jects anno unced for 2022 in terms o f added electrolysis capa city . In 2021 , added ca pacity in 2 022 was e xpected t o be 3.1 9 GW. This w as revis ed downwa rd to 1.55 GW in 2022. In 2023, it became clea r that only 0.15 GW of new capa city had bee n inst alled in 20 22 . This re sults in a gre en hyd rogen imple mentatio n gap of mor e than 3 GW in 2022 . b-c, Percentage r ates of succ ess, delay and disa ppearance of green hydro gen projec ts announc ed to lau nch in 202 2 , c ompari ng expec tations in 2021 wit h the fin al outco me (b) , and c omparin g expectat ion s in 2022 with the fi nal outcome (c). In both b and c, t he le ft panel s hows the to tal sha re, while t he right p anel sho ws the di saggregati on by stat us. The wi dth of the bars in t he right panel co rresponds to the shar e of tot al capaci t y (also compare wi th a) . Wit hin each colour , i ndividual projec ts are s hown as segments , ordered by size . Although we do not investigat e the individual fact ors contrib uting to project delay and dis appearance , th ree main rea son s fo r t he poor performa nce of g reen h ydrog en proj ects stand out . First , cost estima tes fo r elect roly sers have sur ged recent ly d ue to rising equipme nt and financial costs following the recent inflatio n 1 . Emerging evidence suggests that only the mass - prod ucible electrolyser stack is se t for rapid cos t reductions due t o standardi s ation, e conomies of scale and automated production 17 . Howe ver, other comp onent s of t he elect roly sis sy stem su ch a s balance of pla nt, engin eering and co nstruction 22 , which constitute the larges t cost share already today, are ch aract erised by g reater de sign co mplexi ty and requi re more cu stomi sation 17 , making them l ess a menable t o cost red uctio ns 23 . Second, an alyst s have ob served a la ck of o fftak e agreem ents 18 , resulting in sub stantial overcapac ity of elec trol yser manufactu ring cap acity . This may be e xplained by a limited willingnes s - to - pay for costly gree n hydrogen . S witching to hydro gen typically entails end - u se in vestme nts that are o ften dif ficult to re verse (e .g. tr ansfo rming st eel production from a blas t furnace t o a direct reduction route, or switching fro m a diese l truck to a fu el - cell el ectric truck) , carrying the risk of lockin g into an expensiv e and potent ially scarce energy carrier or feedstock. T hird, bridging the s ubstantial c ost gap and reducing inve stment risks req uire s hydroge n - sp ecific supp ort policies and r egulation, e ven for count ries with ambitious carbon 5 pricing 24 . Ho wever, laggin g imp lementation of supp ort polic ies 1 and regula tory uncertain ty regarding green hydr ogen productio n standards in the EU and the US , although crucial to ensu re clima te bene fits 25, 26 , have ha mpered growth . What impl ications doe s the sobe ring track r ecord of pas t project anno unceme nts have f or the future of gree n hydrogen in ambitious cli mate chan ge mitigat ion scenarios ? To explore these ramificati ons, next we focus on t he mid - term horizon towards 2030. First, we pro vide an overvie w of electroly sis requirements in 1. 5°C scenarios, in troducing t he 2030 green hydrog en ambition gap. Second , we analyse the economic viability of surgin g project announce ments and e stimate subs idy volumes that w ould be required to rea lise all project s, leading t o the 2030 green hydroge n implement ation gap. The closing 2030 green hydr ogen am bition gap Comparing green hydrogen proje ct announceme nts and req uirement s in 1.5 °C scenario, we f ind that the green hydroge n ambiti on gap in 2030 ha s been gradually closing o ver th e past t hree years, although t his rema ins subject to s ubstantial unc ertaint y ( Figure 4). Th e closing ambitio n gap is the r esult of (i) a steadily gr owing project pip eline , and (ii) a d ecreasing ro le of green hydrogen in scenarios that have cons istently reporte d elect roly sis requ iremen ts in the p ast th ree yea rs. Figure 4: The closi ng green hydroge n ambiti on gap in 20 30 . a, El ectrol ysis capaci ty requirem ents f or 2030 i n 1.5°C s cenarios ( n=15), e xcluding one outlier scenario with 1700 GW in 2030 (see Extended D ata Fig ure 2 and Met hods ). Whi skers i ndicate the range of scenari os from 30 – 1016 GW, unde rlin ing th e high uncerta inty arou nd mid - term green h ydrogen de ployment . The box indicat es the uppe r and lo wer quartil e, spanni ng the inte rquarti le range (20 3 – 655 GW). The ho rizontal l ine insid e the bo x indicat es the medi an at 35 0 GW. Each dot repres ents o ne scenario . Red dots indicate t he IEA N et - Zero Emissio ns by 2050 (N ZE) scen arios , which are t he focus o f panel b. b, Electr olysis capa city requirements in the IEA NZE scen arios and the project pipel ine for 2030 by year of e xpect ation . Of all sce narios sho wn in panel a , only th e NZE sc enarios provide annuall y updated electro lysis c apacity in 20 30 over t he past t hree years, allowin g us to analyse t he chan ging ro le of green hydrogen i n 1.5°C scenarios o ver time. The x - ax is shows the year o f expectat ion, co rrespo nding to t he year of pu blicati on of bot h the NZE sc enarios an d the Hydrog en Projec ts Databas e (see Method s ). Indi vidual pro jects ar e sho wn as seg ments within the coloured bars. Two trends emerg e. First, the projec t pipeline f or 2030 has incr eased thre e - fold in t he past three years. Seco nd, the NZ E scenario s show a dec reasing role o f green hydr ogen by 2030 i n the pas t three ye ars. To gether, t hese two t rends hav e been g radually cl osing the green hydroge n ambitio n gap in 2030 , whic h we define as the diff erence between scenario r equireme nts and pro ject announcem ents. Howe ver, mo re than 97 % of anno unced proj ect c apacity in 2030 are not ye t backed b y a final i nvestm ent decisi on (FID) . Requi red lev els of gr een hy drogen vary widely b etween diff erent 1.5 °C scen ario s, in lin e with previo us res earch 27 ( Figu re 4 a) . For 2030, this lack of con sensus leads to an enormous ran ge of 30 – 1016 GW of electroly sis capacity (excluding one ou tlier with 1700 GW), with a median of 3 50 GW and a n interquart ile range of 203 – 655 GW . This h eterog eneity is th e result of two key uncertai nties. Firs t, the upscaling of the nascent gree n hydrogen value chain from supply v ia infrastruc ture to demand is characte rised by high unc ertainty 28 , which is exacerba ted by the observation that project announceme nts have so far been a poor indicato r of growth. This makes it difficult to carve out ambitiou s, yet feasible, mid - t erm pa thway s for the ma rket ramp - up of gree n hydrogen. Second, although evi dence shows that hydroge n and hydrogen - based electr ofuel s are pr omisin g for decarboni sing end - use applications such as ma ritime shippi ng 29 , aviation 30 , and steel 31 , the competitio n with alternat ive mitigation options s uch as dire ct electrificat ion, biofuels or carbon capture a nd storage has not been ful ly settled and re mains subject to 6 uncertai nty 32 – 34 . This structural unce rtainty about c ompeting m itigation opti ons also pe rsists in the long run and expl ains the high heterogeneit y until 2050 ( Extended Data Fig ure 2 ). Howe ver , despit e the high h eterog eneity of gree n hydrogen in 1.5°C scenarios , we can i dentify an im portant trend in a subset o f the scen ario s : The IEA Net Ze ro Emissions b y 2050 (NZE) scenarios , which have consistently re ported values o ver th e pa st three years 35 – 37 , indicate a ste ady downward rev ision of requi red electro lysis in 2030 ( Figure 4b ). This i s dri ven by an adjus tment to reality follo wing recen t setb acks o f green hydro gen as well as by fast progr ess of competing mitiga tion option s, particula rly a d eep electrification of both passe n ger and truck transpor t as wel l as industrial and residential heat 37 . At th e same ti me , the 2030 gr een hydrogen pr oject pipel ine has alm o st tr ipled from 153 G W to 441 GW, surpassing the req uire ments for 1.5°C i n 10 o ut of 1 5 scenarios ( Figure 4a- b) . Thus, the gr een hydroge n ambition g ap in 2030 has already c losed for tw o thirds of the assess ed scenario s , while it will likely also clos e for t he NZE scenarios in 2024 . Although th e conver gence o f t he proj ect announce ments a nd scenario re quirements is e ncouraging, th e past green hydrogen implementati on gap in 2022 and 2023 ca sts doubt on the reliabili ty of ever - increasing proje ct announcem ents . Of th e 441 GW announced by 2030, 97% are st ill in the conce pt or feasibil ity study phase , which have exhibit ed critically insuf ficient su cces s rate s of 0% in 2022 and 1% in 2023 ( see prev ious sec tion ). Ac hieving the level of a mbition requ ired in 1.5°C scenario s hinges on overco ming th ese high fa ilur e rates. Yet, how much policy support would be requi red to realise a ll proj ect announcement s? Estimating the 2030 g reen hydro gen imple mentation ga p The f lipside of the c losing green hydroge n ambition gap is the wide ning fu ture g reen hydrogen im plementation gap in 2030 , whic h we defin e as th e dif feren ce between proj ect announcements and projects that ar e supporte d by policies . In th is sect ion we take gree n hydrogen proje ct announcements for grant ed and estimat e how much poli cy support would be requ ired to reali se all 441 GW by 2030. A crucia l prereq uisite for proje ct realisation is cost parity with fos sil fuels – bu t which fossil fu els exact ly? Natural gas is the mo st imp ortan t compet itor for green hyd rogen across vario us end - use a pplicatio ns. T his is illust rated by t he IEA NZE scenario, where hydrogen rep laces natural gas and natural gas - based grey hydroge n in rou ghly 90% of all hydrogen applicat ions in 2030 37 . In industry , hydrogen compe tes with natural gas as a feeds tock for ammonia productio n , as a reduction agent in s teel production onc e a steel p lant ha s s witc hed to a direct reduc tion route , and as a fuel for process heat 31 . Within the power sect or, hydr ogen can provide dispat chable power and long - term energy s torage in future hig hly rene wable p ower system s 8 and therefore d irectly compet es with future natural gas power plants with c arbon capture and storage . Hydrogen also compe tes with natu ral gas in terms of infrast ructure as many c ountries are currently envis aging to repurpos e parts of t h eir existing gas g rid to transpo rt hydrogen 38 . In addition , hydrogen com petes w ith petroleum o il products in r oad transport , but fa ces stiff c ompetit ion with electric vehicle s 39 and increasingly also electric trucks 40,41 . In m aritime s hipping 29 and aviation 30 , hydrogen - ba sed el ectrofu els are important m itiga tion opti ons, particu larly when the pot ential for fossil ca rbon capt ure and utilisat ion (CCU) and direct - air carbon capture and s torage (DACCS) is li mited 33 . Howe ver, t hese elect rofu els entail chal lenges 42 and will only become r elevant at scale as t he world appro aches climate neutrality , a horizon beyond our mid - term f ocu s until 2030 . In the build ings sector, cost - optimal scenarios see no ro le for hydrog en in providin g low - temper ature heating as heat pumps are more efficient and henc e more economica l 43, 44 . In summary, natural gas is th e mos t impor tant c ompetito r in en d - use applic ations, where hy droge n is expect ed to play a substantial role already in the nex t deca de. The refor e, we us e natural gas as a proxy for the competition betwee n green hydrog en and foss il fuels (see Ta ble 1 for p aramet ers) Note th at we co mpa re natural g as and hydroge n based on their lower heatin g value, with out distingu ishing differ ent end - u se applicat ions (se e Limita tions in the Me thods ). 7 Table 1 : P arameter s for esti mati ng the cost gap betwe en green h ydrogen and nat ural gas. The resul ting cos t gap for th e central estimat e is shown i n Figure 5a-b . The scena rio range co lumn dis plays par ameter v alues cov ered by the se nsitivit y scenario s (pro gressive and conse rvative , see Exte nded Data F igure 6 , Ex tended D ata Figure 7 and Met hods ). A n empty cel l in the sc enario ra nge colum n indicat es that th e cent ral estimate also ap plies for the se nsitivity scenarios. We use a payb ack peri od of 15 ye ars, whi ch is oft en shorter than the e xpec ted el ectrolyser lifet ime, but rep resents t he typic al length o f implem ented po licy suppo rt and is t herefor e more rel evant for i nvestm ent decis ion s . Dis played numbers are rounded. All curre ncy val ues are in 2 023 US $. Energy ca rrier Paramet er Centr al estim ate Scenario range Unit So urce /Com me nt Gree n hydrogen Electrolyser inv estment costs 2023: 1850 2024 – 2030: Tech. learning driven by project announ cements 2030 – 2045: Tech. learn ing driven by median 1. 5°C scenario 1700 – 2 000 $/kW(el) IEA (2023) 1 , see Methods f or details o f technological learning Stack share o f electrolyser investment costs 2023: 25 From 202 4: Tech. learning 14 – 29 % Ramboll (20 23) 17 Learning rate: S tack 18 15 – 20 % IEA (2023) 1 Learning rate: Bala nce of plan t 10 5 – 12 % IEA (2023) 1 Stack lif etime 2024: 10 From 2030: 15 10 – 15 yr EPRI (2022) 45 , IRENA (2020) 46 Electrolyser payba ck peri od 15 yr Hydrogen E urope (2023) 47 , typical value fo r policy suppo rt such a s auctions Full - load hou rs 3750 3250 – 4250 h/yr Zeyen et al. (20 24) 25 , hourly matching w ith renewables Cost of cap ital 8 6 – 10 % IEA (2023) 1 Electrolyser e fficiency 2024: 69 2045: 76 % IEA (2023) 1 , increase of approx. 0.3 pp per year Fixed operation and maintenance costs 3 1.5 – 5 % Agora Industry and Umlaut (2023) 22 Transport and storag e costs 20 $/MWh Generic value based on refs 1,24,48 (see Methods ) Electricity pr ice 2024: 60 2030: 50 2045: 3 5 2024: 49 – 104 2030: 35 – 85 2045: 22 – 55 $/MWh Ueckerdt et al. (20 24) 24 , not only covering renew able LCOE, but also system costs (e.g . grid costs, see Methods ) Natural gas Gas price 2024: 19 2030: 22 $/MWh Average of EU T TF and US Henry Hub spot market and future prices (see Methods ) CO 2 price Sc en ario 1 : No CO 2 price Sc en ario 2 : EU clim ate target compatibl e (2024: 117, 2030: 149, 2035: 192, 204 0: 246, 2045: 316) Sc en ario 2 : ± 20% of central estimate $/tCO 2 Sitarz et a l. ( 2024 ) 49 (see Methods ) Emission intensity 0.265 tCO 2 /MWh Ueckerdt et al. (2024) 24 , incl. upstream emissions The co mpetiti venes s anal ysis reveals a subs tantial and prolonge d cost gap betwee n green hydrogen and natural gas ( Fi gure 5a- b), defined as the d ifferenc e bet ween t he levelis ed cost o f hydr ogen ( LCOH) and the pr ice of natural gas (see Methods and Table 1 ). Without carbon pricin g, the cost gap of 160 $/MWh in 2024 implie s that green hydrogen is initially mor e than 8 time s as expensive as natural gas. By 2030, this c ost gap decrea ses to 1 0 7 $/MW h, but persist s at 70 $/MWh in 2045 ( Figure 5 a). U nder an ambi tious carbon p rice pathway in line with EU climat e targets 49 , the cost gap of 129 $/MWh in 202 4 is narrower , but gree n hydrogen is still 3.5 t imes as e xpensi ve as natural gas. However, th is cost gap steadily diminishes to 68 $/MWh by 2030, reaching cost parity in 2043 ( Fi gure 5 b). Thus , in the abse nce of carbon pric ing, gree n hydrogen is expe cted to remain m ore expensive than its mai n compet itor natural gas u ntil wel l after 20 45. Even with ambitio us carbon pri cing, th e cost gap persists fo r almost t wo decad es in our cen tral est imate . Sustained support poli cies are therefore ine vitable to fos ter green hydrog en growt h . 8 Figure 5 : The green hyd rogen i mplem entation ga p in 2030 . a - b, Cost gap bet ween the leveli sed cost of green hyd rogen (LCOH) and t he price of natural gas with out carbo n pricin g (a) and wit h carbon pricin g (b) fo r the central parame ter estim ate (see Methods ). The red do uble - head ed arrows a nd the li ght red sh ading i ndicate the cost gap that nee ds to be bridged by subsidi es. The s tacked ba rs indicat e the dec omposi tion of the LCOH and th e total cost of natura l gas for selected years (2024, 2030, 2035, 2040, 2045 ). For bet ter visibility , the LCOH b ar is slightly shifted to the lef t, and the natural gas bar to the right. Our 2030 LCOH estimates are in line with recen t studies ( see Ext ended Data F igure 5). c- d, Requir ed subsidi es to bri dge the c ost gap wit hout car bon pric ing (c) an d with ca rbon pric ing (d) in o rder to re alise all projec t announc ements until 2030 on time (see Meth ods ). The bars show required an nual subsidies (lef t axis), while th e lines show req uired cum ulative subsidi es (right axis) . e, Require d cumulat ive sub sidies to reali se all proj ects annou nced unti l 2030 (wi thout and with carbo n prici ng) in com parison t o glo bal ly announc ed hydrogen s ubsidies as of September 2023 from Bloomb erg NEF (BNE F) 50 . When cal culatin g subsidies , we take current ly implem ented demand - side policies, which reduce pressur e on supply - side sub sidies, into account (see Methods and Extended D ata Figure 3 ). Witho ut carbon pricing , $1.6 tri llion o f subsidies are require d to real ise all pro jects announce d until 20 30. We explo re the impact of m ore progr essive and mo re conser vative parameters fo r green hy drogen in Extended D ata Fig ure 6 and Ex tended D ata Figure 7 , resp ectively (see col umn scen ario range in Table 1). Note that c - e onl y show subs idies req uired fo r green hydroge n project a nnounceme nts unti l 2030 . Staying on a 1.5°C scen ario requires substant ial further subsidies a fter 2030 , whic h, without carbon pri cing, wo uld nee d to be per manent (see Extend ed Data F igure 8 ). The main contrib utors to the LCOH are electricity co sts , electrolyse r investme nt, and transport and s torage c osts ( Figu re 5a- b). Although i nvestment costs of elec trolysers have recently s urged due to hig her equipm ent and financ ing costs 1,17 , this tr end is expec ted to reverse soo n due to learning - by - doing and economies of scale. Note again, that in o rder to estima te t he vo lume of require d subsidies we consider a scenario where all project announcem ents until 2030 a re real ised on time, while a fter 2030 cost reducti ons are driven by the median electroly sis capacit y in 1.5°C sc enarios (see Metho d s and Exte nded Data Figure 3 ). As a conse quence, electro lyser in vestm ent cost s fall quickly , especially for th e electroly ser stack, which can be mass - produced in automated factor ies 17 , while the balance of pl ant requir es more cus tomisation and i s thus le ss amenabl e to rapid cos t reductions 23 . I n ou r centra l estimat e, elect roly ser invest ment c osts d rop from 1850 $/kW in 202 3, to 701 $/kW in 203 0 , and to 493 $/kW in 2045 ( Extende d Data Figure 4). We c alculate the LCOH wi th a payback period of 1 5 years. Although this is shorter than the expe cted electrol yser l ifeti me, it r epre sents t he typ ical l ength o f impl emente d policy support such as auctions 47 and i s ther efore mo re 9 relevan t fo r in vestment d ecisions th an the technica l lifetim e. O ur 20 30 L COHs are consistent with r ecent studie s ( Ex tended Data Figure 5 ). The c ost gap betwee n green hydrogen and n atural ga s is robust a cross a wide r ange of progr essive an d conser vativ e pa rameter valu es , especially in scenario s without carbon pri cing. In these scenarios , green hydrog en always rema ins mo re expe nsive t han natura l gas until aft er 2045 , though the size of t he co st gap varies ( Extende d Data Figure 6 a, Extended D ata Figure 7a ). In scenario s with carbon pricing, co st parity is eventua lly achiev ed , but the timing is uncerta in. With pro gressive p ara meter s , cost p arity cou ld be reached as early a s 203 4 ( Extended Data F igure 6 b), whe reas with conser vativ e param eter s, this may not occur until well aft er 2045 ( Exten d ed Data Figu re 7 b). Thi s underline s the conside rable uncer tainty about when g reen hyd rogen wi ll become co st - compet itive solely due to carb on pricing, highlighting t he need fo r suitable policy instruments to reduce invest ment risk s. Bridging the co st gap between gree n hydrogen and natural gas re quires subst antial subsidies , or equivalent regulation , for several decad es. To recover the ir costs, gr een hydrogen pr ojects must se ll hydrogen at t heir r espe ctive LCOH thr oughout the payback period . A ssuming that the willin gness - to - pay f or green hydroge n mat ches that of natural gas , th e co st gap determ ines the specific per -MWh hydrogen subsi d y a project require s. H ydrogen suppliers could secure such polic y support through pay - as - bi d revers e aucti ons for a fixed p remiu m paid upon delivery. In order to es timate annually r equired subs idies, we multi ply the spec ific hydrogen s ubsidies with t he announced new gr een hydrogen capac ity (Extended D ata Figure 3 a) . We also acc ount for currently imple mented d emand - side policie s that support gre en hydrogen c apacity without requiring addi tional s ubsid ies (se e Methods ). Annual subs idies r equired to reali se all pro ject s by 2030 a re bell - shape d , which resul ts from the payback period, with the height and timing o f the p eak varying by scenario ( Figure 5c-d , left axis ). Without carbon pr icing, requi red annual subs idies r ise sharply to a plateau of mor e than $ 100 billion per y ear throughout the 203 0s ( Figure 5 c) . With carb on pricing, requi red annual subsidi es peak at $ 71 billio n per year in 2030 ( Figur e 5 d) . The resulting cumulative subsidi es to realise all 441 GW of gree n hydrogen proje cts by 2030 are S- shaped ( Figure 5c- d, right ax is) . Without carbon pricing, required cumulative subsidies amount to $ 1.6 tr illion ($1. 2 – 2.6 trillion ra nge, Extende d Data Figure 6c , Extended Dat a Figur e 7c ). With carbon pricing , require d cumulative subs idies are stil l $ 0.9 trillion ( $0. 3 – 2.1 t rillion ran ge, Extended D ata Figure 6d , Extende d Data Figure 7d ). While already subs tantial , th ese figu res only pertain to the 2030 project pipeline. Align ing green hydrogen wi th 1.5°C scenarios after 2 030 , would r equire considerabl y higher subsidies . Wi thout carb o n pricing, the cost gap does not close by 2045, leadin g to cumulative subsidies of $6. 3 trillion by 2045 ($4.4 – 10.8 trillion ra nge, Extended D ata Figure 8 ), fur ther rising after wards . Thi s sho ws tha t pe rmanently subsid ising green hydrogen again st cheap fossil fuels will likely be prohi bitively expens ive in the lo ng term, highlighti ng the key role of carb on pricing in closing the imp lementati on gap . Due to a s ubstantial disc repancy between r equired and announced s ubsidies, a wi de 20 30 green hydroge n implementation gap arise s ( Figur e 5 e) . Cumu lati ve su bsidi es required to realis e all pro ject an noun cements by 2030 exceed currently a nnounced subsi die s, esti mated a t $30 8 billion as of Septemb er 2023 50 , by a factor of three wi th carbon pri cing and five without . There ar e co unteract ing uncertaint ies regardin g this estimate , as announced subsidies are likely to i ncrease in t he future, but c hallenges may aris e during the ir implementati on (see Methods ). E ven if all cu rrently announced gl obal subs idies were immed iat ely available , without c arbon pricing this would only support 56 GW b y 2030 ( 34 – 72 GW rang e , 8 – 16 % of th e proj ect pipel ine, see Extended Data Figure 9 ). Th is is outwei ghed by the im pa ct of already - imp lemented dem and - side p olicies in almost all scenario s , underlining the imp ortan ce of demand - side regulation for fo stering gr een hydrogen g rowt h. Discussi on and co nclusion The pas t and future of green hydrog en is charac terise d by three gaps , reflecting the ch allenges of scaling - up a no vel and yet uncompetiti ve ener gy ca rrier that require s dedicat ed policy support . First, th e 2022 implementation gap shows that on ly 2% of announced green hydroge n capacity was rea lised o n time . Second, the 2 030 ambition gap has gradually close d , as th e pr oject pipeline and requ irements in 1.5°C scenarios incr easingly co nverge . Third h owever, t his has led to a wide 2030 i mple mentati on 10 gap as enormous subsid ies would be requ ired to r ealise all p roject s by 2030 – and even more to put gree n hydrogen on tr ack for 1.5°C in the lon g term . The very high p ast failure rat es ind icate a limi ted reliab ility of p roject announc ements publis hed by industry, especially for projects without a final inve stment decision . Although s obering , this can provide valuable ins ights for realistic scale - up analyses of hydrogen 28 and other low - carbon ene rgy technolog ies in the feasib ility literat ure 51 – 54 , e specially for analyses that u se uncer tain project announcement s as a data input 55,56 . System planners , policymak ers and socie ty should interpr et the in creasingl y steep growth sugg este d by recent pr oject announce ments (refer t o Figure 1 ) with ca ution , wh ile focusin g on scal e - up challe nges such as lacking comp etitivene ss and the n eed for policy support . To clos e the gr een hydrogen impleme ntation gap, poli cymakers need to brid ge the cost gap to foss il fuels and de - risk hydrogen inve stmen t s. This requi res a balanced pol icy mix and a r obust str ategy to navi gate the fo llowi ng key uncertainties a nd risks : 1. Prolong ed green hydrogen s carcity. The huge past and future i mplementation gaps indicate that g reen hydrogen will lik ely fall sho rt of th e requir ements in 1.5°C pathways. Even if polic y support is strengthened , it remains uncerta in whether t his is s ufficient to dr ive the ne cessary hydro gen invest ment s. Realising curr ent projec t announcem ents would r eq uire unprece dented growth rates , exce eding even t he fast est - gr owing en ergy technologie s in history , solar photov oltaics . Given that gre en hydrogen te chnologie s ar e mo re compl ex , less standardis able and require new inf rastructure , a ll of which slow down technology d iffusion 23 , realising such unpre cedented gro wth is unlike ly. 2. High p olicy cos ts. Current hydrogen polic y instruments often seek to s pur hydrogen inves tments by bridg ing the cost gap to fos sil fuels through supply - side subsidies s uch as fixed - premiu m aucti ons. Howe ver , as we h ave shown , th is approach requi res not only exc essiv e su bsidy volu mes, b ut al so stro ng p ersevera nce as policy support could be requir ed for s everal decade s, or even pe rmanently without ca rbon pricing or strong demand - side regulation . T he narrative of ki ckstarting a “hydrogen e conomy” with only a short - ter m policy pu sh , after which gre en hydrog en become s co st - co mpetiti ve and sca les up on i ts own , i s likely misleading and raises fal se hop es . 3. Uncertai n long - term r ole. H ydro gen ’s primary role in climate change mitigat ion is to rep lace fos sil fuels i n hard - to - electri fy sector s . However, strong p olitical supp ort for hydrogen is often a cc ompanie d by overco nfidence i n its potenti al 15 , resultin g in confl icting visi ons about hydroge n’s future r ole. Many globa l climate change mi tigation scenar ios sh ow a modest long - term s hare of hydro gen in final en ergy of 5 -15 % 2,37, 57 , focusin g on key en d - uses where hydroge n is highly valuable due to a lack of alter natives 5 . In stark contrast, i ncumbent actor s from gas , heat, industry a nd transport t end to endorse a wid e use of hydroge n acr oss secto rs 58 , even in end - use s lik e re sidential hea t , wher e el ectrifi cati on is chea per, mor e effic ient a nd readily available 37,2,5 7,43 . Uncerta inties remai n around hydrogen’s role in compl ementi ng electri ficat ion of h eavy trans port and industri al heat 11,32,37 . Disregardin g the se uncertaintie s and risks , and instead f ocusing on supply - side subsidi es with the exp ectation of abundant low - cost gr een hydrogen in the fu ture , risks crowding out available and more economical options , thereby delay ing climate change mitigation. To minimise these risks while safeguardin g the scale - up of green hydroge n, we draw two ke y policy concl usions. First , supply side s ubsidies , which reduce th e invest ment ri sk of electr olysi s project s, sh ould be complemen ted by deman d - sid e policies that gui de hydroge n to i ts most valuable use cases by increasin g their willingness - to - pay. The benefit of deman d - sid e measu res i s illustrate d by the Europe an Hydrogen Bank’s r ecent inaug ural auction , which resulted in surprisingly low succes sful bids of 0.37 – 0.48 €/kg 59 , comp ared to a similar a uction in the UK , which only received h igh bids equivale nt to 9.40 €/kg 60 . A side from regio nal h eterogen eity, this star k differ ence can be attri buted to the EU ’s dema nd - side quotas , such as the mand atory 42% gree n hydrogen shar e in industry by 203 0 under the Renewa ble En ergy Dir ecti ve III 61 , and manda tes for hydrogen - based electro fuel s under ReFu elEU Aviation 62 and FuelEU maritim e 63 regulation s. Complem entary d emand - side policies can thu s reduc e the pressure on s upply - side su bsidies, helping to cl ose the imple mentation ga p. 11 Second, policym akers should plan the transition f rom sub s idies to ma rket mecha nism s. I n the s hort run, achievi ng strong near - term hydrogen growth is crucial to k eep 1.5°C scenario s within reach . This requires str on g poli cies su ch as su bsid ies t o directly bridge the cost gap , minimise investm ent risks and initialise a hydrogen market . However, as hyd rogen t echnol ogies and markets mature , policy support should shift to market - based mechanism s in order to (i) reduce p olicy costs, (ii) reveal th e full hydr ogen costs to markets and consumers, and (iii) create a level play ing field wit h other miti gation o ptions. The mo st - important technology - neutral s trategy is ambi tious carbon prici ng . However, as carb on prices ar e currently too low and too uncertain in the fut ure , comple mentar y ins truments are required to de -r isk the remainin g uncertainties. These inclu de technology - neutral aucti ons of carbon contracts - for - diffe rence 64 , which he dge inves tors against unpr edictable pr ices by covering th e differenc e bet ween emission s ab atement co sts a nd ca rbon pri ces , as well as trad able , technology - neutral quotas for e .g. low - carbon mate rials , foster ing gre en lead market s. In summ ary, a co mprehensive po licy strategy for green hydroge n should include targeted dem and - side measures a nd a gradual transit ion from s ub sidi es to market mechanisms. In the short term , this woul d de - risk early investment at m anage able costs , guiding hydr ogen to its m ost valua ble use cases . In the long t erm, this would tr ansfer i nvest ment r isks and compet itio n between hydrogen and o ther mitig ation options to t he market, t hereby establishing a credib le co mmitmen t for cli mate change mitigation while spurri ng green hydrog en gr owth . Methods Overview Our approach is split into three parts. First, we tra ck green hydroge n project announce ments to quantif y the gree n hydrogen implementati on gap in 2022 a nd 2023. Seco nd, we compare project announcem ents with 1.5 °C scenar ios t o show th e 2030 gree n hydrogen ambit ion gap. Third, we conduct a competitiveness an alysis of green hydro gen and its main compet itor natural gas in o rder to estimat e require d annual and cumulati ve subs idies, leading to the 2030 green hydrog en impleme ntation gap. Green hydroge n project dat abase We use data of electro lysis p roj ect ann ouncemen ts fro m the IE A Hydroge n Production Pr ojects and I nfrastruc ture Database 65 , incorpora ting three databa se snaps hot s from 202 1, 2022 and 2023 . We only include pr oject announcem ents for el ectro lysers that includ e a year of proje ct launch , ha ve a meaningful s tatus (not “Other” or “Other/Unknown”), and report a capacity valu e . We do n ot filter for the t ype of ele ctrici ty as this is o ften unknown. These crit eria lea d to 611 project s in the 2021 snapshot, 879 project s in the 2022 s napshot , and 1296 projects in the 2023 snapsho t. In the 2023 snap shot , the status categ ories “FID” and “Under C onstruction” w ere merged into a singl e category “FID/Co nstructio n”. In order t o ensure consist ent stat us cate gories acro ss all sn apsh ots, we also merg e these ca tegor ies in th e 2021 and 2022 snapshot . Projects with a “DEMO” status are allocated as “O perational”, “FID/Construc tion” or “Decommissio ned”, depending on whether they ar e still r unning, announced for th e future , o r have be en deco mmi ssioned , re spectively . Confi dential proje cts are dis tributed to all regions in proportion to the sha re of cap acity fr om no n - confidential project s, but cannot be tracked acros s database snapshots. Following the I EA’s Creati ve Commo ns (C C) licen se, we no te that this is a work derived by us fr om IEA ma teria l and we a re solely liabl e and respon sible fo r this d erived work . The deri ved work is n ot endorsed by the IEA in any m anner. Tracking gree n hydrog en proj ect s E ach pro ject has a unique referen ce numb er that stays the same across al l database snapshots as confirme d by the IEA i n perso nal corresponde nce . This enables us to track the devel opmen t of project announc ements o ver time ( Figure 3 and Extended Data Figure 1 ). W e account fo r changin g capacity of p rojects betwee n two database snapshots by adding dummy projec ts. Howe ver, for simplicit y these are n ot exp licitly shown , but rema in vi sibl e as mino r dif fere nces bet ween st ock s and flows in the Sankey diagram s. The reported rates of disappe arance, delay and s uccess ( Figu re 3b- c and Extende d Data Figure 1b- c) o nly r efer to projects as expect ed in 202 1 and 2022 , respecti vely . 12 Green hydrog en in 1.5° C scenario s As an indicator of green hydrog en requirem ents in stringen t climate miti gation scenar ios, w e coll ect electrolysi s capacity from a wide ran ge of 1. 5°C scenarios (see Extended Data Fig ure 2 ). Due to limited reportin g of numerica l data in text or tables, in some case s we resort to extracting data from graphics using W ebPlot Digitizer , whi ch has been show n t o be reliable 66 . All da ta sources are clear ly stat ed in t he file s provide d o n Git Hu b. If scenario s do not report electrolysi s capacity , we convert production quantitie s into corre sponding electroly sis capacity, assumin g 3, 75 0 full - load hours, 69 % efficienc y , and the low er heating val ue of hydroge n , 33.33 kWh /kg. Du e to these ap proximations , r eported electrolysi s requiremen ts in 1.5°C scena rios are ass ociated with uncerta inties . In Fi gure 4 , we fo cus o n the N et Zero E missio n s by 2050 Scena rios of the IEA 35 – 37 , which is the only scenario that has reported electroly sis capacit y annually in the past three years and therefore enable s us to track the closing gr een hydrogen ambition gap in 2030 over time. Levelised co st of hydroge n To gauge the eco nomic viabilit y of steep ly increa sing project announce ments , we conduct a simplified competitiven ess analy sis betwe en g reen hydroge n and its m ain competitor natural gas for three sc enario s ( cen tral , pro gressi ve, co nser vati ve), ea ch wit h and without a n ambitious c arbon price. All re quired para meters a re shown in Tab le 1 and mad e available on GitHub . Some para meter s ch ange ov er time, in wh ich case we use lin ear interpo latio n in between . For green hydr ogen, we calcul ate t he leveli sed co st of hy drogen (LCOH) fo r each year fro m 2024 , using the annui ty method and broadly fol lowing the system boundaries outlined in r ef 22 , but adding gene ric transpo rt and storage costs (see be low) . Omitting time indices, th e LCOH is calc ulated as LCOH = 1 ( ( , ) + ) FLH + ( ( , ) + ) FLH + + VOM ( 1 ) where denot es the elec troly ser ef ficien cy, ( , ) = ( ) the annuity f actor, the co st of capital, the payback pe riod of the en tire el ectroly ser in year s ( which c an be shorter than th e tech nical lifetim e) , the life time of the electro lyser stack in years , F OM the fixe d operation and m aintenance c osts as a p ercent age of the sp eci fic invest men t costs , the specific inve stmen t cost of th e electro lyser’ s balance of pl ant (BOP) and other en gineerin g work , the sp ecific in vestmen t co st of the elect roly ser stack, FLH the fu ll - load hours , the electricit y price, and V OM the variabl e operation and mai ntenance costs , which are gen eric trans port and storage costs. We use a g eneric value for thes e tran sport a nd stor age cost s ( see Ta ble 1), based on literature va lues . In the sh ort ter m, we assum e tha t stor age co sts f or expens ive steel tanks and battery storage dominate , while i n the lo ng term hydrogen could be trad ed over long dist ances such that costs for transport ( 0.5 $/kg fo r a 3000 km pipelin e 1 , equiv alent to 15 $/MWh) an d caver n storage (approximately 5 $/M Wh 48 ) dominate. While a recent study project s much hi gher leveli sed costs of s toring hydrogen in salt cavern s , equivalent to 22 – 58 $ /MWh 67 , these co uld be mitigate d as not all hydrog en will ne ed to be stored. Overal l and in agree ment with recent studies 24 , we summaris e all transpo rt and stor age costs into a generic valu e of 20 $/MWh . Note that transport via m aritime shi p ping o r further distri bution to refue lling statio ns for road trans port would be co stlier. The electricity p rice paid by electrolyse rs highly de pends on the spe cific supply ca se and the regul atory definition of green hydrogen w ith respe ct to sp atio - te mporal matchin g and add itionality 25,26 . Flex ible op erati on and a direct c onnection to a renewab le ener gy sou rce red uces the p ri ce a s electr olysers can tap into ho urs where electricity i s cheap and abundant . Grid - conn ected el ectroly sers need to pay grid f ees on top of electric ity prices , but can run at hi gher full - load hours. We acco unt for these effect s in an aggregat ed man ner by using t he same range of electricit y prices as in r ef 24 . We sep arate th e total specific invest ment s costs of t he elec trol yser , , in to the stack and the bal ance of plant . This has two reason s. Fir st, the sta ck o ften need s to be r eplaced earli er than the rest o f the ele ctrol yser, whic h is wh y we dis tinguish two annuiti es in equati on (1) 22 . Second , the stac k is much more g ranular and there fore more susceptible to undergo cost 13 improvemen ts through techn ological learnin g 17 . Technol ogical learnin g result s from eco nom ie s of scal e and mass production and reduc es specific inve stment costs of both and in yea r according to = ( ) ( 2 ) w here denotes globa l cumulati ve electrolysis capacit y in yea r t, denotes the learning r ate , defin ed as th e percen tage decrease of speci fic investme nt costs for each d oubling of cu mulative capacity. For the b ase yea r 2023 , we a ssume th at a ll remaining un certain project s are built o n time, resulting in = 1. 86 ( see Figu re 1). Techno logical learn ing is driven by cumulati ve project a nnouncements until 2030, and s ubsequently by the m edian 1.5° C scenario ( se e Extended D ata Figure 3 ). We use diff erent l earni ng rates for t he electro lyser stack a nd the BOP , leadi ng to th e invest men t costs shown in Extended Data Figure 4. Estimati ng requ ired s ubsidies We esti mate annual and c umulative subsidies that w ould be requir ed to realise all glo bal green h ydrogen project announcem ents by 2030 ( Figu re 5 , Extended Dat a Figure 6 and Extende d Data Figure 7) , and to con tinue on a median 1.5°C path way aft er 2030 ( Ext ended Data Figure 8) . To that e nd, w e co mpare th e LCOH with th e price of natu ral gas , green hydroge n’s main co mpetito r (se e main t ext ). W e estimat e the p rice of natural gas as the a verage o f the E U trad ing poi nt Title Tr ansfe r Facili ty (TTF) in t he Netherlands a nd the US trading point Henr y Hub , usin g spot market p rices in 2024 and future pri ces in 2030 . As of May 2024, t his lea ds to a gas p rice of 1 9 $/MWh in 20 24, rising to 22 $/M Wh in 2030, a fter which we assum e it to remai n constant. In the illustrative scenario with carbon p ricing, we con sider a CO 2 price pathwa y that is cons istent wi th meeting the EU climate t arget s for t he secto rs cover ed by the EU E mission s Tradi n g Sy stem (ET S) such as indus try and energy supply 49 . The CO 2 cost per MWh o f natural gas is the produc t of the em issions intensi ty, inclu ding up stream met hane e mission s 24 , and the carbon price per t on of CO 2 . We d eno te the total cost of natural gas as , which inclu des CO 2 co sts if ap plicable. This leads to a n instantane ous cost gap between gre en hydrogen and natur al gas in y ear t of = ( 3 ) which is depict ed in Figure 5a - b, Extende d Data Figure 6a- b, and Extended Data F igure 7a- b. A gre en hydrogen proje ct complete d in year must sell hydrogen at LCOH for th e duration of payback peri od to recov er its costs. Thus, In eac h year = [ , + [ , th e project re quires subs idies to bridge the cost gap to t he current gas price . Therefo re, requ ired annual s ubsidies a ccumulate over time due to projects built in prev ious years . F or exa mple, in 2026, p rojects that were built in 2024 face a cost gap of LC OH , projects tha t were built in 2025 fac e a cost gap of , and projects that were built in 2026 face a c o st gap of . The c ost gap has to be bridged for all new electrolysi s capacit y built in year , accounting for ca pacity tha t is alre ady supported by demand - s ide po licies, . With full - lo ad ho urs FLH, the elec troly ser effic iency , and the paybac k period , th e requir ed annual subsi dies in yea r t are: = { , } FLH max 0, LCOH ( 4 ) Thus, r ealisation of green hydrogen pr ojects buil t in requires s ubsidy payments for the full payba ck period = [ , + [ a s lo ng a s > . We now e xplain how we obta in . We cons ider that demand - sid e policies such as end - use quotas i ncrease the willingness - to - pay for hydrogen and thus r educe t he remaining cost gap and requir ed policy cos ts. We repres ent this mechanis m by accounting f or impleme nted demand - side measure s, estimate d at 7 Mt hydroge n per year in 20 30 according to r ef 1 , which we translate into s upported cumul ative electrolysis capa city in 2030 u sing the lower heat ing value ( LHV) of hydro gen, 33.33 kWh /kg, according t o: = 7 Mt / yr ( 5 ) 14 Distributing proportion ally to yearly capaci ty additio ns within the time fram e = [ 2024 , 2030 ] y ields , with = (see hatche d bars in Extende d Data Figure 3 a) . Thus, follows as = , ( 6 ) where deno tes new projec ts announced to launch i n year t. Whi le we focus on subsidies required fo r projec t annou ncements until 2030, in Extended D ata Figure 8 we extend our analysis be yond 2030 suc h that represen ts annua l capacity addit ions in line with th e median 1.5°C sce nario (see E xtend ed Data Figure 3) . Thus, equation (4) and (6) determin e th e an nual subsidi es , , require d to b uild , given that are already suppo rted by demand - side regulati on. Corres pondingly, the re quired cumulative s ubsidies pa yable until t are : = ( 7 ) To answe r how many s ubsidies will be required in tota l over the ful l payback period o f a proje ct, we have t o look years beyond the proje ct launch date. In Figure 5c- e, Extended D ata Figure 6c-e , and Extended Data Figure 7c- e, we ther efore fo cus o n cumulati ve subsidies required for proj ects announce d until 2030 , which due to a payba ck period o f 15 years i mply subsidy payments un til 2045. Limitations The data quality of the I EA Hydrogen P roduction and Infr astructure Projects Database 65 may be l imited . Thi s is particula rly important for th e project track ing , where s ingle project a nn ouncem ents can have a lar ge influence on the rates of project disappe arance , dela y and success ( see Figure 3 and Extended Data Fi gure 1 ). Du e to the high numbe r of projec t announcements , we did no t conduct additional market research and there fore also cannot correct inaccurate pr oject data . Furthe rmore, by their nature, confidential projects cannot be tracked acros s database snapshots. The data qu alit y of the electrolysis requir ements in 1.5° C scenarios i s limited due to hete rogenous sour ces and limited n umerical reporting of s cenario data accompanying the reports . In severa l cases we have to infer e lectrolysis capa city from green hydrogen production values . Thus, Figur e 4 and Extended Data F igure 2 only show publicly availab le data and should not be interpre ted as numerically exact . Estimating subsidies requires se veral simplification s to redu ce compl exity . Firs t, we do not disting uish betwee n regions or end - use applicatio ns when calcu lating t he cost gap between gre en hydro gen and its fossil comp etitors. This would s ubstantially increa se compl exity as we wo uld n eed to rep resent d iffere nt en d - use applicatio ns and assume th eir region - sp ecif ic uptake and shares in time. Instead we u se natu ral gas as th e main comp etit or , which is rep resenta tive for most u se cas es of green hydroge n in industr y and energy s upply . The cos t compariso n is based on the low er heating value, which is a valid assumption for industri al process he at or power g enerat ion, wh ile fo r ammonia or DRI (dir ect reduced iron) production , gre en hydroge n can be used slightly more eff iciently than natural gas . We als o neglect addit ional costs associated with hydrog en on the end - u se si de. This simplifica tion has a low i mpa ct on our results as additional costs are typicall y low or even zero. Some applications can simpl y substitute gr ey with gree n hydrogen wit h no additional cos ts (e.g. ammonia production) , while additiona l investment costs in other ap plications are low compared with fossil applica tions (e.g. DRI - base d steel plants or hydrogen boile rs). Second, con cerning specifi c investment co sts, we do not in clude a feedback fro m policy - supported deployme nt and associated technologica l learning , but instead ass ume that all p roj ect announceme nts are built on time . Third, we use the annuity m ethod inste ad of a discount ed cash flow analys is to calculat e LCOHs , negle cting the i mpact of future change s in cost com ponents , which is particu larly relevant f or electricity . However , many gree n hydrogen proje cts will r equir e new dedi cated renewa ble energy plants or long - ter m con tracted power - pu rchas e agree ments , makin g constant electricit y prices over the pa yback p eriod a valid simplifi cation . Fourth, we of cou rse have to caref ully cho ose values f or all para mete rs presen ted in Ta ble 1, which 15 inevitably involves uncer tainties . To analyse the i mpact of th ese uncerta inties, w e conduc t two sen sitivi ty an aly ses tha t exp lore a wide ra nge of p rogres sive a nd co nservati ve param eter se ttin gs ( see Extended Dat a Figure 6 and Extended D ata Figure 7). We also compare our LCOH in 203 0 to recent literatu re val ues ( Extended Dat a Figure 5) . Fifth, we d o not consider the option that gree n hydrogen proje cts could pay back a part of rec eived subs idies once t hey a re pro fita ble relat ive to natural ga s in the future becaus e ( i) this would requi re a contract - for - d ifferen ces that allows for this option and ( ii) mos t projects do not become compet itive wit hin the time horizon we an alyse . Six th , we do not include factors other than costs that influence t he re alisation of a project. In reality , pro ject reali sation d epen d s o n a plethora of highly context - specific d ecision factors beyond pure economic viabilit y, which is beyond the scope of t his work . Sevent h, we as sume that demand - side m easur es translate into electrolysis capa city witho ut requ irement s for additional su bsidi es. Additional dem and - side measur es such as an i ncrease in end - use hydroge n quotas could furthe r reduce the need for subsi dies and thus decrease t he imp lem entation gap i n the future . For simp licity , we al so assu me tha t all dema nd fro m end - use quotas is supplied by g reen hydrogen. Last ly, the data quality of global announc ed hydrogen subsid ies fro m Bloo mbergN EF (BN EF) may b e limite d. The subsidy estima te for the United States is particularly uncertain a s the production tax cr edits of the Inflation Reduction Act 12 are uncapped . Therefore, BNEF es timate s US subsi dy announcements based on projec t announceme nts , which implies uncertaint ies. Furthe rmore, tracked s ubsidies cov er not only gre en hydrogen, but al so other sources of low - carbon hydroge n, wh ich we opt imistically com pare to subsidy r equirements required only f or green hydro gen project announcements . T he global subsi dy volume of $ 308 b illion for low - carbon hydrog en as o f Septemb er 2023 there fore on ly serves a s a snapshot. While we acknowledge t hat this va lue will soon be outdate d, it still provide s a useful indica tion . Ne verthel ess, it should be int erpret ed with cautio n as implement ed subsidies critical ly depend on govern ments’ futu re commi tment t o fost er the hydroge n market ramp - up . Data availability All data is pu blicly available o n GitHu b (see Cod e availability ). This includes the IEA Hydrogen Produc tion and Infras tructure Projects D atabase from 202 1 to 2023 65 , electrolysi s requirements in 1.5°C scenario s fro m var ious so urc es , techno - ec on omic data for th e competit iven ess ana lysis ( se e Tabl e 1) , data o f announced hydr ogen subsidi e s by Blo ombergN EF 50 , and LCOH val ues in rece nt studies. All data files inclu de a column th at indicates th e original source. Code a vailability The R mod el cod e , includin g all data, to perf orm the analys es and re produce all figures i s available on GitH ub : https://githu b.com/aoden weller/green - hydrogen - gap References 1. IEA. Global Hydrogen Revi ew 2023 . https://www.i ea.org/rep orts/global - hydrogen - rev iew - 2023 (2023). 2. IRENA. W orld Energy Transitio ns Outlook 2023: 1.5°C Pat hway . https://www. irena.org /Publication s/2023/Jun/Wo rld - Energ y - Transition s - Outlook - 2023 (2023). 3. Energy System s. in Climate Change 2022 - Mitigation of Climate Change: Working Group III C ontribution to the Sixth Assessment R eport of the Inter governmental Panel on Cl imate Change (ed. In tergover nmenta l Panel on Cli mate Ch ange (IP CC)) 613 – 746 (Cambr idge Univers ity Press, Camb ridge, 2022). d oi:10.1017/9 781009157926.0 08. 4. Da vis, S. J. et al. Net - ze ro emi ssion s energy syste ms. Science (2018) doi:10.112 6/science. aas9793. 5. Wolfram, P. , Kyle, P., F uhrman, J., O’Rour ke, P. & McJ eon, H. The hydr ogen econom y can reduce c osts of cli mate change mitigation b y up to 22%. One Earth 7 , 885 – 895 (202 4). 6. Hydrogen Counci l & McKinsey & C ompany. Hydrogen Ins ights 202 3 . https://hydrog enco uncil.com/ en/hydrogen - in sights - 2023 - dece mber - up date/ (202 3). 16 7. DECH EMA & acatech. Comparative Analy sis of Inte rnational Hydrogen Strategies, C ountry Analys is 2023 . http s://www. wass erstoff - ko mpass.de/f ileadmin/u ser_uplo ad/img/news - und - media/doku mente/2023_ e_H2_La enderan alys e.pdf (20 24). 8. Hun ter, C. A. et al. Tec hno - eco nomic analy sis of long - duration energ y storage and flex ible power gene ration technol ogies to support hi gh - variab le ren ewabl e energy grids. Joule 5 , 2077 – 2101 ( 2021). 9. Dowlin g, J. A. et al. Rol e of Lo ng - Durat ion Energy Sto rage in Varia ble Renewabl e Electricit y Systems. Jo ule 4 , 1907 – 19 28 (2020). 10. Dieteri ch, V. , Buttl er, A., H anel, A., Splieth off, H. & Fendt, S. Power - to - liquid via s ynthesis of methanol, DM E or Fische r – Trop sch - fu els: a re v iew. Energy & Environmental Science 13 , 3207 – 3252 (2020). 11. Uecker dt, F. et al. Potential and ris ks of hydrogen - base d e - fu els in climate ch ange miti gation. Nat. Clim. Chang. 11 , 384 – 393 (2021). 12. 117th United Sta tes Congres s. Inflation Reduction A ct . ( 2022). 13. European Commiss ion. Communication from the C ommission to the Eur opean Parliament, the European Council, the Council, the Europ ean Economic and Social Committee of the R egions on the Europea n Hydrogen Bank . (2023). 14. van Re nssen, S. The hydr ogen soluti on? Nature Climat e Change 10 , 799 – 801 (2020). 15. Over hyping hydrogen as a fuel risk s endangering ne t - zero goals. Nature 611 , 426 – 426 (20 22). 16. Capge mini & EIT InnoEnerg y. Reducing Low - Carbon Hydr ogen Investment and Operati ng Costs . http s://www. capgemini.co m/insigh ts/research - l ibrary/redu cing - low - carbon - hydrogen - invest ment - and - operating - costs/ (2024). 17. Ramboll. Achieving Affordable Gr een Hydrogen Production Plants . htt ps://www.r ambo ll.co m/net - zero - exp lorer s/wha t - will - it - take - to - reduce - capex - in - gre en - hydrogen - pro duction (2023). 18. Bloombe rgNEF. Hydrogen off take is tiny but gr owing. https://a bout.bnef.com/ blog/hydrogen - offtake - is - tiny - but - growing/ (2023) . 19. Neme t, G. F., Zipperer , V. & Kraus , M. The valley of death, the technology pork barrel, and public support for large demonstration proje cts. Energy P olicy 119 , 154 – 167 (2 018). 20. Unite d Nations Envir onment Program me. Lessons from a Decade of Emissions Gap A ssessments . https://www.un environm ent.org/re sources/emi ssions - gap - report - 10 - year - summ ar y (2019). 21. Lamb, W. F. et al. The c arbon dioxide r emoval gap. Nat. C lim. Chang. 1– 8 (2024) doi:10. 1038/s4155 8 - 024 - 01984 - 6. 22. Agora Indus try & Umlaut . Levelised Cos t of Hydrogen. Making the Appl ication of the LCO H Concept More Consi stent and More U se ful . http s://www.agora - energie wende.org/p ublication s/levelised - co st - of - hydr ogen (2023). 23. Malhotra , A. & Schmidt, T. S. Accel erating Low - Carbon Innovation. Jou le 4 , 2259 – 2267 (2020). 24. Uecker dt, F. et al. On the cost c ompetitive ness of blue and green h ydrogen. Joule 8 , 104 – 128 (20 24). 25. Zeyen, E. , Riepin, I. & Brow n, T. Temporal re gulation of renewa ble supply for elect rolytic hydrogen. Envi ron. Res. Lett. 19 , 024034 (2024). 26. Ricks, W., Xu, Q . & Jenkins, J. D. Minimizing emissions from grid - based hydr ogen production i n the Unit ed States . Environ. Res. Lett. 18 , 014025 (202 3). 27. Quarton, C. J. et al. The curio us case of th e conflicting roles of hyd rogen in globa l energy scenar ios. Sustainable Energy Fuels 4 , 80 – 95 (2019). 28. Odenwel ler, A. , Ueck erdt, F., Nemet , G. F., Jenst erle, M. & L uderer, G. Prob abili stic fea sib ility sp ace of scalin g up gr een hydrogen s upply. Nat Energy 7 , 854 – 865 (2022). 29. Müller - Ca sser es, E. et al. Int ern ational ship ping in a world below 2 °C. Nat. Clim. Chang. 1– 8 (20 24) doi:10.103 8/s41558 - 024 - 01997 - 1. 17 30. Dray, L. et al. Cost and emissions pathways towards net - zero climat e impacts in a viation . Nat. Clim. Chang. 12 , 956 – 962 (2022). 31. Rissm an, J. et a l. Techno logies and po licies to decarbo nize glob al industry: Re view and asses sment of mitigat ion drive rs through 2070. Applied Energy 266 , 11484 8 (2020). 32. Schreyer, F. et al. Distinct ro les of direct a nd indirect elect rification in p athways to a ren ewa bles - dominated Europe an energy system. One Earth 7 , 226 – 241 (2024). 33. Bachorz, C., Verpoort, P., Ueckerdt, F. & Luderer, G . Explo ring techno - economic landsc apes of abateme nt options for hard - to - electrify secto rs. Prepr int at http s://doi.org/10.212 03/rs.3 .rs - 4241841 /v1 (2024). 34. Mignone, B. K. et al. Drivers and impl ications of alternative routes to fue ls decarbonizat ion in net - zero en ergy sy stems. Nat Commun 15 , 3938 (2024). 35. IEA. Net Ze ro by 2050 . https://www.iea.org/reports/net - zer o - by - 2050 (2021). 36. IEA. World En ergy Outlook 2022 . h ttps://www.iea. org/repo rts/world - ene rgy - outlook - 202 2 (2022). 37. IEA. Net Zero Roadmap: A Global Pathway to Keep the 1.5 °C Goal in Reach . https:// www.iea .org /report s/net - zer o - roadmap -a- global - pathway - to - keep - the - 15 - 0c - goal - in - reach (2023). 38. Neumann, F ., Zeyen, E., Victor ia, M. & Br own, T. The potentia l role of a hydrogen network in Europe . Joule 7 , 1793 – 1817 (2023). 39. Plötz, P. Hydrogen tec hnology is unlikely to play a m ajor role in sustainable road transport. Nat Electron 5 , 8 – 10 (2022). 40. Nykvis t, B. & Olsson, O . The feasibi lity of heav y battery elec t ric t rucks. Joule 5 , 901 – 913 (2021). 41. Link, S., St ephan, A., Sp eth, D. & Plötz, P. Ra pidly declining costs of tru ck batterie s and fuel cells enabl e large - scal e road freight electri fication. Nat Energy 1– 8 (2024) doi:10. 1038/s41560 - 024 - 01531 - 9. 42. Wolfra m, P., Kyle, P., Zhang, X., Gkantonas , S. & Smith, S. Using a mmonia as a shipping fuel c ould disturb the nitr ogen cycle. Nat Energy 7 , 1112 – 1114 (2022 ). 43. Rosen ow, J. I s heating home s with hydrogen al l but a pipe d ream? An e vidence rev iew. Jo ule S25424351220 04160 (2022) doi:10.1016/j .joule.2022.0 8.015. 44. Roseno w, J. A m eta - review of 54 s tudies on hydroge n heating. Cell Reports Sustainabil ity 1 , (2024). 45. EPRI . Water Electrolyzer Stack Degradation . https://www.epri.com/re search/pro ducts/0000000 03002025148 (2 022). 46. IRENA. Green Hydr ogen Cost Reduction: Scaling up Electrol ysers to Meet the 1.5°C C limate Goal . https://www. irena.org/pu blication s/2020/Dec/Green -h ydrogen - cost - redu ction (2020). 47. Hydrogen Eur ope. Clean Hydr ogen Monitor 2023 . https:/ /hydrogeneur op e.e u/wp - content/u ploads/2023/10/ Clean_Hy drogen_Monitor _11 - 2023_DI GITAL.pdf (20 23). 48. Caglayan, D. G. et al. Technical po tential of salt cavern s for hydr ogen storage in Europe. Inter national Journal of Hy drogen Energy 45 , 6793 – 6805 (2020). 49. Sitarz, J., Pah le, M., Osorio , S., Lud erer, G. & Pietzcker, R. EU carbo n prices sign al high p olicy credibilit y and far sighted actors. Nat Energy 1– 12 (2024) doi:10.1 038/s41560 - 024 - 01505 - x. 50. Bloombe rgNEF. BNEF Hydr ogen Outlook. https://ww w.pv - maga zine.co m/wp - content /uploads/2022 /01/Session - 9_Presentation - 02_Adithy a - Bhashyam - BNE F.pdf (2023). 51. Jewell, J. & Cherp, A. The fea sibility o f climate action: Bridgi ng the i nside and t he outside view through f easibil ity spaces. WIREs Cl imate Change 14 , e838 (202 3). 52. Cherp, A ., Vinichenk o, V., Tos un, J., Gor don, J. A. & Jewe ll, J. Nati onal growth d ynamics of wind and s olar power compared to the growth required for glo bal cl imate t arget s. Nat Energy 6 , 742 – 754 (2021). 53. Jakhmola, A., Jewell, J., Vinichenko, V. & Cherp, A. Projecting Feasible Mediu m - Term Gr owth of Wind and Solar Po wer Using Nationa l Trajectorie s and Hindca sting. SSRN Scholarly Paper at htt ps://doi.org/10. 2139/ssrn.45 01704 (2023). 18 54. Zielonk a, N. & Trutne vyte, E. Probabilitie s of rea ching required di ffusion of granular ene rgy technolo gies in Euro pean countries. Prepri nt at http s://doi.org/10.21 203/rs.3.r s - 4039857/v1 (20 24). 55. Edwards, M. R. et al. Modeling direct a ir carbon cap ture and storage in a 1. 5 °C climate future using h istorical analo gs. Proceedings of the National Academy of Sciences 121 , e2215679121 (20 24). 56. Kazlou, T., Ch erp, A. & J ewell, J. F easible deploy ment tra jectories of ca rbon capture and storage compared to the requirement s of climate targe ts. Preprint at https://doi.org/ 10.21203/r s.3.rs - 327567 3/v1 (2023). 57. Bloomb ergNEF. New Energy O utlook 2024 . https ://about.bnef .com/new - energy - ou tlook/ (2024). 58. Ohlendorf, N., Löhr, M. & Markard, J. Actors in multi - sect or transitio ns - discourse analys is on hydroge n in Germa n y. Environmental Innov ation and Societal T ransitions 47 , 100692 (2023). 59. European Co mmission. Europe an Hydrogen B ank auction provides €720 mill ion. https://ec.eu ro pa.eu/co mmission/pr esscorner/deta il/en/IP _24_2333 (2024). 60. UK De partment for Ene rgy Securi ty & Net Ze ro. Hydroge n Production B usiness Model / Ne t Zero Hydroge n Fund: HA R1 successful pr ojects. https://ww w.gov.uk/gov ernment/pu blications/hy drogen - productio n- busine ss - model - net - zero - hydroge n - fund - shortl isted - projects/hy drogen - production - business - m odel - net - zero - hydrogen - fund - har1 - succ essful - pro ject s. 61. European Par liament & C ouncil of t he European Unio n. Directive (EU ) 2023/2413 of the European Parliament a nd of the Council o f 18 October 2 023 Amending Directive ( EU) 2018/2001, Re gulation (E U) 2018/1999 an d Directive 98/70/EC as Regar ds the Promotion of En ergy from R enewable Sources, and Re pealing Council Di rective (EU) 2015/652 . (2023). 62. European Parliamen t & Council of the European U nion. Regulation ( EU) 2023/2 405 of the European Par liament and of the Council of 1 8 October 2023 on Ens uring a Level Playi ng Field for Sustainable Air Transpor t (ReFuelEU Avi ation) . (2023). 63. European Parliament & C ouncil of the Eur opean Union. Re gulation (EU) 20 23/1805 of the Eur opean Parliament an d of the Council of 1 3 September 2023 on the Us e of Renewable and Low - Carbon F uels in Maritime Transport, and Amendin g Directive 2009 /16/EC (Text with EE A Relevance) . OJ L vol. 234 (2023). 64. Richs tein, J. C. & Neuhof f, K. Carbon contract s - for - differ ence: H ow to de - risk in novat ive inve stmen ts fo r a lo w - carb on industry? iScience 25 , 104700 (2022). 65. IEA. Hydrogen Production and Infrastructure Projects Database. (2023). 66 . Drevon, D., Fur sa, S. R. & Mal colm, A. L. In tercoder Rel iability and Validit y of WebPlotDigiti zer in Extra cting Graphed Da ta. Behav Modif 41 , 323 – 339 (2017). 67. Institut e of Energy Ec onomics at the Uni versity of Colog ne (EWI). The Impor tance of Hydrogen Storage – An Ana lysis o f Needs, Potentials and Costs . ht tps://www.ew i.uni - koeln.de/ en/publica tions/the - impo rtance - of - hydrog en - storag e/ (2024). Acknowle dgements We grat efully ackno wledge fu nd ing from t he Koper nikus - Proj ekt Aria dne by the German Feder al Ministry of Education and Research (grant nos. 03SFK5A , 03SFK5A0 - 2, A. O., F.U.) and th e HyValue proj ect (grant no. 333151, F. U.). We th ank the IEA, particul arly J.M. B ermudez, for prov iding the H ydroge n P rojects D atabase and for answering rel ated questions. We thank Robert Pietzcker for brainstorming about figures, Phil ipp Verpoort for cost parameters , and Joanna Sitarz for carbon price dat a. Author C ontributions A.O. suggest ed the initial research questi o n , which F.U. ext end ed . A.O. and F.U. collected cost d ata. A.O. collect ed 1.5°C scenario and LCOH data . A.O. performed the analys es and created t he figure s . A .O. and F.U. inter preted the re sult s . A.O. wro te th e manusc ript with cont ributions fr om F . U. Compe ting interests The autho rs declar e no comp eting interests. 19 Extende d D ata Fig ures Extende d Data Fi gure 1 : The 2023 gr een hydrogen impl ementation g ap . Analog ous to Figure 3 for the year 2023. a, S ankey dia gram sho wing the deve lopment o f green h ydrog en projects announce d for 202 3 in term s of adde d ele ctrolysis capacity . The mo st recent database vers io n is from Oc tob er 2023 such t hat the fi nal added c apacity i n 2023 is still unc ertain. b-c, Percenta ge rates of suc cess, del ay and disap pearanc e of green hy drogen p roject s announce d to launch i n 202 3 , co mparing expect ations i n 2021 with e xpect ations in 2 023 (b), an d co m paring expec tations i n 2022 wit h expect ations i n 2023 (c) . In contrast to Figure 3 , t he outcome of some p roject an nouncements for 2023 is still pending. b, Com paring exp ectatio ns in 2021 with expec tations in 20 23 . c, Com paring expect ations in 2022 wi th expect ations i n 2023 . I n both b and c, t he left pane l show s the tot al share, whi le the ri ght panel shows the disaggre gation by status . The width of the bars in the righ t panel corre sponds to the share o f total capacity ( also co mpare with a) . Withi n each colour , indi vidual proj ects are sho wn as se gments, or dered by size. Note tha t the time difference betwee n the first dat abase sna pshot in 2021 and 2023 is lo nger than in F igure 3 , which focuse d on 2022. To ensure that the com parison is based on t he same le ad time between expec tations and outc ome , Figur e 3 b should t herefo re be compar ed with Extende d Data Fi gure 1c. While some uncertainty remains, no mo re than 15% o f expect ed capacit y will be realised i n 2023 a nd t he success rate of pro jects in t he feasibil ity stu dy will be 1% at best (c). 20 Extende d Data Fi gure 2 : El ectroly sis requir ements in 1 .5°C sce nari os from 2030 to 2050. The assessed scenarios show a wide r ange, underl ining the hi gh uncert ainty s urroundi ng the gre en hydroge n mark et ramp - up. If scena rios do not report require ments in terms of electrolysis ca pacity , we convert pr oduction quan tities into corre spondin g electrolysis cap acity , which implies uncertainti es (see Met hods ). Extende d Data Fi gure 3 : Gree n hydr ogen projec t announc ements and 1.5°C scenario m edian . Co loured ba rs show pro ject anno uncem ents by status , while gre y bars i ndicate t he median 1 .5°C sc enario. Hatched bars indicat e the par t of capaci ty that i s supporte d by d emand - s ide r egulat ion such as e nd - use quotas in the ce ntral estimate ( see Metho ds ). a, Annual capacit y additio ns of pro ject annou ncements and requir ed annual c apacity a dditions for the median of 1.5°C scena rios. For simplicit y, we a ssume a linear scale - up bet ween the project pi peline in 2030, the 1.5 °C scenari o median i n 2040, an d the 1.5° C scena rio median in 2050 (see Exten ded Data F igure 2). b, C umulativ e capaci ty of pro ject announc ements , e quivale nt to th e right bars in Figur e 2, and re quired ca pacity fo r the me dian of 1. 5°C sce narios . Extende d Data Fi gure 4: Specific i nvestment costs of electrolysers . Investm ent cos ts decrease due to t echnolo gical learni ng (see Met hods ), with dif ferent le arning r ates for the electrolyser stack an d the bal ance o f pla nt (see Table 1 ). Until 2030, techn ological lear ning is driven by cumulat ive proj ect annou ncement s, assumi ng that all projects are real ised on t ime. Af ter 20 30, tech nologi cal learning i s driv en by the c apacity requir ed in the m edian 1.5 °C scen ario (see Ex tended Dat a Figure 3 ) , assum ing a lin ear scale - up between 2030 - 2040 and 2040 -2050 for simplicity. 21 Extende d Data Fi gure 5 : Lev elised cost of gre en hydroge n in 2030 compared t o recent studi es. T he filled circle in dicates the central estimate (if a vailable ) a nd the v ertical l ine indic ates the r ange (if availa ble). Colo urs indicat e the orga nisation. Our 2030 L COH estimates are in line with most recent stud ies , but do not ex tend as far do wn as so me other anal yses . We attribute this to (i) rece nt cost increa ses of electrolyse rs, which we incl ude in our c alculat ion, and (ii) a lack of cons ensus about which par ameters should be include d in the LCOH calculation 22 . W e suspect that studies reporting low LCOH val ues do no t include e .g. trans port an d storage co sts , which are critica l for a full assessmen t of hy drogen costs in our cas e . Note t hat Capgemi ni did no t calculat e LCOHs, but rath er conduc ted a glo bal s ur vey among more than 100 com panies in the hydrogen industr y . The dat a for this f igure, i ncluding so urces an d the ful l name o f the organis ations , i s availa ble on Gi tHub. Extende d Data Fi gure 6 : The green hydr ogen im plementati on ga p in 2030 ( progres sive scen ario). A nalogous t o Figure 5 us ing param eters that ar e more fav ourable f or gree n hydroge n (see Tabl e 1 and Met hods ). a-b , Co st gap bet ween the leveli sed cost of green hydr ogen (LCO H) and t he price of natural gas without carbo n prici ng (a) and with carbon pricin g (b) for the progre ssive pa rameter estimate (see Methods ). The red dou ble - heade d arrows a nd the li ght red sha ding indic ate the c ost gap that needs to be brid ged by subs idies. Th e stacked bars ind icat e the 22 decom positio n of the LCO H and the t otal co st of natur al gas for se lecte d years (202 4, 2030, 2035, 2 040, 204 5). For be tter visibility , the LCOH bar is sl ightly s hifted to the left, and the natural gas bar to t he righ t. c- d, Requi red subsi dies to br idge t he cost gap without c arbon pri cing (c) and wit h carbon p ricing ( d) in order to realis e all proje ct announc emen ts until 2030 o n time (see Exte nded Data Fi gure 3 ). The bars sh ow requir ed annual s ubsidies (left ax is), whil e the li nes show re quired c umulati ve subsi dies (ri ght axis) . e, Requi red cumul ative subs idies t o realis e all proje ct anno uncements u ntil 20 30 (without and with c arbon pri cing) in c omparis on to glo bal ly announce d hydroge n subsi dies as of September 2023 from B loomber gNEF (B NEF) 50 . When calc ulating s ubsidies , we take c urrentl y imple mented dem and - side policies, w hich reduce pressure on sup ply - side subsid ies, into account (see Me thods and Ex tended Dat a Figure 3 ). With out carbon pricin g , more th an $1.2 trillion of subsidi es are req uired to realise all proj ects announc ed unti l 2030. With ambiti ous carbo n pricing, the 2 030 green h ydrogen i mplemen tation gap clo ses as curr ently anno unce d subsidies match req uired subsid ies. Note that c - e only s how subsi dies req uired for green hydro gen pro ject announc ements u ntil 203 0. Stayi ng on a 1.5°C scenari o require s subst antial fur ther subsi dies aft er 2030 , which, wi thout car bon prici ng, would need to be permanent (see Extende d Data Fi gure 8 ). Extende d Data Fi gure 7 : The green hydr ogen im plementati on ga p in 2030 ( conserv ative scen ario). Analogous to Fi gure 5 using param eters that ar e less fav ourable f or green hydrogen (see Tabl e 1 and Me thod s ). a- b, Cost gap betwee n the lev elised c ost of green hydrogen (LC OH) and the pric e of natur al gas wit hout carbon pric ing (a) and with carbo n prici ng ( b) for the con serva tive parameter estimate (see Methods ). The red double - he aded arr ows and th e light red shadi ng indic ate the cos t gap th at needs t o be bridge d by su bsidies. The stack ed bars in dicate the decomposition of the LCOH and the total cost of natural gas for selected years (2024, 2030, 2035, 2040, 2045). For better vis ibility, the L COH bar is sl ightly s hifted to the left, and the natural gas bar to the right. c- d, Req uired subs idies to bridge t he cost gap without carbon pri cing (c) and wit h carbon p ricing ( d) in order to realis e all proje ct announc ement s until 203 0 on tim e (see Ext ended Data F igure 3). The ba rs show requir ed annual s ubsidies (left ax is), whil e the li nes show re quired c umulati ve subsidi es (right axis). e, Requi red cumul ative s ubsidies t o reali se all pro ject anno uncements until 2 030 (witho ut and with c arbon pricing) i n compari son to gl obal ly announc ed hydro gen subs idies as of September 2023 f rom Bloo mbergNEF (BNEF) 50 . When cal culatin g subsidi es, we tak e currentl y impl emented de mand - side policies, which r educe pressure on sup ply - si de subsi dies, i nto acco unt (see Methods and E xtended Dat a Figure 3 ). W ithout carbon pricin g , more th an $ 2.6 trillion of subsidi es are req uired to realise all proj ects announc ed unti l 2030. With an ambitious carbon price , $2.1 trillion of sub sidies would still be requir ed. Note that c - e only sho w subsidie s require d for gre en hydr ogen projec t announc ements until 20 30. Staying o n a 1.5° C scenari o requires substant ial furt her subs idies afte r 2030, which, wit hout car bon pric ing, woul d need to be p ermane nt (see Ex tended Data F igure 8 ). 23 Extende d Data Fi gure 8 : Re quired subsi dies t o realise al l projec t annou ncements u ntil 2 030 and fol low a media n 1.5°C sc enario a fter 2 030. Requir ed annual s ubsidies are dis played as b ars, wi th subsi dies for pro ject annou ncement s in lig ht red ( co mpare Figure 5 , Exte nded Dat a Figure 6 and Ext ended Data F igure 7 ) and subsidi es for the median 1 .5°C s cenario i n grey (com pare Ext ended Dat a Figure 2 and Ext ended Dat a Figure 3) . Require d cumulat ive subsi dies are displaye d as lines , with do tted li nes indicat ing cumul ative subs idies for projec t announc em ents until 2030, and sol id lines i ndicating c umulat ive subsi dies for pro ject an nouncem ents until 2030 and s ubseque ntly for the median 1. 5°C sc enario. a,c,e, Witho ut carbon prici ng, for the c entral (a), pro gressive (c), and conserv ative (e) scenario . With ou t carbon pricing, t he cos t gap does not clo se until 2 045, leadi ng to a ne ed for perm anent su bsidies . I n t he w or st - case scenar io, cumul ative subs idies required for 1. 5°C exceed $10 trillion b y 2045 (e). b,d,f, With carbon pri cing , for th e central (b) , progr essiv e (d), and conservati ve (f) sc ena rio . 24 Extende d Data Fi gure 9 : Global green hydroge n project ann ouncem ents supported by po licies . This fig ure r elies on the sam e model calcula tion as in Figure 5 to determ ine cumul ative requi red subs idies , but addresses the reciprocal quest ion of how much electrolysis deploym ent woul d be possible g iven impleme nted demand - side policies , estimated at 7 MtH2/yr by 2030 1 , and glo bally annou nced suppl y - side subsidi es , estima ted at $308 b illion as of September 2023 50 . On the demand side , we convert the product ion vo lume of 7 MtH2/yr to corre sponding e lectrol ysis capac ity, and dis tribute it from 2024-2030 in proporti on to pro ject annou ncement s ( see Method s and Extended Data Figure 3a ). D ependin g on the sc enario, implemented dem and - side polici es may suppo rt more c apacity t han announc ed suppl y - side subsid ies, underl ining the k ey role of com plementing su bsidies wi th deman d - side regula tion ( see Discussion a nd conclusion ).
Original Paper
Loading high-quality paper...
Comments & Academic Discussion
Loading comments...
Leave a Comment