AudioMNIST: Exploring Explainable Artificial Intelligence for Audio Analysis on a Simple Benchmark
Explainable Artificial Intelligence (XAI) is targeted at understanding how models perform feature selection and derive their classification decisions. This paper explores post-hoc explanations for deep neural networks in the audio domain. Notably, we…
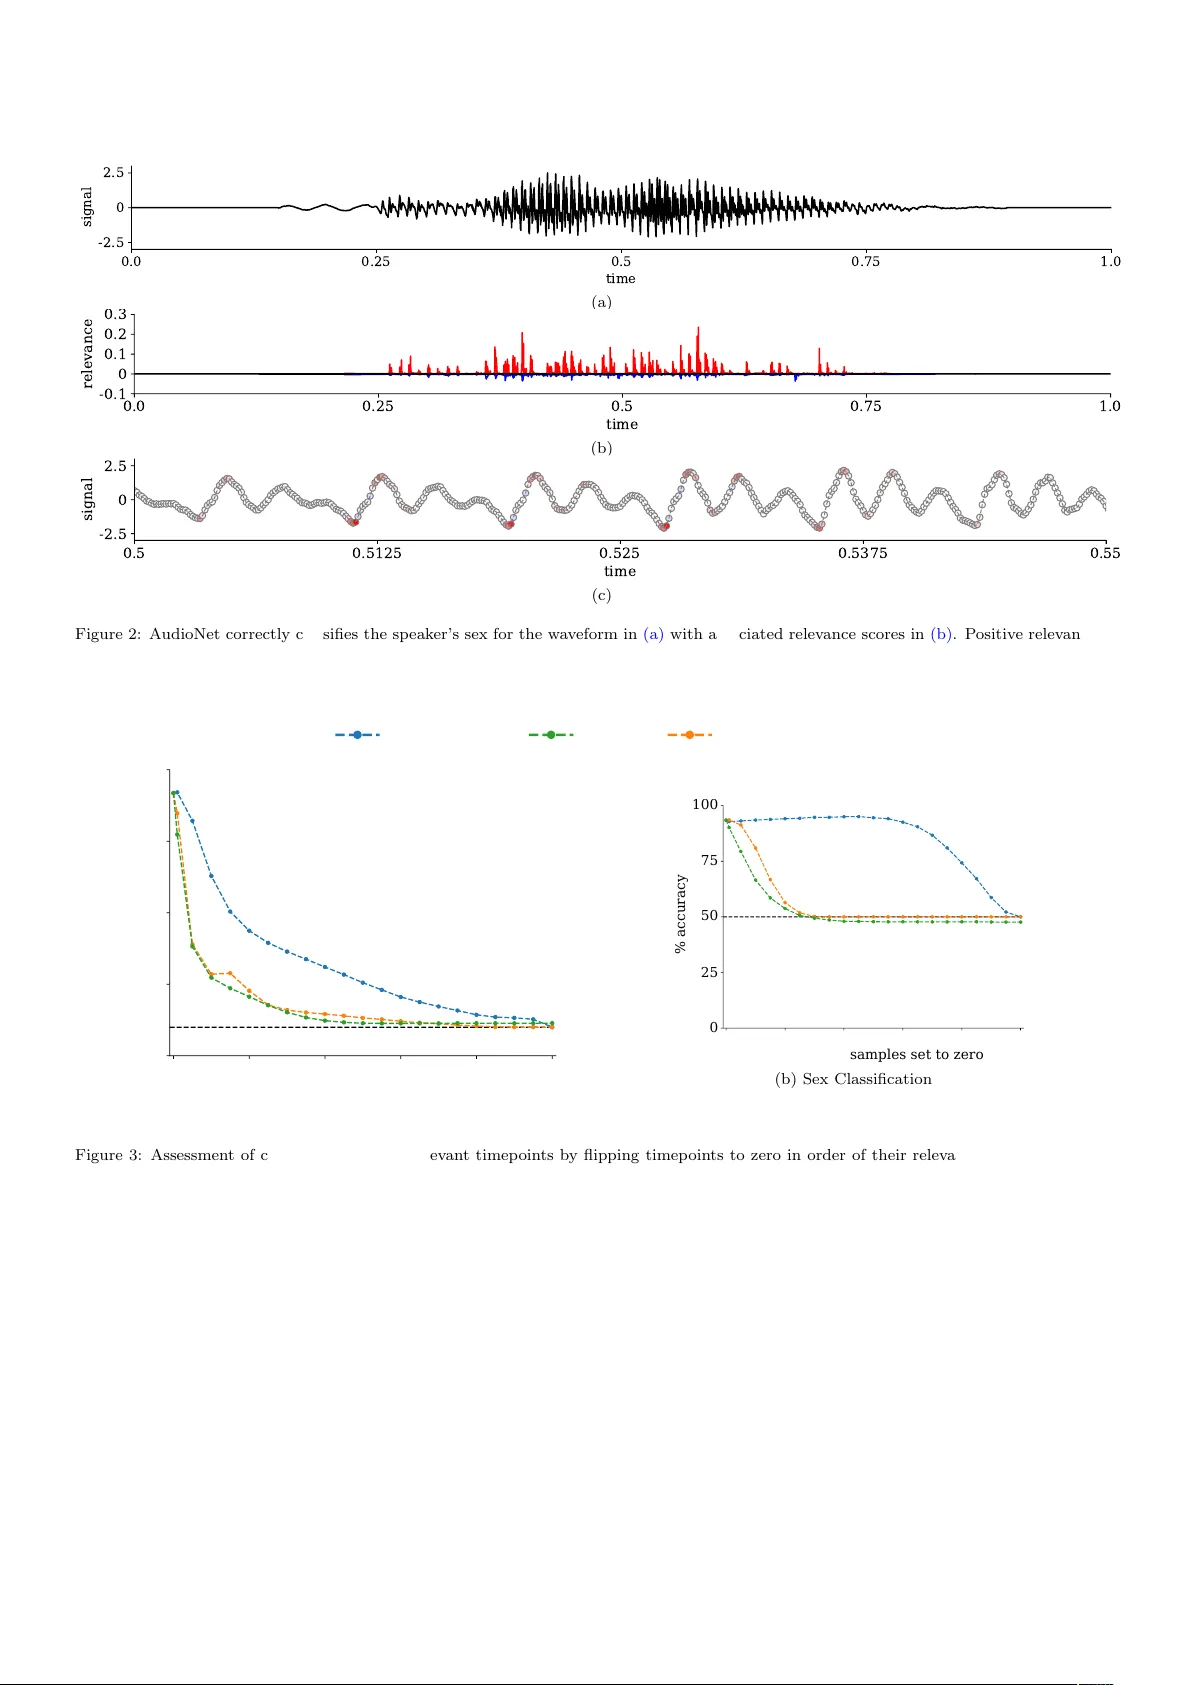
Authors: S"oren Becker, Johanna Vielhaben, Marcel Ackermann
AudioMNIST: Exploring Explainable Artificial In telligence for Audio Analysis on a Simple Benc hmark S¨ oren Bec ker ∗ a , Johanna Vielhab en ∗ a , Marcel Ac kermann a , Klaus-Rob ert M¨ uller b,c,d , Sebastian Lapusc hkin ∗∗ a , W o jciech Samek ∗∗ a,b,e a Dep artment of Artificial Intel ligenc e, F r aunhofer Heinrich-Hertz-Institute, Berlin, Germany b Dep artment of Ele ctric al Engine ering and Computer Scienc e, T e chnische Universit¨ at Berlin, Berlin, Germany c Dep artment of Br ain and Co gnitive Engine ering, Kor e a University, Se oul, Kor e a d Max Planck Institute for Informatics, Saarbr¨ ucken, Germany e BIFOLD – Berlin Institute for the F oundations of L e arning and Data, Berlin, Germany Abstract Explainable Artificial In telligence (XAI) is targeted at understanding how mo dels p erform feature selection and deriv e their classification decisions. This pap er explores post-ho c explanations for deep neural netw orks in the audio domain. Notably , we presen t a no vel Open Source audio dataset consisting of 30,000 audio samples of English sp ok en digits whic h w e use for classification tasks on sp ok en digits and speakers’ biological sex. W e use the p opular XAI tec hnique La y er- wise Relev ance Propagation (LRP) to identify relev an t features for t wo neural net work architectures that pro cess either w av eform or sp ectrogram representations of the data. Based on the relev ance scores obtained from LRP , hypotheses ab out the neural netw orks’ feature selection are derived and subsequen tly tested through systematic manipulations of the input data. F urther, w e tak e a step b ey ond visual explanations and introduce audible heatmaps. W e demonstrate the sup erior interpretabilit y of audible explanations o ver visual ones in a human user study . Keywor ds: Deep Learning, Neural Net works, Interpretabilit y, Explainable Artificial In telligence, Audio Classification, Sp eec h Recognition 1. In tro duction Deep neural net works, o wing to their intricate and non- linear hierarc hical arc hitecture, are widely regarded as black b o xes with regard to the complex connection betw een in- put data and the resultan t netw ork output. This lack of transparency not only p oses a significant challenge for re- searc hers and engineers engaged in the utilization of these mo dels but also renders them entirely unsuitable for do- mains where understanding and verification of predictions are indisp ensable, such as healthcare applications [ 1 ]. In resp onse, the field of Explainable Artificial In tel- ligence (XAI) in vestigates metho ds to make the classifi- cation strategies of complex mo dels comprehensible, in- cluding methods introspecting learned features [ 2 , 3 ] and metho ds explaining mo del decisions [ 4 , 5 , 6 , 7 , 8 ]. The latter metho ds were initially successful in the realm of im- age classifiers and ha ve more recently been adapted for other domains, suc h as natural language pro cessing [ 9 ], ph ysiological signals [ 10 , 11 ], medical imaging [ 12 , 13 ], and ph ysics [ 14 , 15 ]. This pap er explores deep neural netw ork interpretation in the audio domain. As in the visual domain, neural net- w orks hav e fostered progress in audio pro cessing [ 16 , 17 , ∗ equal con tribution ∗∗ corresponding author 18 ], particularly in automatic sp eec h recognition (ASR) [ 19 , 20 ]. While large corp ora of annotated sp eec h data are a v ailable (e.g. [ 21 , 22 , 23 ]), this pap er in tro duces a simple publicly av ailable dataset of sp ok en digits in English. The purp ose of this dataset is to serve as a basic classification b enc hmark for ev aluating no v el mo del arc hitectures and XAI algorithms in the audio domain. Drawing inspiration from the influen tial MNIST dataset of handwritten dig- its [ 24 ] that has pla y ed a pivotal role in computer vision, w e hav e named our nov el dataset AudioMNIST to high- ligh t its conceptual similarit y . AudioMNIST allows for sev eral different classification tasks of whic h we explore sp ok en digit recognition and recognition of sp eak ers’ sex. In this work, we train t w o neural netw orks for eac h task on t wo different audio represen tations. Sp ecifically , w e train one m odel on the time-frequency sp ectrogram representa- tions of the audio recordings and another one directly on the raw wa v eform represen tation. W e then use a p opular p ost-hoc XAI metho d called lay er-wise relev ance propaga- tion (LRP) [ 5 ] to insp ect the whic h features in the input are influen tial for the final model prediction. F rom these w e can deriv e insigh ts ab out the mo del’s high-level classi- fication strategies and demonstrate that the sp ectrogram- based sex classification is mainly based on differences in lo wer frequency ranges and that models trained on ra w w av eforms fo cus on a rather small fraction of the input Pr eprint submitte d to Journal of the F r anklin Institute Novemb er 28, 2023 data. F urther, we explore explanation formats b ey ond vi- sualization of relev ance heatmaps that indicate the impact of eac h timepoint in the ra w w av eform or time-frequency comp onen t in the spectrogram represen tation tow ards the mo del prediction. Notably , w e introduce audible heatmaps and demonstrate their sup erior in terpretabilit y o ver visual explanations in the audio domain in a h uman user-study . The structure of the pap er is as follows: In Section 2 , w e outline the audio representations used for neural net- w ork mo dels, examine LRP as an approach for explain- ing classifier decisions, and introduce audible explanations generated from LRP relev ances while con trasting them with visual explanations. Moving to Section 3 , we present the AudioMNIST dataset and delve into the visual ex- planations derived from LRP . Subsequently , we ev aluate the interpretabilit y of these visual explanations compared to audible explanations for practitioners in a h uman user study . 2. Explainable AI in the audio domain In this section, we provide an o verview of audio repre- sen tations utilized in the neural netw ork models for audio. W e also explore LRP as a method for explaining the out- put of these mo dels. Finally , w e present audible explana- tions generated from LRP relev ances and compare them to visual explanations. 2.1. Audio r epr esentations for NN mo dels In the realm of audio signal processing, the ra w w av e- form and the sp ectrogram serve as fundamental represen- tation formats for neural netw ork-based models. These formats b ear striking similarities to images in computer vi- sion, exhibiting translation inv ariance and sparse unstruc- tured data in either 1-dimensional or 2-dimensional form. Consequen tly , con ven tional conv olutional neural netw orks (CNNs) used in computer vision can b e trained on these audio signals [ 25 , 18 ]. Waveform. Straightforw ardly , an audio signal in the time domain is represen ted by a wa v eform x x x ∈ R L whic h con- tains the amplitude v alues x t of the signal ov er time. The time steps b et w een the signal v alues are determined b y the sampling frequency f S , and the duration of the signal is L f S . Sp e ctr o gr am. Alternatively , we can represent the audio signal in the time-frequency domain. Short Time Discrete F ourier T ransform (STDFT) transforms the raw wa v eform x x x to its represen tation Y Y Y in time-frequency domain, and is defined as, Y k,m = N − 1 X n =0 x n + mH · w n · e − iπk n N . (1) The STDFT calculates a Discrete F ourier T ransform for o verlapping window ed parts of the signal. The windo w function w has a length of M and a hop size of H . The resulting sp ectrogram Y Y Y ∈ C ( K +1) × M con tains complex- v alued time-frequency components in K + 1 frequency bins k and M time bins m , where K = N 2 and M = L − N H . Usually , the phase information is disregarded, and only the amplitude of the complex spectrogram Y Y Y magn ∈ R K +1 × M is considered for training classifiers. 2.2. Post-ho c explainability via L ayer-wise R elevanc e Pr op agation CNNs for audio pro cessing are inherently black-box mo dels. In order to understand their inner workings and classfication strategies, we can emply post-ho c explana- tion metho ds, see [ 8 , 26 ] for a recent ov erview of current approac hes. Here, we fo cus on a p opular metho d called L ayer-wise R elevanc e Pr op agation (LRP) [ 5 ], whic h has b een successfully applied to time series data in previous studies [ 10 , 27 , 11 , 28 ]. LRP allows for a decomp osition of a learned non-linear predictor output f ( x x x ) in to relev ance v alues R i that are assoc iat ed with the comp onen ts i of input x x x . Starting with the output, LRP p erforms per- neuron decomp ositions in a top-down manner by iterating o ver all lay ers of the netw ork and propagating relev ance scores R i from neurons of hidden lay ers step-by-step to- w ards the input. Each R i describ es the contribution an input or hidden v ariable x i has made to the final predic- tion. The core of the metho d is the redistribution of the relev ance v alue R j of an upp er la yer neuron tow ards the la yer inputs x i , in prop ortion to the contribution of each input to the activ ation of the output neuron j . R i ← j = z ij P i z ij R j (2) The v ariable z ij describ es the forward contribution (or pre- activ ation) sen t from input i to output j . The relev ance score R i at neuron i is then obtained b y p ooling all incom- ing relev ance quantities R i ← j from neurons j to which i con tributes: R i = X j R i ← j (3) The initial relev ance v alue equals the activ ation of the out- put neuron, for deep er lay ers it is specified by the c hoice of redistribution rule dep ending on the la yer’s type and p osition in the model [ 29 , 30 , 8 ]. Implemen tations of the algorithm are publicly a v ailable [ 31 , 32 , 33 ]. 2.3. Explanation formats W e can easily employ LRP to deep audio classification mo dels trained on the raw wa v eform x x x or the sp ectrogram represen tation Y Y Y to obtain feature relev ance scores R t or R k,m for each timep oin t or each time-frequency comp onen t of the input sample, resp ectiv ely . The next consideration is how to adequately communicate these scores to users as means of an explanation. In this regard, w e prop ose tw o explanation formats: the conv en tional visual approac h and an alternativ e audible approach. 2 Visual explanations. In order to pro vide a visual expla- nation, we follow the common practice of ov erla ying the input with a heatmap composed of the relev ance v alues [ 34 ]. F or the sp ectrogram this format is very similar to explanations for natural images. F or the raw wa v eform, w e employ color-co ded timep oin t mark ers based on their resp ectiv e relev ance scores. The heatmap is designed as a color map centered at zero, as a relev ance score of R = 0 indicates a neutral con tribution or no impact on the pre- diction. P ositiv e relev ance scores are depicted using red colors, while negativ e scores are represen ted b y shades of blue. A udible explanations. In the domain of audio data, the in terpretability of visual explanations may be called into question, as the most natural wa y for humans to p erceiv e and understand audio is through listening. In the study b y Sch uller et al. [ 35 ], a roadmap to w ards XAI for au- dio is presented, highlighting the imp ortance of pro viding audible explanations. Existing XAI metho ds that pro vide audible explana- tion include AudioLIME [ 36 , 37 , 38 ]. This approach ini- tially p erforms audio segmen tation and source separation to obtain in terpretable comp onen ts. The relev ance of these comp onen ts is then quantified using LIME [ 39 ] and for the explanation, the top most relev an t source segmen ts are play ed. AudioLIME thus shifts the problem of audi- ble explanations to audio segmen tation and source separa- tion. In consequence, the final explanation hea vily relies on the separation of the signal into interpretable parts. In certain applications, obtaining such a segmentation ma y not b e readily a v ailable or straightforw ard. W e offer an approac h that is indep enden t of audio segmentation and source separation algorithms (and thus applicable even in cases where no solutions exists for the sp ecific kind of au- dio data at hand). This cancels undesired v ariabilit y of the explanations induced by the sp ecific choice of the source separation algorithm. Instead, we p ort the basic idea of o verla ying input with heatmap to the audible domain, b y simply taking the element-wise pro duct betw een the ra w w av eform and the heatmap, ReLU( R R R ) ⊙ x x x . (4) In eac h audible explanation, we can only present either p ositiv e or negative relev ance. Thus, in Eq. 4 , we mask only the p ositiv e relev ance. Alternatively , we could do the same for the negative relev ance to elucidate what con tra- dicts the prediction. Curren tly , our computation of audi- ble explanations is limited to the time domain. This is due to the exclusion of phase information in the sp ectrograms, making it challenging to directly reconstruct the w a veform represen tation, although it is theoretically p ossible. These audible explanations straightforw ardly general- ize to relev ance scores from nov el concept-based XAI meth- o ds [ 40 , 41 ], which is explored in [ 42 ]. 3. Results In this section, we introduce a dataset that can serv e as a testb ed for the audio AI comm unity . Subsequen tly , we train t w o models on distinct input represen tations, namely the ra w wa v eform and sp ectrogram. W e then pro ceed to presen t visual explanations for these mo dels, allowing us to extract high-level classification strategies from the p er- sp ectiv e of mo del developers. Finally , we explore audible explanations and conduct a comparative analysis to assess their interpretabilit y in a human user study , contrasting them with visual explanations and their p oten tial for XAI for end-users. 3.1. AudioMNIST dataset In the computer vision comm unity , the simple MNIST dataset [ 24 ] is still often emplo y ed as an initial testbed for mo del developmen t. Here, w e prop ose an analogous dataset for the audio communit y and call it AudioMNIST . The AudioMNIST dataset 1 consists of 30,000 audio record- ings (amoun ting to a grand total of appro x. 9.5 hours of recorded speech) of sp ok en digits (0-9) in English with 50 rep etitions p er digit for eac h of the 60 differen t speakers. Recordings were collected in quiet offices with a RØDE NT-USB microphone as mono channel signal at a sam- pling frequency of 48kHz and w ere sav ed in 16 bit integer format. In addition to audio recordings, meta information including age (range: 22 - 61 years), sex (12 female / 48 male), origin and accent of all sp eak ers w ere collected as w ell. All sp eak ers were informed ab out the inten t of the data collection and hav e giv en written declarations of con- sen t for their participation prior to their recording session. The AudioMNIST dataset can b e used to benchmark mo d- els for different classification tasks of whic h classification of the sp ok en digit and the sp eak er’s sex are explored in this pap er. 3.2. De ep sp oken digit classifiers In this section, w e implemen t b oth a CNN trained on (t wo-dimensional) sp ectrogram representations of the au- dio recordings as well as a CNN for (one-dimensional) raw w av eform representations. Classific ation b ase d on sp e ctr o gr ams. First, we train a CNN mo del on the sp ectrogram represen tation of the recordings. Its architecture is based on AlexNet [ 43 ] without normal- ization la yers. T o obtain the sp ectrograms from the audio recordings, first we do wnsample them to 8kHz and zero-padded to get an 8000-dimensional v ector per recording. During zero- padding we augment the data b y placing the signal at random p ositions within the vector. Then, w e apply a short-time F ourier transform in Eq. 1 using a Hann win- do w of width 455 and with 420 time points ov erlap to the 1 Published at: https://github.com/soerenab/AudioMNIST 3 T able 1: Mean accuracy ± standard deviation ov er data splits for AlexNet and AudioNet on the digit and sex classification tasks of AudioMNIST. Mo del Input T ask Digit Sex AlexNet sp ectrogram 95 . 82% ± 1 . 49% 95 . 87% ± 2 . 85% AudioNet w av eform 92 . 53% ± 2 . 04% 91 . 74% ± 8 . 60% signal. This results in sp ectrogram represen tations of size 228 × 230 (frequency × time). Next, the sp ectrograms are cropp ed to a size of 227 × 227 b y discarding the highest frequency bin and the last three time segments. Finally , w e conv ert the amplitude of the cropp ed sp ectrograms to decib els and use them as input to the mo del. Classific ation b ase d on r aw waveform r epr esentations. F or classification based on raw wa v eforms, we use the down- sampled and zero-padded signals described in Section 3.2 as input to the neural net work directly . Here, we des i gn a custom CNN whic h we refer to as A udioNet . F or details of the training proto col of b oth mo dels and the architecture of AudioNet, w e refer to App endix A . Mo del performances are summarized in T able 1 in terms of means and standard deviations across test folds. Com- parisons of mo del p erformances ma y b e difficult due to the differences in training parameters and are also not the primary goal of this pap er, yet, we note that AlexNet p er- forms consisten tly sup erior to AudioNet for both tasks. Ho wev er, b oth netw orks sho w test set p erformances well ab o v e chance level, i.e., for b oth tasks the netw orks dis- co vered discriminant features within the data. The con- siderably high standard deviation for sex classification of AudioNet originates from a rather consistent misclassifi- cation of recordings of a single sp eak er in one of the test folds. 3.3. Visual explanations r eve al classifier str ate gies In this section, w e visualize LRP relev ances for AlexNet and AudioNet. W e then derive high-level model classifica- tion strategies from the explanations, that we ev aluate in sample manipulation exp erimen ts. R elevanc e maps for AlexNet. W e compute LRP relev ance scores for the AlexNet digit and sex classifier and show ex- emplary visual explanations based on these scores in Fig. 1 . The sp ectrogram in Fig. 1(c) and Fig. 1(d) corresp ond to a sp ok en zer o by a female and a male speaker, resp ec- tiv ely . AlexNet correctly classifies b oth sp eak ers’ biolog- ical sex. Most of the relev ance distributed in the lo w er frequency range for b oth classes. Based on the relev an t frequency bands it ma y be h yp othesized that sex classifi- cation is based on the fundamen tal frequency and its im- mediate harmonics which are in fact kno wn discriminant features for sex in sp eec h [ 44 ]. 0 0.5 1 seconds 0 2 4 kHz (a) female speaker digit zer o 0 0.5 1 seconds 0 2 4 kHz (b) female speaker digit one 0 0.5 1 seconds 0 2 4 kHz (c) female sp e aker digit zero 0 0.5 1 seconds 0 2 4 kHz (d) male sp e aker digit zero Figure 1: Visual explanations — spectrograms as input to AlexNet with LRP relev ance heatmaps ov erla yed. L eft, (a) and (b) : Digit classification. R ight, (c) and (d) : Sex classification. Data in (a) and (c) is iden tical. T ext in italics below the panels indicate the prediction task and explained outcome. In all cases, predictions are correct and the true class is explained by LRP . Sp ectrograms in Fig. 1(a) and Fig. 1(b) corresp ond to sp ok en digits zer o and one from the same female sp eak er. AlexNet correctly classifies b oth spoken digits and the LRP scores reveal that different areas of the input data app ear to b e relev ant for its decision. How ev er, it is not p ossible to derive any deep er insights ab out the classifica- tion strategy of the mo del based on these visual explana- tions. The sp ectrogram in Fig. 1(c) is identical to that in Fig. 1(a) , but the former is ov erla y ed with relev ance heat- maps from the sex classifier while the latter shows the heatmap from the digit classifier. As a sanit y chec k, we confirm that although the input sp ectrograms in Fig. 1(a) and Fig. 1(c) are identical, the corresp onding relev ance distributions differ, highlighting the task-dep enden t fea- ture selection b et w een the digit in and the sex classifier. R elevanc e maps for AudioNet. Next, we compute LRP relev ance scores for the AudioNet digit and sex classifier that op erates on the raw wa v eforms. In Fig. 2 , we sho w a visual explanation for an exemplary sp ok en zero from a male sp eak er for the sex classifier’s correct prediction male . Here, w e first show the signal and the relev ance 4 scores separately in Fig. 2(a) and Fig. 2(b) . F or the time in terv al from 0 . 5 − 0 . 55 seconds a zo omed-in segmen t is pro- vided in Fig. 2(c) for an actual visual explanation, where timep oin ts color-co ded according to the relev ance score. In tuitively plausible, zero relev ance falls on to the zero- em b edding at the left and right side of the recorded data. F urthermore, from Fig. 2(c) it app ears that mainly time- p oin ts of large magnitude are relev ant for the net w ork’s classification decision. R elevanc e-guide d sample manipulation for A lexNet. The relev ance maps for the AlexNet sex classifier (Fig. 1(c) and Fig. 1(d) ) suggest that the sex classifier fo cuses on differences in the fundamental frequency and subsequent harmonics for feature selection. T o inv estigate this hy- p othesis the test set was manipulated by up- and down- scaling the frequency-axis of the spectrograms of male and female sp eak ers b y a factor of 1 . 5 and 0 . 66, resp ectiv ely . F undamen tal frequency and spacing betw een harmonics in the manipulated sp ectrograms approximately matc h the original sp ectrograms of the resp ectiv ely opp osite sex. After the data has b een manipulated as describ ed, the trained net w ork reac hes an accuracy of only 20 . 3% ± 12 . 6% across test splits on the manipulated data, whic h is w ell- b elo w chance level for this task. In other words, identi- fying sex features via LRP allow ed us to successfully p er- form transformations on the inputs that target the identi- fied features sp ecifically such that the classifier is approx- imately 80% accurate in predicting the opp osite sex. R elevanc e-guide d sample manipulation for AudioNet. F or AudioNet we assess the reliance of the mo dels on features mark ed as relev an t b y LRP by an analysis similar to the pixel-flipping (or input p erturbation) approac h in tro duced in [ 5 , 45 ]. Sp ecifically , we emplo y three different strategies to systematically manipulate a fraction of the input signal b y setting selected samples to zero. Firstly , as a base- line, (non-zero) samples of the input signal are selected and flipp ed at random. Secondly , samples of the input are selected with respect to maximal absolute amplitude, e.g the 10% samples with the highest absolute amplitude are selected, reflecting our (naive) observ ation from Fig. 2(c) . Thirdly , samples are selected according to maximal rele- v ance as attributed by LRP . If the mo del truly relies on features marked as relev ant b y LRP , p erformance should deteriorate for smaller fractions of manipulations in case of LRP-based selection than in case of the other selection strategies. Mo del performances for digit and sex classification on manipulated test sets in relation to the fraction of manip- ulated samples are displa y ed in Fig. 3 . F or b oth tasks, mo del p erformances deteriorate for substantially smaller manipulations for LRP-based sample selection as compared to random selection and for slightly smaller manipulations as compared to amplitude-based selections. The effect b e- comes most apparent for digit classification where a ma- nipulation of 1% of the signal leads to a deterioration of mo del accuracy from originally 92 . 53% to 92% (random), 85% (amplitude-based) and 77% (LRP-based). In case of sex classification, the netw ork furthermore sho ws a re- mark able robustness to w ards random manipulations with classification accuracy only starting to decrease when 60% of the signal has b een set to zero, as shown in Fig. 3(b) . The decline in mo del performance in b oth the relev ance- based and amplitude-based p erturbation pro cedures sup- p orts our hypothesis that the mo del seems to ground its in- ference in the high-amplitude parts of the signal. The fact the relev ance-based p erturbation has a marginally stronger impact on the model how ever tells u s that while our initial h yp othesis strikes close to the truth, our in terpretation of the mo del’s reasoning based on visual explanations is not exhaustiv e. 3.4. Audible explanations surp ass visual for interpr etability In the abov e exp erimen ts we inv estigate the o v erall mo del behaviour from a tec hnical p oin t of view, which is a XAI use-case scenario targeted mostly at mo del develop- ers. Ho wev er, a purely visual explanation as in Fig. 2 may b e insufficien t to comm unicate the mo del reasoning under- lying a single model prediction to the non-expert end user. Sp ecifically , w e in v estigate the question, which explana- tion format is the most in terpretable to h umans: audible or visual explanations. Previous work on XAI for audio sho ws a combination of b oth [ 37 , 36 ]. Here, we show ei- ther an audible or visual explanation and compare their in terpretability in a human user study , where w e measure the h uman-XAI p erformance. Study design. T o compare the interpretabilit y of audible and visual explanations, we ask the user to predict the mo del prediction based on the explanation, following the metho d to ev aluate the human-XAI p erformance as sug- gested in [ 46 ]. The outcome is particularly interesting for samples where the mo del prediction do es not match the ground truth lab el, esp ecially giv en the high prediction accuracy of the classifier. Our study design is similar yet distinct to the h uman user study design in [ 42 ], whic h com- pares different audible explanations b y asking the user for a sub jective judgments how w ell explanation and model prediction relate. T o the b est of our knowledge, we are the first to conduct a user study that compares the inter- pretabilit y of audible and visual explanation formats. W e compute LRP relev ance scores for the AudioNet digit clas- sifier trained on the ra w wa v eforms. 2 W e c ho ose the digit task, because of its higher complexity compared to sex classification. F urther, w e fo cus on explanations for the w av eform mo del b ecause in this representation, relev ance can directly b e made audible. In summary , we conduct 2 The user study is based in a reconstruction if the original mo del in Section 3.2 , whic h originate from an earlier preprin t of this work [ 47 ]. The mo del weigh ts and the p erformance of the reconstruction used in this section slightly deviate from those of the original mo del. 5 0.0 0.25 0.5 0.75 1.0 time -2.5 0 2.5 signal (a) 0.0 0.25 0.5 0.75 1.0 time -0.1 0 0.1 0.2 0.3 relevance (b) 0.5 0.5125 0.525 0.5375 0.55 time -2.5 0 2.5 signal (c) Figure 2: AudioNet correctly classifies the sp eak er’s sex for the wa veform in (a) with asso ciated relev ance scores in (b) . Positiv e relev ance in fav or of class male is colored in red and negative relev ance, i.e., relev ance in fav or of class female , is colored in blue. A selected range of the wa v eform from (a) is again visualized in (c) with single samples color-co ded according to their relev ance. It app ears that mainly samples of large magnitude are relev ant for the netw ork’s inference. random lrp |amplitude| 0 20 40 60 80 100 % signal samples set to zero 0 25 50 75 100 % accuracy (a) Digit Classification 0 20 40 60 80 100 % signal samples set to zero 0 25 50 75 100 % accuracy (b) Sex Classification Figure 3: Assessment of classifer reliance on relevan t timepoints by flipping timep oin ts to zero in order of their relev ance scores. (a) : Digit classification. (b) : Sex classification. Signal samples are either selected randomly (blue), based on their absolute amplitude (orange) or their relev ance according to LRP (green). The dashed black line shows the chance level for the respective task. a comparison b et ween visual explanations which consists of heatmaps ov erla ying the wa v eform (as shown in Fig. 1 and Fig. 2 ), and audible explanations based on Eq. 4 . As a baseline, we additionally presen t the user with faux ’ex- planations’ that entail solely the signal itself. Overall, w e presen t b oth the mo dulated or ov erlay ed signal with rele- v ance scores as well as solely the signal, for b oth the au- dible and visual explanation formats. The study design is visualized in Fig. 4 . W e choose 10 random samples where the mo del prediction is correct and 10 random samples where the mo del is predicting incorrectly . Data ac quisition. W e ask ed 40 sub jects from the authors’ researc h departmen t to predict the mo del’s predictions for the 20 randomly c hosen samples and all 4 explana- tion mo des describ ed ab o v e, th us each sub ject answers 80 questions. W e also collect meta-information ab out gender (7.5% diverse, 15% female, 77.5%male), previous exp eri- ence with XAI (50% high - researcher in the field, 42.5% medium - had exp osure to XAI, 7.5% low - roughly knows what XAI is, 0% zero - never heard of XAI before) and sub- jectiv ely assessed hearing capabilities (32.5% v ery go od, 42.5% go od, 25% medium, 0% lo w, 0% very low). T est 6 heatmap x signal signal explanation only signal audible visual The AI listened to a digit and has predicted which one it is (the AI could be wrong). Please listen/ look at to the explanation for this prediction. Based on this, decide which digit the AI predicted. one two three four five six seven eight nine ten Figure 4: Design of the user study: The user w as presen ted with either a visual or audible explanation. As a baseline we present faux explanations that en tail only the signal itself. The user was asked to predict the mo del prediction based on the explanation. sub jects ga v e their informed written consent to participate in the study and to the data acquisition and pro cessing. A fast-track self-assessment of the study had resulted in a positive ev aluation from the ethics commission of the F raunhofer Heinric h Hertz Institute. informedness markedness 0.15 0.10 0.05 0.00 0.05 0.10 (a) Incorrect model classification informedness markedness 0.0 0.2 0.4 0.6 0.8 1.0 (audible, heatmap x signal) (audible, signal) (visual, heatmap x signal) (visual, signal) (b) Correct model classification Figure 5: (a) : User p erformance on incorrectly predicted samples based on the different explanation formats. (b) : User performance on correctly predicted samples. Evaluation. In in Fig. 5 , w e sho w the user’s p erformance in predicting the mo del’s predictions based on the expla- nations, where w e report informedness and mark edness for the multi-class case [ 48 ]. Informedness for each class is de- fined as T P /P − F P / N and measures ho w informe d the user is about the p ositiv e and negativ e mo del predictions for this class based on the explanation. Mark edness for eac h class in T P / ( T P + F P ) − F N/ ( T N + F N ) and mea- sures the trustworthiness of the user’s prediction of posi- tiv e and negative mo del preditions for this class. Here, TP, FP, TN, FN denote true and false p ositiv e and negative predictions, resp ectiv ely . V alues for b oth metrics range from -1 to +1, where p ositiv e v alues imply that the user is informed correctly b y the explanation and their prediction can b e trusted and negative v alues imply that the user is informed incorrectly and that it can be trusted that their prediction is wrong. First, we ev aluate the case where the model prediction do es not matc h the true digit, see Fig. 5a . W e find that au- dible explanations sho w a markedly greater informedness and markedness than their visual counterpart. How ev er, the v alues of 0.12 and 0.1 indicate that there is still ro om for impro vemen t in terms of the in terpretability of audi- ble explanations. This can b e ac hieved b y employing in- no v ativ e concept-based metho ds that hav e demonstrated impro ved interpretabilit y in computer vision applications [ 41 ]. As expected, the baseline con taining only the signal sho w negative informendess and markedness, as the user is informed incorrectly ab out the mo del prediction and it can b e trusted that their prediction is wrong. Second, for the samples where the mo del classified the digits correctly , as exp ected the use r ’s prediction p erfor- mance is higher for all explanation formats than for the incorreclt y classified samples, see Fig. 5b . F urther, b oth informedness and mark edness are higher for the audible 7 signal than for the actual audible explanation. This is nat- ural as it is possible that the mo del’s classification strat- egy deviates from the user’s classifiaction strategy . T o illustrate this, across all digits classes, both informedness and markedness ha ve the low est v alue for the samples cor- rectly classified as a ’nine’ by the mo del with a v alue of 0.33. Here, 33% users predicted that the mo del classified the digit as a ’nine’ and 32% predicted that the mo del clas- sified it as a ’fiv e’. In the explanation, only the common syllable, the ’i’ is audible. Like for the samples incorrectly classified by the mo del, b oth informedness and marked- ness are muc h low er for the visual explanations than for the audible ones. Interestingly , the comparison b et ween explanation and signal only follo ws the same trend as for their audible coun terparts. W e conclude that audible explanations for audio classi- fiers exhibit a higher level of interpretabilit y compared to visual explanations for human users. This highlights the imp ortance of the presentation of the explanation, b ey ond the mere computation of raw relev ance v alues. F urther- more, it emphasizes that the optimal format of explana- tions ma y v ary across different applications. In the context of audio applications, the sup erior interpretabilit y of au- dible explanations is exp ected, considering that listening is the innate wa y for humans to p erceiv e audio signals. As prop osed ab o v e, to further impro ve the interpretabilit y of audible explanations, concept-based approaches [ 40 , 41 ], that put the mo del prediction for a single sample in to con text with the mo del reasoning o v er the en tire dataset, could b e leveraged and made audible, similar to the work in [ 42 ]. 4. Conclusion The need for interpretable mo del decisions is increas- ingly evident in v arious mac hine learning applications. While existing researc h has primarily focused on explaining im- age classifiers, there is a dearth of studies in interpreting audio classification models. T o foster op en researc h in this direction we provide a no vel Op en Source dataset of spo- k en digits in English as ra w w av eform recordings. F urther, w e demonstrated that LRP is a suitable XAI metho d for explaining neural net w orks for audio classification. By em- plo ying visual explanations based on LRP relev ances, we ha ve successfully deriv ed high-lev el classification strategies from the p erspective of mo del dev elop ers. Most notably , w e hav e introduced audible explanations that align with the established framework for explanation presen tation in computer vision. Through a user study , we ha ve conclu- siv ely shown that audible explanations exhibit superior in terpretability compared to visual explanations for the classification of individual audio signals b y the mo del. In future work we aim to apply LRP to more complex audio datasets to gain a deep er insigh t in to classification decisions of deep neural netw orks in this domain. F urther, w e aim to improv e the interpreatbilit y of audible explana- tions, b y using concept-based XAI metho ds as studied in [ 40 , 41 ]. Ac kno wledgement WS and KRM were supp orted b y the German Min- istry for Education and Research (BMBF) under grants 01IS14013A-E, 01GQ1115, 01GQ0850, 01IS18056A, 01IS18025A and 01IS18037A. WS, SL and JV receiv ed funding from the Europ ean Union’s Horizon 2020 research and innov ation programme under grant iT oBoS (gran t no. 965221), from the Europ ean Union’s Horizon Europ e re- searc h and innov ation programme (EU Horizon Europe) as gran t TEMA (grant no. 101093003), and the state of Berlin within the innov ation supp ort program ProFIT (IBB) as gran t BerDiBa (grant no. 10174498). WS was further sup- p orted by the German Research F oundation (ref. DF G KI-F OR 5363). KRM was also supported by the Informa- tion & Communications T echnology Planning & Ev alua- tion (I ITP) grant funded by the Korea gov ernment (grant no. 2017-0-001779), as well as by the Research T raining Group “Differential Equation- and Data-driv en Mo dels in Life Sciences and Fluid Dynamics (D AEDALUS)” (GRK 2433) and Grant Math+, EX C 2046/1, Pro ject ID 390685689 b oth funded by the German Research F oundation (DFG). References [1] R. Caruana, Y. Lou, J. Gehrk e, P . Koch, M. Sturm, N. Elhadad, Intelligible models for healthcare: Predicting pneumonia risk and hospital 30-da y readmission, in: 21th A CM SIGKDD In ter- national Conference on Knowledge Discov ery and Data Mining, 2015, pp. 1721–1730. [2] G. Hinton, S. Osindero, M. W elling, Y.-W. T eh, Unsupervised discov ery of nonlinear structure using c o ntrastiv e backpropaga- tion, Cognitive Science 30 (4) (2006) 725–731. [3] D. Erhan, Y. Bengio, A. Courville, P . Vincen t, Visualizing higher-lay er features of a deep network, University of Montreal 1341 (3) (2009) 1. [4] D. Baehrens, T. Sc hro eter, S. Harmeling, M. Kaw anab e, K. Hansen, K.-R. M ¨ uller, How to explain individual classifica- tion decisions, Journal of Machine Learning Research 11 (Jun) (2010) 1803–1831. [5] S. Bach, A. Binder, G. Monta von, F. Klauschen, K.-R. M¨ uller, W. Samek, On pixel-wise explanations for non-linear classi- fier decisions by lay er-wise relev ance propagation, PLOS ONE 10 (7) (2015) e0130140. [6] R. C. F ong, A. V edaldi, Interpretable explanations of black boxes by meaningful perturbation, in: 2017 IEEE International Conference on Computer Vision (ICCV), IEEE, 2017, pp. 3449– 3457. [7] G. Monta von, S. Bach, A. Binder, W. Samek, K.-R. M ¨ uller, Explaining nonlinear classification decisions with deep taylor decomposition, Pattern Recognition 65 (2017) 211–222. [8] W. Samek, G. Monta von, S. Lapuschkin, C. J. Anders, K.-R. M¨ uller, Explaining deep neural netw orks and b ey ond: A review of metho ds and applications, Pro ceedings of the IEEE 109 (3) (2021) 247–278. [9] L. Arras, G. Montav on, K.-R. M ¨ uller, W. Samek, Explaining recurrent neural netw ork predictions in sentimen t analysis, i n : EMNLP’17 W orkshop on Computational Approaches to Sub- jectivity , Sentimen t & Social Media Analysis (W ASSA), 2017, pp. 159–168. 8 [10] I. Sturm, S. Lapusc hkin, W. Samek, K.-R. M¨ uller, Interpretable deep neural netw orks for single-trial eeg classification, Journal of Neuroscience Methods 274 (2016) 141–145. [11] N. Stro dthoff, C. Stro dthoff, Detecting and interpreting my- ocardial infarction using fully conv olutional neural netw orks, Physiological Measurement 40. [12] A. W. Thomas, C. R´ e, R. A. Poldrac k, Interpreting mental state decoding with deep learning models, T rends in Cognitive Sciences 26 (11) (2022) 972–986. [13] F. Klauschen, J. Dipp el, P . Keyl, P . Jurmeister, M. Bo c kma yr, A. Mo c k, O. Buc hstab, M. Alb er, L. Ruff, G. Monta v on, K.-R. M¨ uller, T o w ard explainable artificial intelligence for precision pathology , Annual Review of P athology: Mechanisms of Disease 19 (1) (2024) null. [14] K. T. Sch¨ utt, F. Arbabzadah, S. Chmiela, K.-R. M¨ uller, A. Tk atc henko, Quantum-c hemical insights from deep tensor neural netw orks, Nature communications 8 (2017) 13890. [15] S. Bl ¨ uc her, L. Kades, J. M. Pa wlowski, N. Strodthoff, J. M. Urban, T ow ards no v el insigh ts in lattice field theory with ex- plainable machine learning, Phys. Rev. D 101 (2020) 094507. [16] H. Lee, P . Pham, Y. Largman, A. Y. Ng, Unsup ervised fea- ture learning for audio classification using con volutional deep belief netw orks, in: Adv ances in Neural Information Pro cessing Systems (NIPS), 2009, pp. 1096–1104. [17] G. Hinton, L. Deng, D. Y u, G. E. Dahl, A.-r. Mohamed, N. Jaitly , A. Senior, V. V anhouck e, P . Nguyen, T. N. Sainath, et al., Deep neural netw orks for acoustic mo deling in sp eec h recognition: The shared views of four research groups, IEEE Signal Pro cessing Magazine 29 (6) (2012) 82–97. [18] W. Dai, C. Dai, S. Qu, J. Li, S. Das, V ery deep conv olutional neural netw orks for raw wav eforms, in: 2017 IEEE Interna- tional Conference on Acoustics, Sp eec h and Signal Pro cessing, ICASSP 2017, New Orleans, LA, USA, March 5-9, 2017, 2017, pp. 421–425. [19] L. R. Rabiner, B.-H. Juang, F undamen tals of sp eec h recogni- tion, V ol. 14, PTR Prentice Hall Englew o od Cliffs, 1993. [20] M. Anusuy a, S. K. Katti, Sp eec h recognition by machine; a review, International Journal of Computer Science and Infor- mation Security 6 (3) (2009) 181–205. [21] J. J. Go dfrey , E. C. Holliman, J. McDaniel, Switch b oard: T ele- phone sp eec h corpus for research and developmen t, in: Acous- tics, Sp eec h, and Signal Pro cessing, 1992. ICASSP-92., 1992 IEEE In ternational Conference on, V ol. 1, IEEE, 1992, pp. 517– 520. [22] J. S. Garofolo, L. F. Lamel, W. M. Fisher, J. G. Fiscus, D. S. Pallett, Darpa timit acoustic-phonetic continous sp eec h corpus cd-rom. nist sp eec h disc 1-1.1, NASA STI/Recon technical re- port n 93. [23] V. Pana y otov, G. Chen, D. Pov ey , S. Khudanpur, Librisp eec h: an asr corpus based on public domain audio b ooks, in: Acous- tics, Sp eec h and Signal Pro cessing (ICASSP), 2015 IEEE Inter- national Conference on, IEEE, 2015, pp. 5206–5210. [24] Y. LeCun, The mnist database of handwritten digits, http://y ann.lecun.com/exdb/mnist/. [25] S. Hershey , S. Chaudh uri, D. P . W. Ellis, J. F. Gemmek e, A. Jansen, R. C. Mo ore, M. Plak al, D. Platt, R. A. Saurous, B. Seybold, M. Slaney , R. J. W eiss, K. W. Wilson, CNN ar- chitectures for large-scale audio classification, in: 2017 IEEE International Conference on Acoustics, Sp eec h and Signal Pro- cessing, ICASSP 2017, New Orleans, LA, USA, March 5-9, 2017, 2017, pp. 131–135. [26] W. Samek, G. Mon tav on, A. V edaldi, L. K. Hansen, K.-R. M¨ uller (Eds.), Explainable AI: Interpreting, Explaining and Vi- sualizing Deep Learning, V ol. 11700 of Lecture Notes in Com- puter Science, Springer, Cham, Switzerland, 2019. [27] N. Stro dthoff, P . W agner, T. Schaeffter, W. Samek, Deep learn- ing for ecg analysis: Benc hmarks and insigh ts from ptb-xl, IEEE Journal of Biomedical and Health Informatics 25 (5) (2021) 1519–1528. [28] D. Slijep cevic, F. Horst, B. Horsak, S. Lapuschkin, A.- M. Raberger, A. Kranzl, W. Samek, C. Breiteneder, W. I. Sch¨ ollhorn, M. Zepp elzauer, Explaining machine learning mo d- els for clinical gait analysis, ACM T ransactions on Computing for Healthcare 3 (2) (2022) 1–27. [29] S. Lapuschkin, S. W¨ aldc hen, A. Binder, G. Mon tav on, W. Samek, K.-R. M¨ uller, Unmasking clev er hans predictors and assessing what machines really learn, Nature comm unications 10 (1) (2019) 1096. [30] M. Kohlbrenner, A. Bauer, S. Nak a jima, A. Binder, W. Samek, S. Lapusc hkin, T ow ards best practice in explaining neural net- work decisions with lrp, in: 2020 In ternational Join t Conference on Neural Net works (IJCNN), IEEE, 2020, pp. 1–7. [31] S. Lapusc hkin, A. Binder, G. Mon tav on, K.-R. M¨ uller, W. Samek, The la yer-wise relev ance propagation to olbox for ar- tificial neural netw orks, Journal of Machine Learning Research 17 (114) (2016) 1–5. [32] M. Alb er, S. Lapuschkin, P . Seegerer, M. H¨ agele, K. T. Sc h ¨ utt, G. Monta v on, W. Samek, K.-R. M ¨ uller, S. D¨ ahne, P .-J. Kinder- mans, innv estigate neural netw orks!, J. Mach. Learn. Res. 20 (2018) 93:1–93:8. [33] C. J. Anders, D. Neumann, W. Samek, K.-R. M ¨ uller, S. La- puschkin, Soft ware for dataset-wide xai: F rom lo cal explana- tions to global insights with zennit, corelay , and virela y , ArXiv abs/2106.13200. [34] J. Jeyakumar, J. No or, Y.-H. Cheng, L. Garcia, M. B. Sriv as- tav a, How can i explain this to you? an empirical study of deep neural netw ork explanation metho ds, in: Neural Information Processing Systems, 2020. [35] B. W. Schuller, T. Virtanen, M. Riveiro, G. Rizos, J. Han, A. Mesaros, K. Drossos, T ow ards sonification in multimodal and user-friendly explainable artificial intelligence, in: Pro ceed- ings of the 2021 International Conference on Multimo dal Inter- action, ICMI ’21, Asso ciation for Computing Machinery , New Y ork, NY, USA, 2021, p. 788–792. [36] V. Haunsc hmid, E. Manilo w, G. Widmer, audiolime: Listenable explanations using source separation (2020). [37] A. B. Melchiorre, V. Haunschmid, M. Schedl, G. Widmer, Lemons: Listenable explanations for music recommender sys- tems, in: D. Hiemstra, M.-F. Mo ens, J. Mothe, R. Perego, M. Potthast, F. Sebastiani (Eds.), Adv ances in Information Re- triev al, Springer In ternational Publishing, Cham, 2021, pp. 531– 536. [38] A. W ullenw eb er, A. Akman, B. W. Sch uller, Coughlime: Soni- fied explanations for the predictions of covid-19 cough classifiers, in: 2022 44th Annual International Conference of the IEEE En- gineering in Medicine & Biology So ciet y (EMBC), 2022, pp. 1342–1345. [39] M. T. Rib eiro, S. Singh, C. Guestrin, ”why should i trust you?”: Explaining the predictions of any classifier, in: Pro- ceedings of the 22nd ACM SIGKDD International Conference on Knowledge Discov ery and Data Mining, KDD ’16, Asso cia- tion for Computing Mac hinery , New Y ork, NY, USA, 2016, p. 1135–1144. [40] J. Vielhab en, S. Bluecher, N. Strodthoff, Multi-dimensional con- cept discov ery (MCD): A unifying framework with completeness guarantees, T ransactions on Machine Learning Research. [41] R. Ac htibat, M. Dreyer, I. Eisen braun, S. Bosse, T. Wiegand, W. Samek, S. Lapuschkin, F rom attribution maps to human- understandable explanations through concept relev ance propa- gation, Nature Mac hine In telligence 5 (9) (2023) 1006–1019. [42] J. Parekh, S. Parekh, P . Mozharovskyi, F. d ' Alch ´ e-Buc, G. Richard, Listen to interpret: Post-hoc interpretabilit y for audio networks with nmf, in: S. Koyejo, S. Mohamed, A. Agar- wal, D. Belgrav e, K. Cho, A. Oh (Eds.), Adv ances in Neural Information Pro cessing Systems, V ol. 35, Curran Asso ciates, Inc., 2022, pp. 35270–35283. [43] A. Krizhevsky , I. Sutskev er, G. E. Hinton, Imagenet classifi- cation with deep conv olutional neural networks, in: Adv ances in Neural Information Pro cessing Systems (NIPS), 2012, pp. 1097–1105. [44] H. T raunm ¨ uller, A. Eriksson, The frequency range of the voice fundamental in the sp eec h of male and female adults, Unpub- 9 lished manuscript. [45] W. Samek, A. Binder, G. Monta von, S. Lapuschkin, K.-R. M¨ uller, Ev aluating the visualization of what a deep neural net- work has learned, IEEE T ransactions on Neural Netw orks and Learning Systems 28 (11) (2017) 2660–2673. [46] R. R. Hoffman, S. T. Mueller, G. Klein, J. Litman, Metrics for explainable ai: Challenges and prosp ects, arXiv preprint [47] S. Bec k er, M. Ac kermann, S. Lapuschkin, K. M ¨ uller, W. Samek, Interpreting and explaining deep neural netw orks for classifica- tion of audio signals, arXiv preprint [48] D. Po wers, Ev aluation: F rom precision, recall and f-measure to roc, informedness, markedness & correlation, Journal of Ma- chine Learning T echnologies 2 (1) (2011) 37–63. App endix A. Mo del details W e provide some further details on the arc hitecture and training proto cols for the audio classification mo dels in Section 3.2 . A udioNet ar chite ctur e. AudioNet consists of 9 weigh t lay- ers that are organized in series as follows 3 : conv3-100, maxp ool2, conv3-64, maxp ool2, con v3-128, maxp o ol2, conv3- 128, maxp ool2, conv3-128, maxpo ol2, conv3-128, max- p ool2, F C-1024, F C-512, F C-10 (digit classification) or F C-2 (sex classification). All con v olutional la y ers emplo y a stride of 1 and are activ ated via ReLU nonlinearities. Max-p ooling lay ers employ stride 2. Dataset splits. F or digit classification, the dataset was di- vided by sp eak er into five disjoint splits eac h con taining data of 12 speakers, i.e., 6,000 spectrograms p er split. In a five-fold cross-v alidation, three of the splits were merged to a training set while the other t wo splits resp ectiv ely serv ed as v alidation and test set. In a final, fold-dependent prepro cessing step the element-wise mean of the training set w as subtracted from all sp ectrograms. F or sex classification, the dataset was reduced to the 12 female sp eak ers and 12 randomly selected male speak- ers. These 24 sp eak ers w ere divided b y sp eak er in to four disjoin t splits eac h containing data from three female and three male sp eak ers, i.e., 3,000 sp ectrograms p er split. In a four-fold cross-v alidation, tw o of the splits w ere merged to a training set while the other t w o splits serv ed as v al- idation and test set. All other prepro cessing steps and net work training parameters were identical to the task of digit classification. Mo del tr aining. F or b oth the sex and digit classification task, AlexNet was trained with Sto c hastic Gradient De- scen t for 10,000 optimization steps at a batchsize of 100 sp ectrograms. The initial learning rate of 0.001 w as re- duced by a factor of 0.5 ev ery 2,500 optimization steps, momen tum was kept constant at 0.9 throughout training and gradien ts were clipp ed at a magnitude of 5. 3 Lay er naming pattern examples: conv3-100 – conv lay er with 3x1 sized kernels and 100 output c hannels. FC-1024 – fully connected lay er with 1024 output neurons In case of digit classification, AudioNet was trained with Sto c hastic Gradient Descent with a batch size of 100 and constant momentum of 0.9 for 50,000 optimization steps with an initial learning rate of 0.0001 whic h was low- ered every 10,000 steps by a factor of 0.5. In case of sex classification, training consisted of only 10,000 optimiza- tion steps where the learning rate is reduced after 5,000 steps. 10
Original Paper
Loading high-quality paper...
Comments & Academic Discussion
Loading comments...
Leave a Comment