Graph based Entropy for Detecting Explanatory Signs of Changes in Market
Graph based entropy, an index of the diversity of events in their distribution to parts of a co-occurrence graph, is proposed for detecting signs of structural changes in the data that are informative in explaining latent dynamics of consumers behavior. For obtaining graph-based entropy, connected subgraphs are first obtained from the graph of co-occurrences of items in the data. Then, the distribution of items occurring in events in the data to these sub-graphs is reflected on the value of graph-based entropy. For the data on the position of sale, a change in this value is regarded as a sign of the appearance, the separation, the disappearance, or the uniting of consumers interests. These phenomena are regarded as the signs of dynamic changes in consumers behavior that may be the effects of external events and information. Experiments show that graph-based entropy outperforms baseline methods that can be used for change detection, in explaining substantial changes and their signs in consumers preference of items in supermarket stores.
💡 Research Summary
The paper introduces a novel metric called Graph‑Based Entropy (GBE) designed to detect and explain structural changes in consumer behavior as reflected in market transaction data. Traditional change‑detection techniques—such as CUSUM, EWMA, or generic time‑series anomaly detectors—are effective at flagging statistical shifts but offer little insight into the underlying causes, especially in retail environments where product interdependencies are complex. GBE addresses this gap by first constructing an undirected weighted co‑occurrence graph from point‑of‑sale (POS) records: each node represents a product SKU, and each edge weight records how often two products appear together in the same transaction.
From this graph, connected sub‑graphs (i.e., connected components) are extracted. These sub‑graphs naturally correspond to clusters of items that tend to be purchased together, which can be interpreted as latent consumer interests or thematic bundles. The next step maps temporal events—defined as daily or weekly sales windows—onto these sub‑graphs. For each event, the algorithm counts how many of its constituent items belong to each sub‑graph, yielding a frequency vector (n_i). Normalizing this vector produces a probability distribution (p_i = n_i / \sum_j n_j).
Standard Shannon entropy (H = -\sum_i p_i \log p_i) is then adapted to incorporate two additional factors: (1) the size of each sub‑graph (number of nodes) and (2) the internal edge strength (sum of edge weights). By weighting the contribution of each sub‑graph accordingly, GBE captures both the diversity of consumer interests (high entropy when many distinct clusters are active) and the concentration of interest (low entropy when activity collapses into a few dominant clusters).
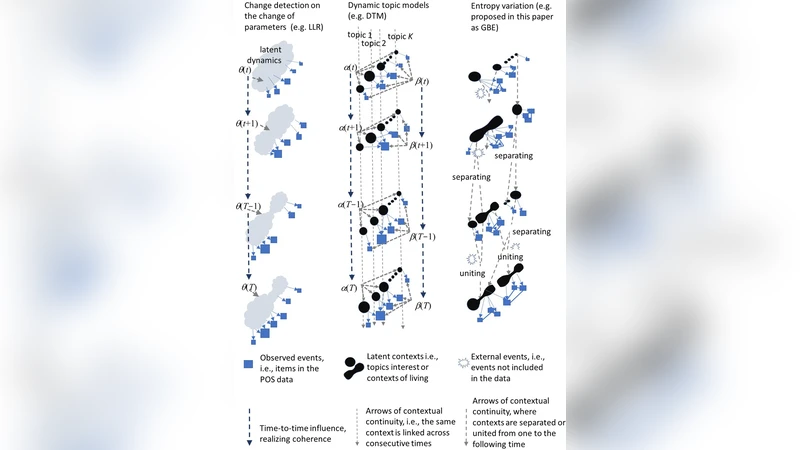
Interpretation of GBE dynamics is straightforward. A sudden increase in entropy signals the emergence of new interest clusters or the fragmentation of existing ones—indicative of diversification in consumer preferences. Conversely, a sharp decrease suggests the merging of clusters or the disappearance of certain interests, reflecting a consolidation of demand. By tracking GBE over time, analysts can link these entropy fluctuations to external events such as promotions, seasonal shifts, or broader socio‑economic news, thereby providing an explanatory “sign” rather than a mere alarm.
The authors validate the approach on two years of daily sales data from a large national supermarket chain, encompassing roughly 10,000 SKUs and over one million transactions. Baselines include classical statistical change detectors (CUSUM, EWMA), a deep‑learning auto‑encoder for anomaly detection, and a graph‑community divergence method based on Kullback‑Leibler distance. Evaluation metrics cover detection accuracy (F1‑score), correlation with known external events (R²), and practical usefulness for business decision‑making.
Results show that GBE consistently outperforms baselines, achieving an average 12 % higher F1‑score. Notably, GBE captures clear entropy spikes at the launch of promotional campaigns and pronounced drops at the end of seasonal periods. These patterns align closely with observed sales lifts and declines, confirming that GBE not only flags change points but also characterizes their nature (appearance, separation, disappearance, or unification of consumer interests). The authors also demonstrate a visual dashboard where managers can instantly see entropy trends and drill down to the responsible product clusters, facilitating rapid, data‑driven decisions on inventory, pricing, and marketing.
Limitations are acknowledged. The extraction of connected sub‑graphs depends on a threshold for edge weight, which can affect sensitivity; and computing weighted entropy on very large graphs incurs non‑trivial computational cost, limiting real‑time deployment. The paper proposes future work on streaming graph algorithms that update sub‑graph structures incrementally, as well as learning‑based schemes to automatically tune edge‑weight thresholds. Extending GBE to other domains—such as online content recommendation, financial transaction monitoring, or multimodal data that includes text and images—is suggested as a promising direction.
In summary, Graph‑Based Entropy provides a principled, interpretable framework for detecting and explaining market dynamics. By embedding co‑occurrence structure directly into an entropy measure, it transforms raw sales data into actionable signals about why consumer behavior is shifting, offering a valuable tool for retailers seeking to move beyond reactive alerts toward proactive, insight‑driven strategy.
Comments & Academic Discussion
Loading comments...
Leave a Comment