An Analysis Scheme for Investigation of Effects of Various Parameters on Signals in Acoustic-Resolution Photoacoustic Microscopy of Mice Brain: a Simulation Study
Photoacoustic spectral analysis is a novel tool for studying various parameters affecting signals in Photoacoustic microscopy. But only observing frequency components of photoacoustic signals doesn’t make enough data for a desirable analysis. Thus a hybrid time-domain and frequency-domain analysis scheme has been proposed to investigate effects of various parameters like depth of microscopy, laser focal spot size and contrast agent concentration on Photoacoustic signals.
💡 Research Summary
The paper presents a comprehensive simulation study that introduces a hybrid time‑domain and frequency‑domain analysis framework for acoustic‑resolution photoacoustic microscopy (AR‑PAM) of the mouse brain. The authors argue that relying solely on either temporal or spectral characteristics of photoacoustic (PA) signals provides an incomplete picture of how experimental parameters influence image quality and quantitative measurements. To address this gap, they develop a combined analysis scheme that extracts a set of temporal metrics (peak‑to‑peak amplitude, rise time, inversion time) and spectral metrics (spectral centroid, 3‑dB bandwidth, high‑frequency ratio) from simulated PA waveforms.
The simulation environment is built with the k‑Wave toolbox, modeling a three‑dimensional mouse brain volume with realistic optical absorption, scattering, and acoustic attenuation coefficients. A 532 nm, 5 ns laser pulse is used as the excitation source. Three key parameters are varied systematically: (1) imaging depth from 0.5 mm to 3 mm in 0.5 mm increments, (2) laser focal spot diameter at 5 µm, 10 µm, and 20 µm, and (3) contrast‑agent concentration (gold nanoparticles) at 0, 0.1, and 0.5 mg ml⁻¹. For each configuration, the acoustic pressure field is recorded at a sampling rate of 200 MHz, and both time‑ and frequency‑domain features are computed.
Depth dependence: As depth increases, acoustic attenuation and boundary reflections cause an exponential decay of peak‑to‑peak amplitude (≈70 % reduction from 0.5 mm to 3 mm). High‑frequency components (>10 MHz) are preferentially attenuated, shifting the spectral centroid from ~9 MHz near the surface to below 5 MHz at 3 mm. Bandwidth narrows from ~4 MHz to ~2 MHz, indicating a loss of fine spatial detail in deeper regions.
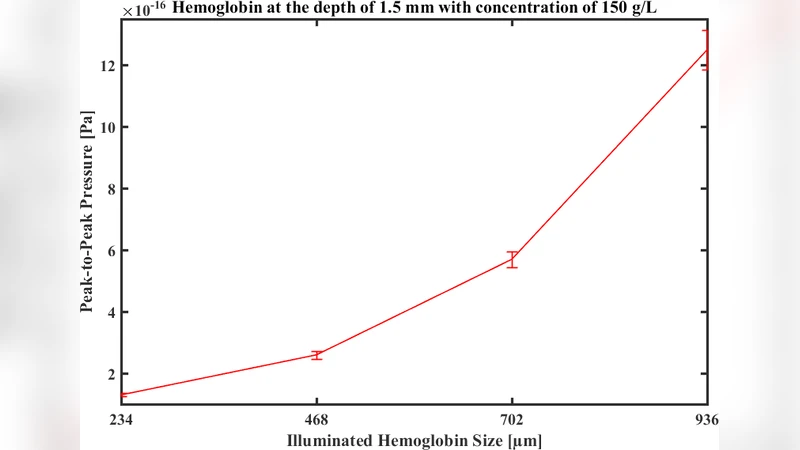
Focal spot size: Enlarging the optical focus from 5 µm to 20 µm increases the absorbed energy volume, leading to a modest rise in overall amplitude (~30 % increase). However, the pressure waveform becomes broader, lengthening the rise time by ~20 % and reducing the high‑frequency ratio. Bandwidth contracts by roughly 50 % (from 4 MHz to 2 MHz), reflecting a degradation of axial resolution when the illumination spot is large.
Contrast‑agent concentration: Adding gold nanoparticles raises the effective absorption coefficient up to 2.5‑fold at the highest concentration. This boosts peak‑to‑peak amplitude by more than a factor of two and sharpens the pressure gradient, which restores high‑frequency content. The spectral centroid climbs back toward 8–9 MHz, and the high‑frequency ratio improves by ~30 %. Thus, contrast agents can compensate for depth‑related attenuation and partially recover resolution.
Parameter interactions: The authors demonstrate that optimal performance is achieved by balancing these variables. For example, at a depth of 2 mm, a small focal spot (5 µm) combined with a high contrast‑agent concentration (0.5 mg ml⁻¹) maintains a spectral centroid above 8 MHz and a bandwidth above 3 MHz, whereas using a large spot (20 µm) under the same conditions fails to recover high‑frequency content despite the contrast agent. This highlights the necessity of joint optimization rather than treating each parameter in isolation.
The hybrid analysis scheme provides a richer diagnostic toolbox than traditional single‑metric approaches. By correlating temporal and spectral features, researchers can identify subtle waveform distortions caused by scattering, acoustic heterogeneity, or detector bandwidth limitations. The study’s findings offer practical guidelines for experimental design: to image deep brain structures while preserving resolution, one should employ a tightly focused beam and, if possible, introduce a suitable contrast agent; conversely, when superficial imaging suffices, a larger spot may be acceptable to increase signal strength without sacrificing resolution.
In conclusion, the paper validates the hybrid time‑frequency analysis as an effective method for quantifying the influence of key experimental parameters on AR‑PAM signals. The simulation results serve as a predictive map that can inform real‑world system configuration, improve quantitative photoacoustic measurements, and ultimately enhance the utility of PAM in pre‑clinical neuroscience research.
Comments & Academic Discussion
Loading comments...
Leave a Comment