Metrics for Graph Comparison: A Practitioners Guide
Comparison of graph structure is a ubiquitous task in data analysis and machine learning, with diverse applications in fields such as neuroscience, cyber security, social network analysis, and bioinformatics, among others. Discovery and comparison of structures such as modular communities, rich clubs, hubs, and trees in data in these fields yields insight into the generative mechanisms and functional properties of the graph. Often, two graphs are compared via a pairwise distance measure, with a small distance indicating structural similarity and vice versa. Common choices include spectral distances (also known as $\lambda$ distances) and distances based on node affinities. However, there has of yet been no comparative study of the efficacy of these distance measures in discerning between common graph topologies and different structural scales. In this work, we compare commonly used graph metrics and distance measures, and demonstrate their ability to discern between common topological features found in both random graph models and empirical datasets. We put forward a multi-scale picture of graph structure, in which the effect of global and local structure upon the distance measures is considered. We make recommendations on the applicability of different distance measures to empirical graph data problem based on this multi-scale view. Finally, we introduce the Python library NetComp which implements the graph distances used in this work.
💡 Research Summary
The paper addresses a fundamental problem in modern data science: how to quantitatively compare the structure of two graphs. Graphs appear in a wide range of domains—neuroscience, cybersecurity, social network analysis, bio‑informatics—where researchers are often interested in detecting or quantifying differences in modular communities, rich clubs, hubs, trees, or other topological motifs. The authors observe that, despite the proliferation of graph distance measures (spectral distances, node‑affinity based distances, feature‑based distances, etc.), there has been no systematic, large‑scale evaluation of how these measures behave across different structural scales and graph families.
To fill this gap, the authors first formalize notation (adjacency matrix A, combinatorial Laplacian L, normalized Laplacian L̃, eigen‑spectra λA, λL, λL̃) and define a taxonomy of distance measures. They separate distances into two broad categories: (1) spectral distances, which compare the eigen‑value vectors of a chosen matrix representation using ℓ₂ or more generally ℓₚ norms, and (2) feature‑based distances, which embed graphs into a vector of node‑affinity scores or global statistics and then apply standard vector distances (ℓ₂, cosine, etc.). The paper emphasizes that spectral distances are naturally multi‑scale: low‑order eigenvalues capture global structure such as community partitions, while high‑order eigenvalues encode local patterns like triangles or small motifs. By truncating the spectrum to the first k eigenvalues (k ≪ n) a practitioner can focus on the desired scale. The authors also note that spectral distances are not true metrics because co‑spectral non‑isomorphic graphs exist, although this phenomenon is rare for the large graphs used in their experiments.
The experimental methodology consists of two parts. First, a suite of synthetic random‑graph models is used as controlled proxies for real‑world topologies: Erdős–Rényi (ER) graphs (no pronounced structure), Barabási–Albert (BA) graphs (scale‑free, hub‑rich), Watts–Strogatz (WS) small‑world graphs (high clustering, short paths), and hierarchical modular graphs (explicit multi‑level community structure). For each model the authors vary parameters that affect global structure (e.g., number of communities, presence of hubs) and local structure (average degree, triangle density). They then sample many graph instances from each parameter setting and compute all distance measures between pairs drawn from the same model (intra‑model) and from different models (inter‑model). The resulting distance distributions reveal which measures are most sensitive to which structural changes.
Key findings from the synthetic experiments include:
- Laplacian spectral distance is highly sensitive to changes in community structure; the smallest non‑zero eigenvalues shift dramatically when the number or strength of clusters changes.
- Adjacency spectral distance reacts more to local perturbations such as adding or removing triangles; high‑order eigenvalues dominate the ℓ₂ norm in this case.
- Normalized Laplacian distance can compare graphs of different sizes, but its behavior can be distorted when degree distributions are extremely skewed.
- Feature‑based distances (e.g., based on random‑walk transition matrices or degree‑distribution vectors) provide a balanced response, excelling in scenarios where both global and local changes occur simultaneously.
- Node‑affinity distances (e.g., based on personalized PageRank vectors) are particularly effective for detecting change points in dynamic graphs because they do not require node correspondence.
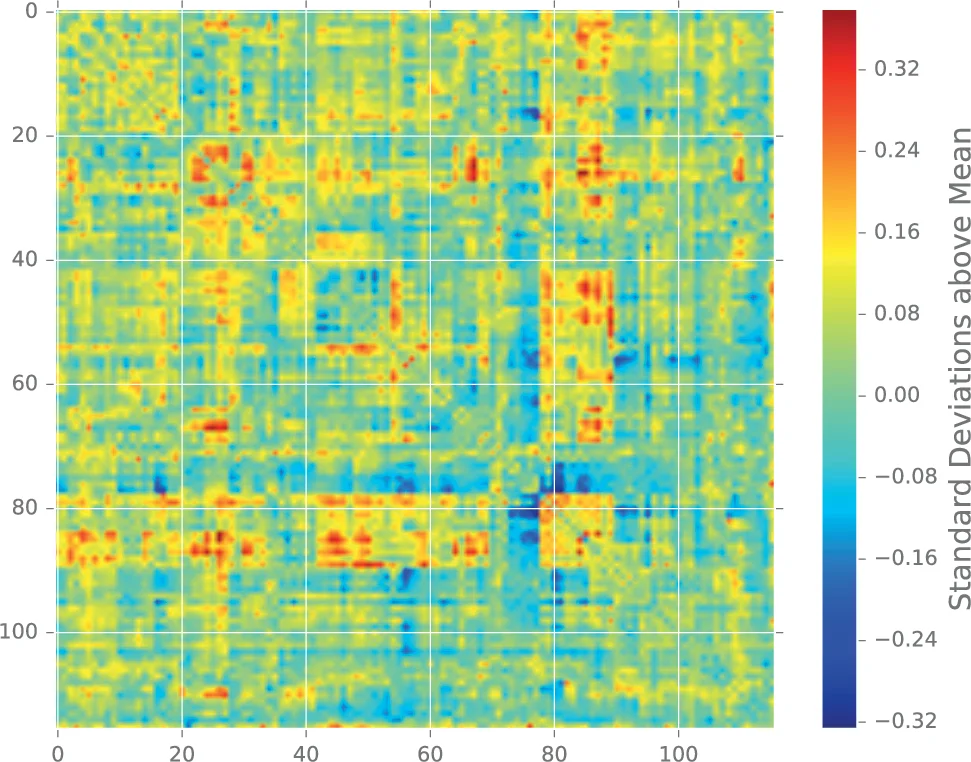
The second experimental part applies the same suite of distances to four real‑world networks: (i) a brain connectome (thousands of nodes, strong modularity), (ii) a cybersecurity traffic graph (heterogeneous, with attack‑induced structural shifts), (iii) a social network (mixed community‑hub structure), and (iv) a protein‑protein interaction network (multi‑scale functional modules). Results mirror the synthetic findings: Laplacian spectral distance best separates healthy vs. diseased brain graphs, while feature‑based and node‑affinity distances most reliably flag the onset of a cyber‑attack.
Based on these observations the authors propose practical guidelines:
- Global structure focus (communities, hubs): use Laplacian or normalized Laplacian spectral distances; optionally truncate to the first k eigenvalues to emphasize the low‑frequency part of the spectrum.
- Local structure focus (triangles, clustering, motif counts): use adjacency spectral distance or feature‑based distances that incorporate motif statistics.
- Dynamic change‑point detection or unlabeled graphs: prefer node‑affinity based distances (random‑walk, personalized PageRank) or feature‑based distances, as they do not require a node mapping and are computationally linear in the number of edges.
- Scalability: for large sparse graphs compute only a modest number of eigenvalues (e.g., k = 100) using Lanczos or implicitly restarted Arnoldi methods; this yields near‑linear runtime while preserving the essential spectral information.
Finally, the authors release NetComp, an open‑source Python library that implements all evaluated distances with a unified API. NetComp supports optional parameters such as the number of eigenvalues k, the ℓₚ norm exponent, and normalization choices, allowing users to tailor the distance computation to their specific scale of interest. The library also includes utilities for generating the synthetic graph ensembles used in the paper, facilitating reproducibility and further benchmarking.
In summary, the paper provides a thorough, multi‑scale empirical comparison of popular graph distance measures, clarifies their strengths and weaknesses across structural regimes, and delivers actionable recommendations and software tools for practitioners who need to compare large, sparse graphs in real‑world applications.
Comments & Academic Discussion
Loading comments...
Leave a Comment