Further insights into the interareal connectivity of a cortical network
Over the past years, network science has proven invaluable as a means to better understand many of the processes taking place in the brain. Recently, interareal connectivity data of the macaque cortex was made available with great richness of detail. We explore new aspects of this dataset, such as a correlation between connection weights and cortical hierarchy. We also look at the link-community structure that emerges from the data to uncover the major communication pathways in the network, and moreover investigate its reciprocal connections, showing that they share similar properties.
💡 Research Summary
The paper “Further insights into the interareal connectivity of a cortical network” presents a comprehensive network‑theoretic analysis of a high‑resolution inter‑areal connectivity dataset obtained from the macaque monkey. The dataset, originally reported in Markov et al. (2014), contains directed connections among 91 cortical areas, of which 29 were injected with retrograde tracers, yielding a 29 × 29 adjacency matrix with 536 directed edges. Each edge is characterized by two quantitative measures: the number of labeled neurons (NN) and the fraction of labeled neurons (FLN). FLN is a normalized weight that reflects the proportion of the total input a target area receives from a given source, independent of cortical volume or cell density. In addition, an approximate axonal distance is provided for each connection; the authors treat this distance as the inverse of FLN, so that stronger connections are assigned shorter lengths.
The authors first examine the distribution of incoming FLN values for each of the 29 injected areas. All areas display a characteristic pattern: a few very strong inputs (high FLN) coexist with a long tail of many weak inputs (FLN < 1 %). However, the shape of the distribution varies with hierarchical position. Primary visual cortex (V1) shows one or two dominant inputs, whereas higher‑order area 7A exhibits a more uniform spread of FLN values. To quantify hierarchical position, the authors define a “hierarchical distance” (HD) as the shortest directed path length from any of six primary sensory areas (V1, S1, Gu, ENTO, PIRI, Core) to a target area, where each edge length equals 1/FLN. Consequently, HD = 0 for the sensory seeds, and larger HD values indicate higher cortical levels. Using this metric, they rank the 29 injected areas and find a ranking broadly consistent with previous hierarchical classifications.
A key result is the strong negative correlation between HD and the mean incoming FLN of an area (Pearson r = ‑0.61). When the mean is computed only over the ten strongest incoming connections, the correlation strengthens to r = ‑0.79. This suggests that the distribution of incoming connection strengths alone can serve as a proxy for an area’s functional hierarchy: lower‑level areas receive a few very strong inputs, while higher‑level areas receive many modest inputs.
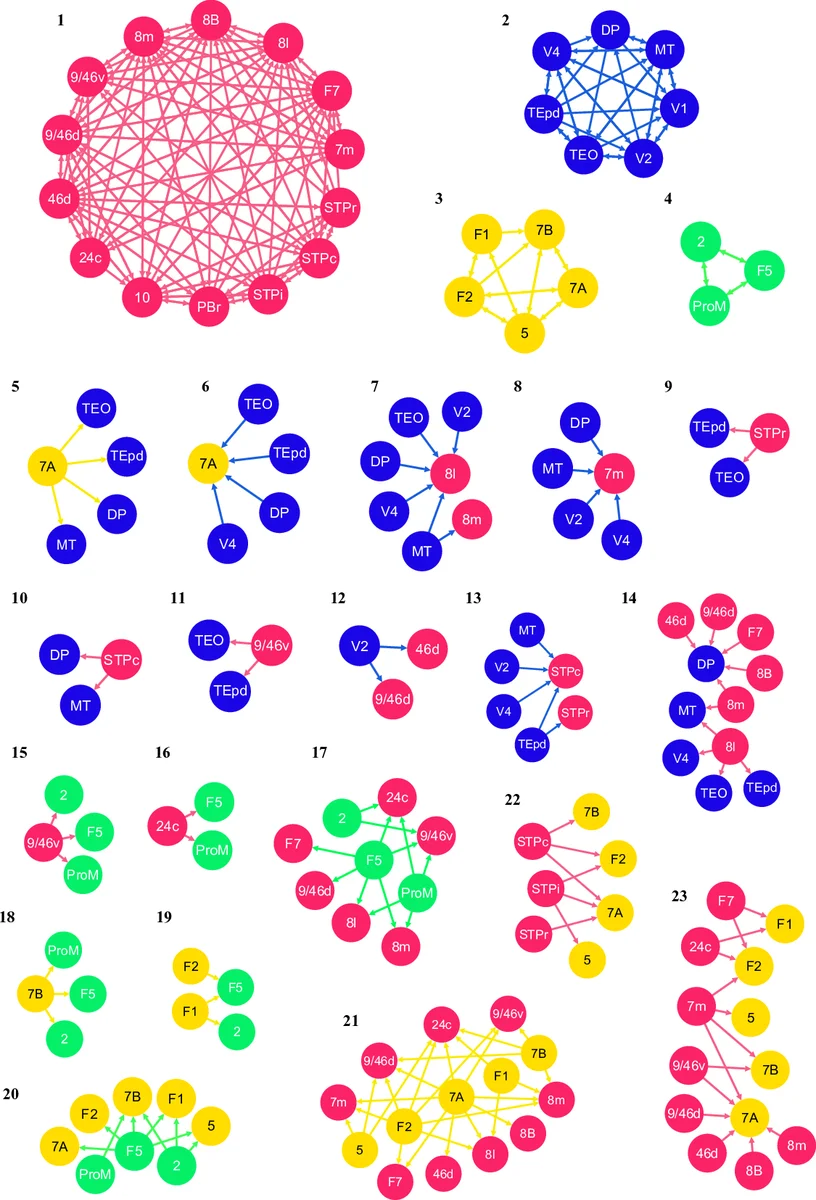
Recognizing the limitations of traditional node‑based community detection (which forces each node into a single module), the authors adopt a link‑community approach (Ahn et al., 2010). They modify the original similarity measure to incorporate edge weights (FLN) and directionality, and they allow reciprocal edges to be treated as distinct links. By sweeping an FLN threshold and selecting the value that maximizes the number of detected link communities, they identify a threshold of 0.000362. Using only edges with FLN ≥ 0.000362 yields 23 non‑overlapping link communities. The first four communities are densely connected subgraphs that correspond closely to previously reported node‑based modules (e.g., visual, dorsal, ventral streams). The remaining communities consist of sparser, often long‑range links that act as bridges between the dense modules, highlighting pathways that would be invisible in a pure node partition.
The paper then focuses on reciprocal connections, which constitute about 70 % of all directed edges. By comparing the FLN values, lengths, and NN counts of each reciprocal pair, the authors find that the two directions are highly similar: reciprocal links tend to have comparable strengths and short effective distances. This symmetry supports the notion that reciprocal wiring contributes to the robustness and integrative capacity of the cortical network.
In the discussion, the authors emphasize three main contributions: (1) a quantitative link between connection‑strength distribution and hierarchical level, providing a new metric for cortical hierarchy; (2) the demonstration that link‑community detection, especially when weighted and directed, yields richer functional insights than conventional node‑based modularity maximization; and (3) evidence that reciprocal connections are not random but systematically share high weights and short effective lengths, underscoring their role in bidirectional information flow.
The study acknowledges limitations, notably that only 29 of the 91 areas were directly injected, which restricts the completeness of the adjacency matrix. Nonetheless, the authors argue that the high reliability of the tracing experiments (all performed by the same laboratory) mitigates many sources of noise. Future work is suggested to incorporate laminar origin/termination data, extend the analysis to the full set of 91 areas, and explore how disease‑related alterations in FLN or reciprocity might impact network dynamics.
Overall, this paper provides a thorough, data‑driven exploration of macaque cortical connectivity, introducing methodological refinements (hierarchical distance, weighted link‑communities) that could be applied to other species, including humans, and offering new perspectives on how connection strength, directionality, and reciprocity shape the functional architecture of the brain.
Comments & Academic Discussion
Loading comments...
Leave a Comment