Critical Role of Docking Bay Assignment in the Performance of a Bus Rapid Transit System
Bus rapid transit (BRT) systems are a cost-effective public transportation solution moving millions of passengers every day. To optimize their operation, it is usual to implement macroscopic models that neglect the microscopic details of bus motion. In this work we show that the docking bay assignment (DBA) for the bus services at the stations, one of those disregarded microscopic details, has a large impact on the overall BRT performance. To evaluate the variations in the system’s performance upon changes on the DBA, we have simulated the entire operation of a simplified BRT system using a cellular automaton microsimulation scheme. We find that the critical service frequency, above which bus queues appear, strongly depends on the DBA at the busiest stations in the system, leading to significant performance differences. Smaller critical frequencies, and poorer performance, are observed as the service demand for the services sharing a docking bay increases. By approximating the frequency optimization problem, we show that, due to the limitations imposed to the optimal frequencies by the critical frequency, the service frequencies that minimize the total cost depend on the DBA at the busiest stations. This correlation becomes stronger as the passenger demand increases and as more importance is given to the passenger time in the total cost. Our results suggest that the frequency optimization problem in BRT systems must include the docking bay assignment at the busiest stations as an additional operation variable.
💡 Research Summary
The paper investigates how the assignment of docking bays to bus services at BRT stations (Docking Bay Assignment, DBA) influences overall system performance, an aspect that is typically ignored in macroscopic BRT optimization models. The authors develop a cellular‑automaton (CA) microsimulation of a simplified BRT corridor consisting of 46 stations, each equipped with three docking bays. Space is discretized into 3 m cells and time into 1 s steps. Buses are modeled as 30 m articulated vehicles that follow the Nagel‑Schreckenberg rules (acceleration, random braking, movement) and can change lanes only within predefined “approximation zones” near stations, subject to safety gap constraints.
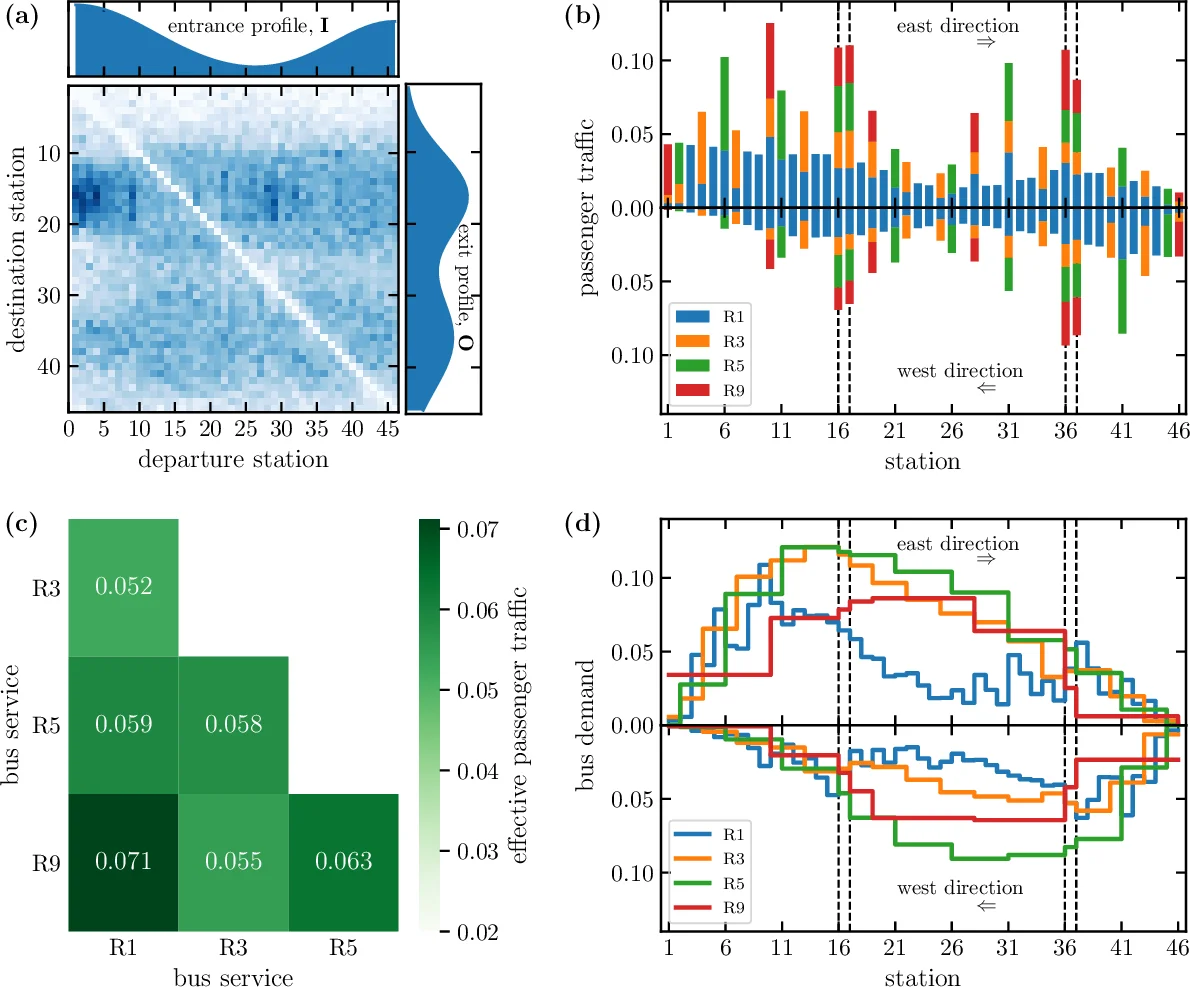
Passenger demand is introduced between 4 am and 10 am using a Poisson process whose mean follows a realistic, time‑varying demand curve derived from TransMilenio data. An entrance profile I and an origin‑destination (OD) matrix T define where passengers enter, their destinations, and the probability of each itinerary. Passengers are allowed up to two transfers; each itinerary receives a weight w = S + 3T + D (stops, transfers, distance) and is selected with probability proportional to e^(−w), reflecting a preference for fast trips.
Four bus services are simulated: a regular service (R1) stopping at every station and three limited‑stop services (R3, R5, R9) stopping every 3, 5, and 9 stations respectively, with all services sharing the four hub stations (16, 17, 36, 37). The study compares several DBA configurations, ranging from random sharing of bays to an optimized one‑to‑one mapping of services to bays at the busiest stations.
Key findings: the critical service frequency (f_c) – the minimum headway above which bus queues form – is highly sensitive to DBA. When multiple services compete for the same bay at a hub, f_c drops dramatically, causing queues even at modest frequencies (≈10 buses/h). Optimized DBA raises f_c by about 30 % and reduces average passenger waiting time and total operational cost. The authors formulate a cost function C = ∑_i (c_op·f_i + α·T_pass·W_i), where f_i are service frequencies, c_op is a per‑bus operating cost, α weights passenger time, and W_i is the average passenger travel‑time cost for service i. Adding the constraint f_i ≥ f_c yields a non‑linear optimization problem; solving it approximately shows that higher α (greater emphasis on passenger time) makes the optimal frequencies more dependent on DBA.
Sensitivity analyses with doubled and tripled passenger demand reveal that DBA’s impact grows non‑linearly with load. In high‑demand scenarios, even minor bay conflicts propagate queues throughout the corridor, underscoring the need for sufficient bay capacity or strategic reassignment in dense urban settings.
The authors conclude that any realistic BRT planning effort must incorporate microscopic queuing effects and treat DBA as an explicit decision variable alongside service frequencies and infrastructure design. They suggest future work on real‑time DBA adjustment algorithms and integration with multi‑lane traffic signal control.
Comments & Academic Discussion
Loading comments...
Leave a Comment