ElectroLens: Understanding Atomistic Simulations Through Spatially-resolved Visualization of High-dimensional Features
In recent years, machine learning (ML) has gained significant popularity in the field of chemical informatics and electronic structure theory. These techniques often require researchers to engineer abstract “features” that encode chemical concepts into a mathematical form compatible with the input to machine-learning models. However, there is no existing tool to connect these abstract features back to the actual chemical system, making it difficult to diagnose failures and to build intuition about the meaning of the features. We present ElectroLens, a new visualization tool for high-dimensional spatially-resolved features to tackle this problem. The tool visualizes high-dimensional data sets for atomistic and electron environment features by a series of linked 3D views and 2D plots. The tool is able to connect different derived features and their corresponding regions in 3D via interactive selection. It is built to be scalable, and integrate with existing infrastructure.
💡 Research Summary
ElectroLens is a novel open‑source visualization platform designed to bridge the gap between high‑dimensional, spatially‑resolved machine‑learning (ML) features and the underlying atomistic or electronic structures they describe. The authors identify a critical bottleneck in current ML workflows for chemistry and electronic‑structure theory: while sophisticated fingerprinting schemes generate tens to hundreds of numerical descriptors per atom or per voxel of electron density, researchers lack an intuitive way to map these abstract vectors back onto the physical system. This disconnect hampers model debugging, feature engineering, and the incorporation of chemist intuition into data‑driven pipelines.
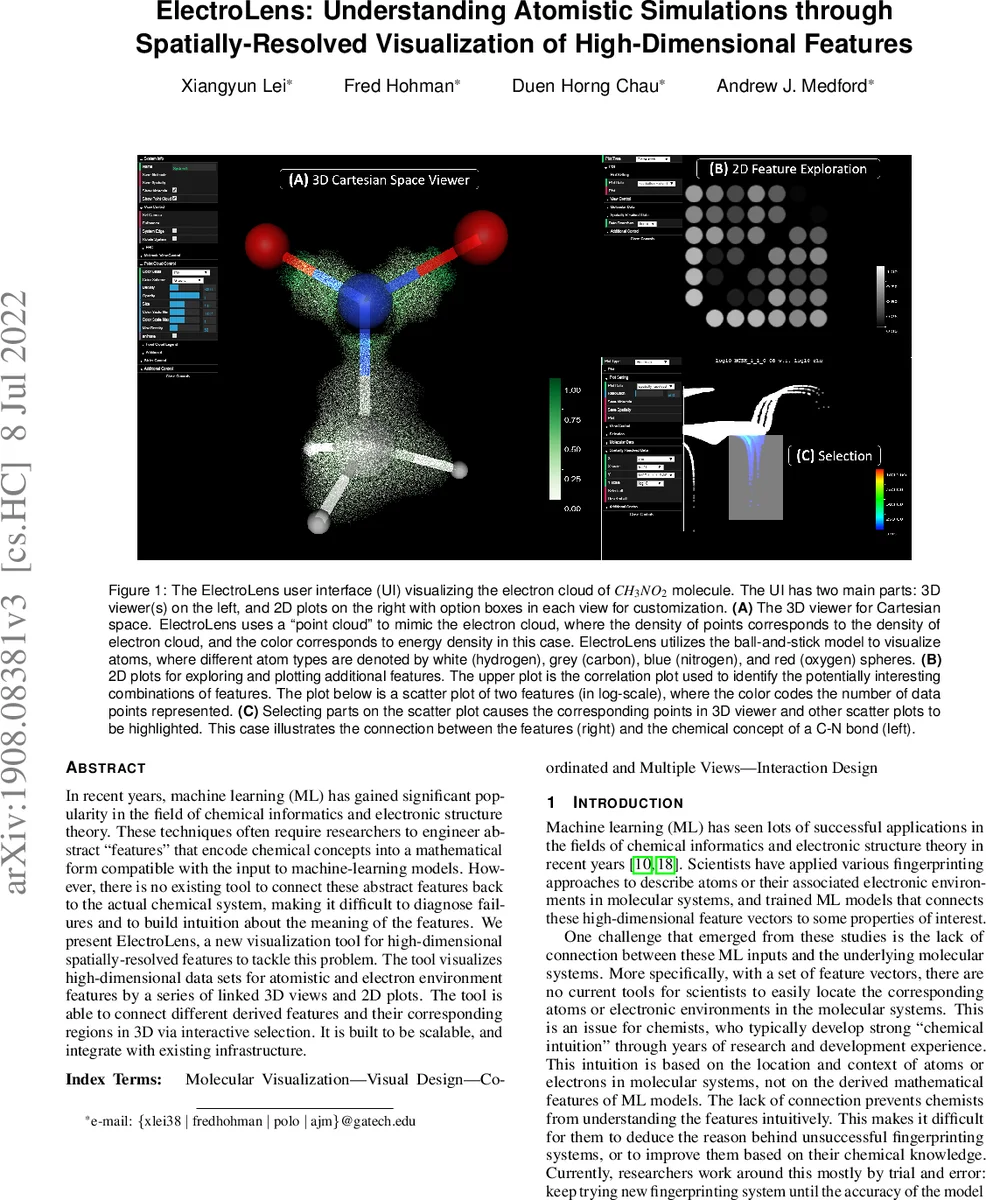
The system consists of two tightly coupled views. The left pane presents a 3‑dimensional scene rendered with WebGL (Three.js) inside an Electron desktop application. Atomic positions are shown using a conventional ball‑and‑stick model, where size and color can encode two user‑selected features (by default element type). Electronic environments are visualized as a point‑cloud that mimics an electron cloud; the density of points reflects the underlying electron density, while color encodes a third feature such as energy density or a learned descriptor. Users can adjust point size, transparency, color maps, and even slice the cloud to explore cross‑sections.
The right pane hosts a suite of 2‑dimensional plots that enable exploration of the full feature space. Three plot types are provided: (1) a correlation matrix heat map that quickly reveals low‑correlation feature pairs (high information content), (2) scatter‑plot heat maps where any two features can be plotted on the axes and point density is shown via a color scale, and (3) dimensionality‑reduction plots (PCA) that project the high‑dimensional data onto two principal components for visual inspection. Crucially, selections made in any 2‑D plot are instantly reflected in the 3‑D view: points that satisfy the selection criteria are highlighted across all displayed molecular systems. This bidirectional linking implements design challenge C2 (feature ↔ Cartesian space) and provides a powerful “what‑if” analysis loop.
ElectroLens also supports simultaneous visualization of multiple molecular systems. By pooling data from several structures (e.g., CO₂, N₂O, HCOOH) into a single set of 2‑D plots, users can assess whether a particular descriptor consistently corresponds to a chemical motif across different contexts (design challenge C3). When a region is selected, the corresponding spatial regions in every system are highlighted, enabling rapid cross‑system validation of hypotheses.
Scalability is achieved through GPU‑accelerated rendering and an efficient memory model where each data point is stored only once and shared among all views. Benchmarks show that a commodity laptop can render over one million points at 60 frames‑per‑second, satisfying design challenge C5 (large datasets).
Integration with existing computational chemistry workflows is realized via Python bindings that wrap the CEF‑Python library and mimic the API of the Atomic Simulation Environment (ASE). Because ASE already provides parsers for a wide range of file formats (CIF, XYZ, VASP, etc.), ElectroLens can ingest data directly from typical simulation pipelines, addressing design challenge C6.
Two case studies illustrate the practical impact. In the first, the authors trained a neural network to predict exchange‑correlation energy from electron density. By plotting model error versus density and versus the derivative of density, then selecting the high‑error tail, they observed that the problematic points clustered around specific electron‑density regions (e.g., near atomic cores). The 3‑D view highlighted those core regions, revealing that the model struggled with steep density gradients—a insight that would be difficult to obtain from scalar error metrics alone.
In the second case, a machine‑learned force field was examined for failure modes in water clusters. Symmetry‑function descriptors were plotted, and selections of outlier points in the 2‑D scatter plots caused the corresponding atoms to be highlighted in the 3‑D view. This immediately identified problematic local environments (e.g., under‑coordinated hydrogen atoms) and guided the researchers to augment the training set with more representative configurations.
Overall, ElectroLens delivers a cohesive visual analytics environment that satisfies six identified design challenges: high‑dimensional feature visualization, spatial linking, multi‑system comparison, simultaneous atom/electron rendering, large‑scale performance, and seamless integration with existing tools. By making the abstract feature space tangible, it empowers chemists and materials scientists to apply domain knowledge directly to ML model development, debugging, and interpretation, thereby accelerating discovery in computational chemistry and materials science.
Comments & Academic Discussion
Loading comments...
Leave a Comment