Forecast Aggregation via Peer Prediction
Crowdsourcing enables the solicitation of forecasts on a variety of prediction tasks from distributed groups of people. How to aggregate the solicited forecasts, which may vary in quality, into an accurate final prediction remains a challenging yet c…
Authors: Juntao Wang, Yang Liu, Yiling Chen
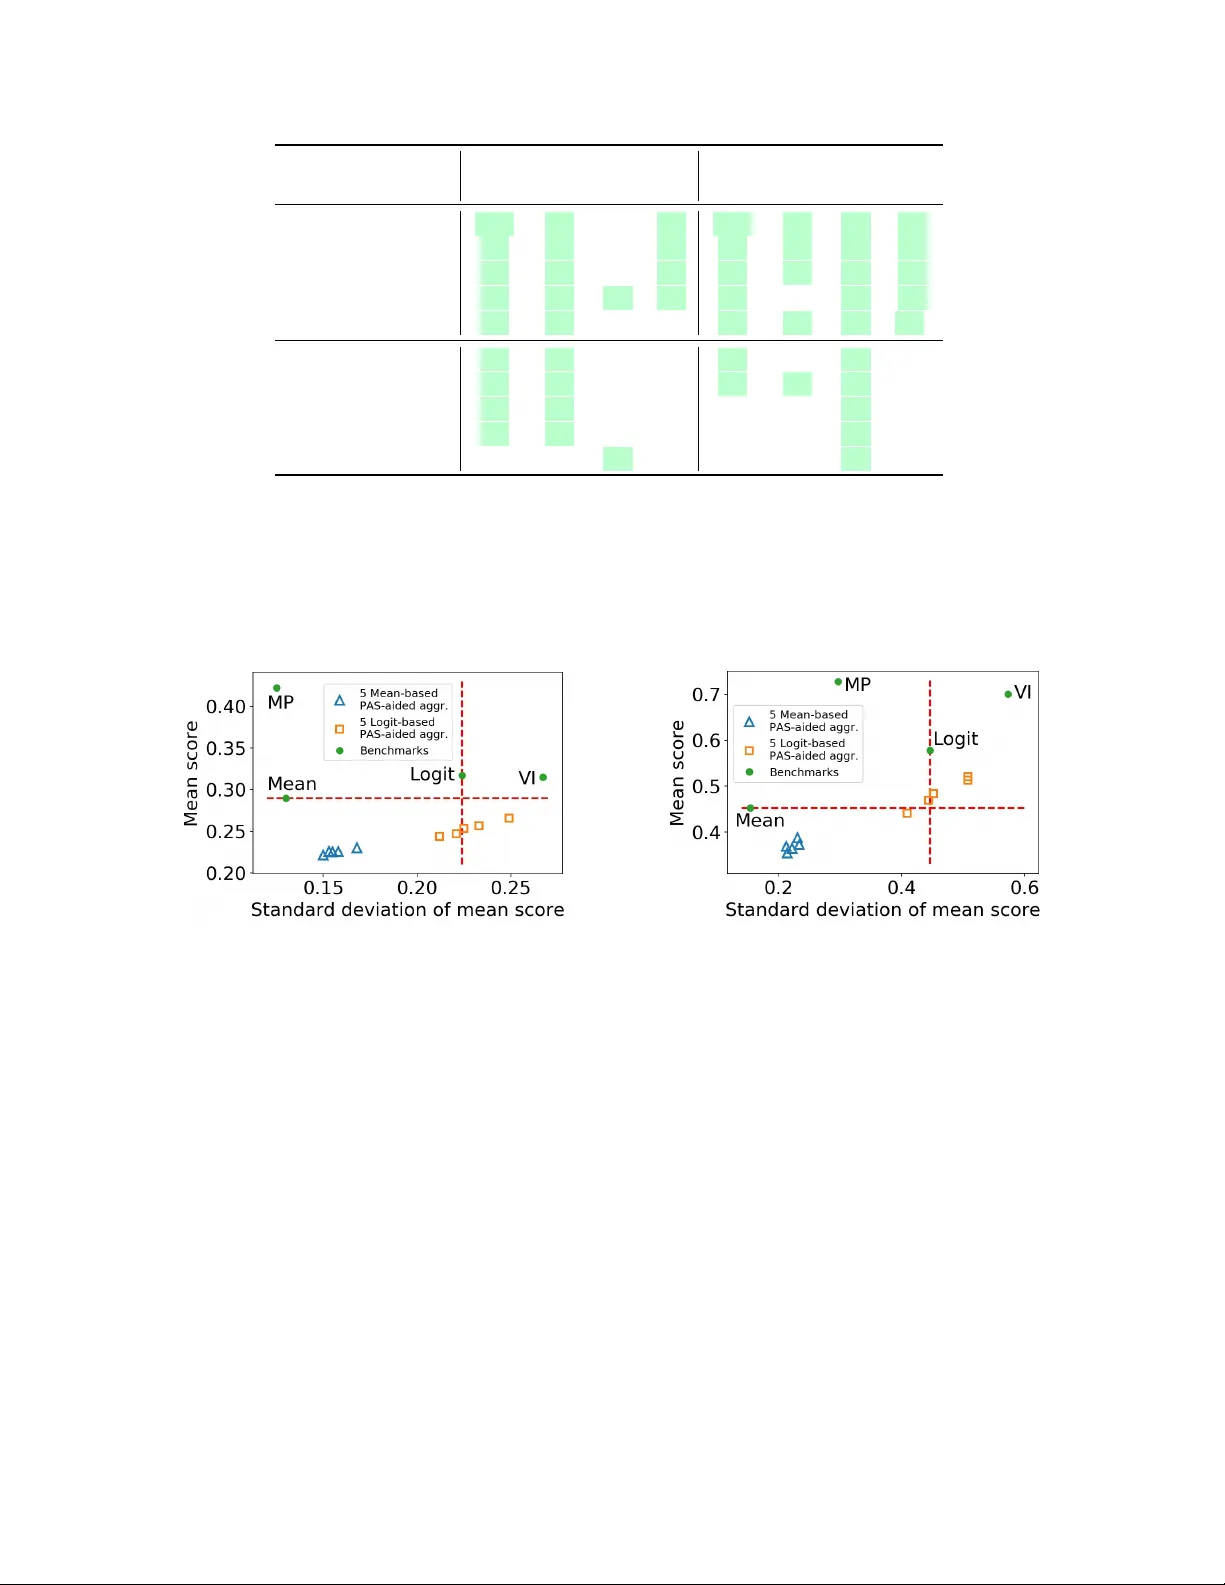
F orecast Aggregation via P eer Prediction Jun tao W ang Harv ard Univ ersity juntaowang@g.harvard.edu Y ang Liu UC Santa Cruz yangliu@ucsc.edu Yiling Chen Harv ard Univ ersity yiling@seas.harvard.edu Abstract Cro wdsourcing enables the solicitation of forecasts on a v ariet y of prediction tasks from distributed groups of p eople. Ho w to aggregate the solicited forecasts, which may v ary in qualit y , into an accurate final prediction remains a challenging yet critical question. Studies hav e found that weighing exp ert forecasts more in aggregation can improv e the accuracy of the aggregated prediction. How ever, this approac h usually requires access to the historical p erformance data of the forecasters, which are often not av ailable. In this paper, we study the problem of aggregating forecasts without having historical p erformance data. W e prop ose using p eer prediction metho ds, a family of mechanisms initially designed to truthfully elicit priv ate information in the absence of ground truth verification, to assess the exp ertise of forecasters, and then using this assessmen t to impro ve forecast aggregation. W e ev aluate our p eer- prediction-aided aggregators on a diverse collection of 14 human forecast datasets. Compared with a v ariet y of existing aggregators, our aggregators achiev e a significan t and consistent improv ement on aggregation accuracy measured by the Brier score and the log score. Our results reveal the effectiv eness of iden tifying experts to impro ve aggregation even without historical data. 1 In tro duction F orecasting is one of the main areas where collectiv e in telligence is frequently garnered. In crowd forecasting, a po ol of h uman participants are in vited to mak e forecasts on a set of prediction questions of in terest and the solicited forecasts are then aggregated to obtain final predictions. Crowd forecasting has been widely applied in solving c hallenging forecasting tasks suc h as forecasting geopolitical even ts ( A tanasov et al. , 2016 ), predicting the replicabilit y of so cial science studies ( Liu et al. , 2020a ), diagnosing skin lesions ( Prelec et al. , 2017 ) and lab eling training sets for machine classifiers ( Liu et al. , 2012 ). Aiming to more effectiv ely leverage collective intelligence in forecasting, w e fo cus on impro ving multi- task forecast aggregation in this paper. W e consider a minimal-information setting where eac h participant offers a single prediction to eac h forecasting question of a subset of total forecasting questions, and no other information suc h as participan ts’ historical p erformance is a v ailable. By exploring only hidden information in participan ts’ predictions o ver multipl e questions, w e dev elop a family of aggregation metho ds that robustly impro ves the accuracy of the final predictions across a v ariet y of datasets. The minimal-information setting requires the least effort to collect information and put almost no con- strain ts on crowdsourcing workflo w. Our metho ds can b e used during the cold-start stage of long-term forecasting ( A tanasov et al. , 2016 ), where no ev ent has b een resolved yet to ev aluate participants’ p erfor- mance. They can also serv e as elegan t benchmarks for dev eloping more complex aggregators when additional information is av ailable. Our approac h is to leverage p eer forecasts to generate a proxy ev aluation of each forecaster’s p erfor- mance that p oten tially p ositiv ely correlates with her true performance. W e call suc h pro xy ev aluations p eer assessmen t scores (P AS). W e then develop P AS-aided aggregators that build up on simple aggregators, suc h as mean. Our P AS-aided aggregators set larger weigh ts in the simple aggregators on predictions from forecasters who obtain higher P AS. The question then b oils down to how to generate credible P AS ev aluations. W e are blessed by recent adv ances in the p e er pr e diction literature. Peer prediction mechanisms are a family of reward mechanisms designed to use only p eer reports on forecasting questions to motiv ate crowd forecasters to provide truthful or high-quality forecasts in the absence of the ground truth ( Miller et al. , 2005 ). While they are primarily 1 dev elop ed for the purp ose of forecast elicitation, Liu et al. ( 2020b ) and Kong ( 2020 ) rev ealed theoretically that the rewards given by their mec hanisms correlate p ositiv ely with the prediction accuracy (defined using the ground truth) under certain conditions. Liu et al. ( 2020b ) also sho wed empirical evidence of this correlation for several other p eer prediction mechanisms.These mechanisms are potentially to ols to use to construct the P AS-aided aggregators. In this pap er, we explore the use of five recen tly proposed p eer prediction mec hanisms ( Radano vic et al. , 2016 ; Shnayder et al. , 2016 ; Witko wski et al. , 2017 ; Liu et al. , 2020b ; Kong , 2020 ) as P AS. After sho wing their theoretical prop erties in recov ering the forecasters’ true p erformance, w e thoroughly examine the empirical performance of P AS-aided aggregators built up on them. W e emplo y 14 real-w orld h uman forecast datasets and tw o widely-adopted accuracy metrics, the Brier score and the log score. W e compare the p erformance of these P AS-aided aggregators with four representativ e existing aggregators that neither require knowing the ground truth of resolv ed historical forecasting questions: the mean aggregator ( Jose and Winkler , 2008 ; Mannes et al. , 2012 ), the logit-mean aggregator, which is based on the idea of extremization of predictions ( Allard et al. , 2012 ; Satop¨ a¨ a et al. , 2014a ; Baron et al. , 2014 ), a statistical-inference-based aggregator ( Liu et al. , 2012 ), and the minimal piv oting aggregator, whic h is based on “surprising popularity .” ( Prelec et al. , 2017 ; Palley and Soll , 2019 ) Our results reveal: 1) Though each of the ab o ve four existing aggregators has strong p erformance on sp ecific datasets, none of them has consisten t, robust p erformance across all datasets. 2) In con trast, our P AS-aided aggregators demonstrate a significant and consistent improv ement in the aggregation accuracy compared to the four existing aggregators. 3) These P AS-aided aggregators adopt a v ery intuitiv e ( ex- plainable ) and straightforw ard ( generic al ly applic able ) strategy to incorp orate P AS: select top forecasters according to their P AS and apply the mean or the logit-mean aggregator to the predictions of these selected forecasters. 4) Moreov er, this improv ement is observed when an y one of the five p eer prediction mec hanisms is used as P AS, and there is no statistically significant difference found in the impro vemen ts when different P AS are used. 5) The ab o ve results demonstrate the p ossibilit y of discov ering a smaller but smarter crowd in real-time forecast aggregation without accessing any ground truth outcomes. W e wan t to emphasize that aggregation without access to historical ground truth information is an incredibly challenging problem. One cannot exp ect that there is a universal aggregator that has the b est p erformance on all datasets. There isn’t. Inste ad, w e hop e to devise aggregators that p erform well and robustly on different datasets. The significance of our work is three-fold. First, it provides a framework to select forecasts to ac hieve more robust and accurate aggregation.Second, our metho d can b e used as a b ooster to aggregators in almost all multi-task forecast aggregation scenarios since it has minimal information requiremen ts. Third, our w ork reveals a new and meaningful application of p eer prediction metho ds - as scoring mechanisms to identify top exp erts and to improv e forecast aggregation. 2 Related W ork Our work considers the multi-task forecast aggregation setting, where there is a set of (indep enden t) judge- men t questions to forecast and eac h participan t forecasts on m ultiple questions. A large part of the forecast aggregation literature considers the single-task setting, where all participants predict ab out a simple fore- casting question. The metho ds and aggregators designed for the single-task setting are also often used in the multi-task forecast setting directly . Single-task aggregators include the mean, median, their trimmed v arian ts ( Galton , 1907 ; Clemen , 1989 ; Jose and Winkler , 2008 ; Mannes et al. , 2012 ), the aggregators that extremize the mean predictions ( Ranjan and Gneiting , 2010 ; Baron et al. , 2014 ; Allard et al. , 2012 ; Satop¨ a¨ a et al. , 2014a ), and the “surprising-p opularity”-based aggregators ( Prelec et al. , 2017 ; Palley and Soll , 2019 ; P alley and Satop¨ a¨ a , 2020 ), which use the additionally collected participants’ estimates about the other participan ts’ forecasts to help aggregation. The aggregators proposed in our w ork also use single-task ag- gregators as building blo c ks. When there are multiple forecasting questions, the aggregation problem can also b e viewed as learning a universal pattern b et ween forecasters’ predictions and the latent ground truth across forecasting questions. Therefore, statistical inference metho ds ( Liu et al. , 2012 ; Orav ecz et al. , 2014 ; Lee and Danileiko , 2014 ; McCo y and Prelec , 2017 ) are also customized and dev elop ed to aggregate forecasts in the m ulti-task setting. Our work includes b oth single-task aggregators and statistical-inference-based ag- gregators as b enchmarks. W e introduce more details ab out differen t aggregators in the b enc hmark selection 2 part in Section 6.1 . Our prop osed aggregators use the heterogeneity of participants’ exp ertise to improv e aggregation accu- racy . There is a large literature, including ( Clemen and Winkler , 1986 ; Goldstein et al. , 2014 ; Aspinall , 2010 ; Budescu and Chen , 2015 ; Satop¨ a¨ a et al. , 2014b ), which explores this idea but in the case where forecast- ers’ historical performance is av ailable, or where the forecasting is conducted in a dynamic manner where forecasting questions are resolved sequentially , and the resolution can be used to aggregate unresolved ques- tions. In con trast, we consider the scenario where no ground truth information is av ailable, i.e., aggregated predictions are requested b efore any forecasting question is resolved. W ang et al. ( 2011 ) consider the same scenario. Ho wev er, they assume that there exists a kno wn logical dep endence betw een the outcomes of differen t forecasting questions. Our idea of p eer assessment scores, whic h aims to measure a forecaster’s prediction accuracy in the absence of ground truth information, is derived from multi-task p eer prediction mechanisms ( Prelec , 2004 ; Miller et al. , 2005 ; Witko wski and Park es , 2012 ; Radanovic et al. , 2016 ; Kong et al. , 2016 ; Agarwal et al. , 2017 ; Witko wski et al. , 2017 ; Go el and F altings , 2019 ; Liu et al. , 2020b ), a family of mec hanisms used to determine forecasters’ rew ards on multiple forecasting questions b efore any question resolv es. F or binary- v ote judgemen t questions, Kurvers et al. ( 2019 ) prop osed a measure of similarity of forecasters’ votes, which is also empirically correlated with forecasters’ true accuracy . In this work, w e inv estigate the use of five represen tative p eer prediction metho ds to generate P AS. 3 Setting W e consider the scenario with a set N of agents recruited to mak e forecasts on a set M of even ts (forecasting questions). Ev ents. W e consider binary even ts (sometimes called tasks). 1 Eac h ev ent i is represented by a random v ariable Y i ∈ { 0 , 1 } , denoting the ev ent outcome (ground truth). W e assume that Y i is dra wn from a Bernoulli distribution Bern( q i ) with an unkno wn q i ∈ [0 , 1]. T o illustrate, consider an even t i as “Will Demo crats win the 2024’s election?” The outcome is either “Y es” ( Y i = 1) or “No” ( Y i = 0), and q i = 0 . 5 means that the outcome is random (at the time of forecasting) and the Demo crats has 50% chance to win. Agen ts. Eac h agent ( indexed by j ) forecasts on a subset of ev ents M j ⊆ M . M j could either b e assigned b y the principal or b e constructed by agent j herself. W e use N i ⊆ N to denote the subset of agents who forecast on ev ent i . W e use p i,j ∈ [0 , 1] ∪ {∅} to denote the probabilistic prediction made b y agent j on ev ent i for Y i = 1, with p i,j = ∅ denoting agen t j pro vides no forecast on even t i . Meanwhile, w e let p i = ( p i,j ) j ∈N i and P = { p i,j } i ∈M ,j ∈N . The forecast aggregation problem. The forecast aggregation problem is to design an aggregation function F : ([0 , 1] ∪ {∅} ) |M|×|N | → [0 , 1] |M| , which maps the prediction profile P of all agents on all ev ents to an aggregated prediction profile { ˆ q i } i ∈M , where ˆ q i ∈ [0 , 1] is the aggregated prediction for even t i . The design goal is to make the aggregated predictions as accurate as p ossible. The accuracy of predictions is ev aluated against the corresp onding ground truth of the forecasted even ts, whic h are exp ected to be revealed some time after the aggregation. Our aggregators will use t wo p opular existing single-task aggregators as building blocks: the mean ( Mean ) and the logit-mean ( Logit ) ( Satop¨ a¨ a et al. , 2014a ). Mean has empirically pro ved robustness ( Jose and Winkler , 2008 ), while Logit extremizes the predictions of Mean and demonstrates significantly higher accuracy on some human forecast datasets ( Satop¨ a¨ a et al. , 2014a ). W e introduce the weigh ted versions of the tw o aggregators that w e will use as follows. F or a single even t i with a prediction profile p i and a w eight v ector ( w j ) j ∈N i , we ha ve • F Mean i ( p i ) = P j ∈N i w j p i,j , • F Logit i ( p i ) = sigmoid α |N i | P j ∈N i w j logit( p ij ) and α = 2 ( Satop¨ a¨ a et al. , 2014a ). The Logit aggregator first maps probabilistic predictions in to the log-odds space using the logit function, the in verse function of the sigmoid function. It then tak es the weigh ted av erage and applies a scaling factor to 1 Our methods and results can b e extended to multi-outcome even ts in tw o wa ys. Please refer to Section 6.4 . 3 Abbr. F ull name Abbr. F ull name DMI Determinan t mutual information mec hanism SPSR Strictly proper scoring rules CA Correlated agreemen t mec hanism P AS P eer assessment sores PTS P eer truth serum mechanism BS Brier score SSR Surrogate scoring rule mec hanism VI V ariational inference aggregator PSR Pro xy scoring rule mechanism MP Minimal piv oting aggregator T able 1: The main abbreviations and the corresp onding full names used in this pap er further extremize the prediction. Finally , it maps the prediction bac k into a probabilit y using the sigmoid function. Empirically , Satop¨ a¨ a et al. ( 2014a ) recommended a scaling factor of 2. Prediction accuracy metrics The accuracy of forecasts is t ypically ev aluated using the strictly prop er scoring rules (SPSR) ( Gneiting and Raftery , 2007 ). Two widely-adopted rules are the Brier score and the log score. W e use them to ev aluate our aggregators’ performance in our exp erimen ts. F or a prediction ˆ q i and ground truth Y i on an even t i , we ev aluate the tw o scores as follows: • Brier score 2 : S Brier ( ˆ q i , Y i ) = 2( ˆ q i − Y i ) 2 . • Log score: S log ( ˆ q i , Y i ) = − Y i log( ˆ q i ) − (1 − Y i ) log (1 − ˆ q i ). With ab o ve formulas, a lo wer scores refer to a higher accuracy . The Brier score ranges from 0 to 2. The log score ranges from 0.1 to 4.61. 3 An uninformative prediction of 0.5 receives a Brier score of 0.5 and a log score of 0.69 regardless of the even t outcome. 4 Aggregation Using P AS W e now formalize the notion of p e er assessment sc or es (P AS) , and introduce our aggre gation framew ork that uses P AS. W e defer the introduction of concrete instantiations of P AS that lead to go o d aggregation p erformance in to the next section. W e list the abbreviations that we frequen tly use hereafter in T able 1 . In short, and in different to the true accuracy that is ev aluated against the ground truth, P AS as- sess a prediction against the other agen ts’ predictions. Thus, unlike the true accuracy , P AS can be c om- puted for all crowdsourcing forecasting scenarios, with no additional information (e.g., the ground truth) required. F ormally , a p eer assessment score on an even t set M and an agen t set N is a scoring function R : ([0 , 1] ∪ {∅} ) |M|×|N | → [0 , 1] |N | that maps the prediction profile P of all agents on all even ts in to a score s j for each agen t j ∈ N . The score s j should reflect the av erage prediction accuracy of agent j . Bearing this notion of P AS in mind, we in tro duce our aggregation framework. The intuition of our framew ork is straightforw ard: In aggregation, if we rely more on predictions from agents with higher accuracy indicated by P AS, w e shall hop efully derive more accurate aggregated predictions. In general, w e can incorp orate P AS into an aggregation pro cess via three steps: 1. Compute a P AS score s j for each agen t j ∈ N . 2. Cho ose a weigh t scheme that weigh t agents’ predictions based on the scores s j , j ∈ N . 3. Cho ose a base aggregator and apply the weigh t scheme to generate final predictions. Eac h step features multiple design choices, which will influence the aggregation accuracy and can b e cus- tomized case by case. In Step 1, there are m ultiple alternativ es to compute P AS. Ideally , the computed P AS should reflect the true accuracy of agents. In Step 2, the weigh t scheme can b e, for example, either ranking the agents by P AS and selecting a subset of top agen ts to aggregate ( r anking & sele ction ), or applying a softmax function to P AS to obtain weigh ts.In Step 3, we can apply different base aggregators that can incorp orate the weigh t scheme, suc h as weigh ted Mean or Logit . 2 W e adopt the same formula for the Brier score as in the Go o d Judgment Pro ject (e.g., A tanasov et al. , 2016 ) 3 The log score is unbounded when the prediction is 0 or 1. W e thus map predictions of 1 (0) to 0.99 (0.01). 4 Algorithm 1 P AS-aided aggregators 1: Compute P AS (using one of DMI , CA , PTS , SSR , PSR ) based on all predictions. 2: Rank agents according to P AS. 3: F or each even t i , select the predictions from top max(10% · |N | , 10) agents who predict on that even t, and run Mean or Logit aggregator on these predictions. W e call the aggregators following the ab ov e framew ork the P AS-aide d aggr e gators . W e presen t the detailed P AS-aided aggregators that we will test in this pap er in Algorithm 1 . In Step 1, we use five differen t p eer prediction mec hanisms ( DMI , CA , PTS , SSR , and PSR ) to compute P AS, whic h will b e in tro duced in the next section. In Step 2, w e choose the ranking & selection scheme rather than the softmax weigh t, as the former can b e applied to any base aggregator and its hyper-parameter, the p ercent of top agen ts selected, has an straightforw ard ph ysical interpretation. In our exp erimen ts, these tw o weigh t schemes show similar p erformance with b est-tuned hyper-parameters. In Step 3, w e use Mean and Logit as the base aggregator. 5 P eer Prediction Metho ds for P AS P eer prediction mec hanisms are a family of emerging rew ard mechanisms designed to incen tivize cro wd w ork- ers to truthfully rep ort their priv ate signals (e.g., probabilistic predictions or v otes on the outcome) in the ab- sence of ground truth information. These mec hanisms can be expressed b y a function R : ([0 , 1] ∪ ∅ ) |M×N | → [0 , 1] |N | that maps forecasters’ prediction profile P to a rew ard R j for each forecaster j . The function R ( · ) is carefully designed so that an agent’s exp ected reward according to her b elief ab out others’ rep orts (formed b y her priv ate signal) will b e maximized when she rep orts truthfully . While most peer prediction scores do not necessarily reflect prediction accuracy , we selectiv ely review five p eer prediction mec hanisms in this section and provide theoretical support for using them as P AS — scores of these five mec hanisms each correlate with accuracy of agents according to some metric. The core intuition of these p eer prediction mechanisms to ac hieve truthful elicitation is to quan tify and reward the correlations among participants’ predictions that are associated with the ground truth of the forecasting questions, instead of rewarding the simple similarity b et ween participants’ predictions. As a result, forecasters with predictions con taining more information about the ground truth tend to receiv e a b etter score in expectation. This prop ert y mak es them ideal candidates to serv e as P AS. Tw o assumptions are often required for these mechanisms to work: A1. Even ts are independent and a priori similar, i.e., the join t distribution of agen ts’ priv ate signals and the ground truth is the same across even ts. A2. F or each even t, agents’ priv ate signals are indep endent conditioned on the ground truth. These tw o assumptions resem ble the requirements for using statistical inference methods to infer the ground truth: there exists a consistent pattern b et ween the ground truth and agents’ predictions across tasks. The difference is that these tw o conditions do not restrict the pattern to follow some generativ e models specified b y the inference methods. In the follo wing paragraphs, we first introduce these fiv e peer prediction mechanisms and then show why their rew ards ma y correlate with agents’ true prediction accuracy . W e divide the fiv e mec hanisms into t wo categories. 5.1 Mec hanisms reco vering the strictly prop er scoring rules (SPSR) When SPSR are reoriented such that a higher score corresp onds to higher accuracy , they can serv e re- w ard schemes to incentivize truthful rep orting ( Gneiting and Raftery , 2007 ). But they require the ground truth information to compute. Surrogate scoring rules ( SSR ) ( Liu et al. , 2020b ) and proxy scoring rules ( PSR ) ( Witko wski et al. , 2017 ) are tw o p eer prediction mechanisms that try to recov er the SPSR from par- ticipan ts’ rep orts, thus providing t wo methods to estimate the prediction accuracy of agents in the minimal information setting. Both mechanisms estimate a proxy of ground truth from participants’ forecasts and assess their forecasts against this pro xy . T o introduce SSR and PSR , we use S ( · ) to denote an arbitrary SPSR. 5 Surrogate scoring rules ( SSR ) F or a prediction p i,j from agent j , SSR randomly draws a binary signal Z from other agents’ forecasts on the same task as the proxy to ev aluate p i,j , with Z ∼ Bern P k ∈N i \{ j } p i,k |N i |− 1 . The bias of Z to ground truth Y i can b e represen ted b y t wo error rates e 0 = P ( Z = 1 | Y i = 0) and e 1 = P ( Z = 0 | Y i = 1). Assumptions A1 and A2 guaran tee that the error rates of Z for agent j are the same across different tasks. Based on this prop ert y , Liu et al. ( 2020b ) provided an algorithm to accurately estimate e 0 and e 1 using participants’ forecasts on multiple even ts. SSR then assess a prediction p i,j using a de-bias formula for S ( · ) to get an unbiased estimate for S ( · ) with Z . F or prediction p i,j , we ha ve R SSR i,j ( p i,j , Z ) = (1 − e 1 − Z ) S ( p i,j , z ) − e Z S ( p i,j , 1 − Z ) (1 − e 0 − e 1 ) . Consequen tly , E Z | Y i R SSR i,j ( p i,j , Z ) = S ( p i,j , Y i ) . Pro xy scoring rules ( PSR ) In constrast to SSR , PSR directly apply SPSR S ( · ) to an agent’s forecast against a pro xy ˆ Y i of the ground truth to obtain the rew ard score, i.e., R PSR i,j ( p i,j , ˆ Y i ) = S ( p i,j , ˆ Y i ) . Witk owski et al. ( 2017 ) show ed that as long as the proxy ˆ Y i is un biased to the ground truth, the pro xy scoring rule gives an p ositive affine transformation of S ( · ), main taining the incentiv e prop erty . In practice, Witko wski et al. ( 2017 ) recommended using an extremized mean prediction as the proxy when there is no explicit unbiased pro xy of ground truth av ailable. 5.2 Mec hanisms rew arding the correlation Determinan t mutual information mechanism ( DMI ) ( Kong , 2020 ), correlated agreement ( CA ) ( Shnayder et al. , 2016 ), and p eer truth serum ( PTS ) ( Radanovic et al. , 2016 ) are three mechanisms that rew ard agents b y examining their forecasts’ correlation to their peers’. Their core idea is to reward by a correlation metric that measures the agreement degree betw een agents’ forecasts that are in tro duced through the ground truth, while excludes the agreement degree introduced by pure chance. In this wa y , an agent who indep enden tly manipulates her rep orts regardless the ground truth can only decrease her agreement with other agen ts. The computation of the exp ected reward under these three mechanisms for an agent j relies on the joint v oting distribution betw een agen t j and an uniformly randomly selected peer agen t k . Given a prediction p i,j , agent j ’s v ote on even t i can b e viewed as drawn from Bern( p i,j ). Th us, the join t v oting probabilit y of agent j v oting u and agen t k voting v for any u, v ∈ { 0 , 1 } can b e computed empirically as ˆ d j,k u,v = 1 |M j,k | X i ∈M j,k p u i,j (1 − p i,j ) 1 − u p v i,k (1 − p i,k ) 1 − v , where M j,k is the subset of forecasting questions answered b y b oth agents. W e use ˆ D j,k = ˆ d j,k u,v u,v ∈{ 0 , 1 } to denote the en tire joint voting distribution of agent j and k . In the following paragraphs, we review how these three mechanisms reward agen t j given the p eer agen t k . Determinan t mutual information mechanism ( DMI ) DMI measures the correlation using the deter- minan t mutual information ( Kong , 2020 ). Let M 0 j,k , M 00 j,k b e t wo disjoin t subsets of M j,k , and let ˆ D 0 , ˆ D 00 b e the joint voting distribution computed on these t wo subsets separately . DMI rewards agent j by an unbiased estimate to the squared determinant mutual information b et ween agen ts j and k : R DMI j = η det( D 0 ) · det( D 00 ) , (1) where η is a normalization co efficient. Correlated agreement ( CA ) CA rewards an agen t j by R CA j = X u ∈{ 0 , 1 } X v ∈{ 0 , 1 } | ˆ d j,k u,v − ˆ d j u · ˆ d k v | , (2) where ˆ d j u = P v ∈{ 0 , 1 } ˆ d j,k u,v is the marginal distribution of agent j reporting u estimated from the data. R CA j rew ards the correlation b y measuring the gap b etw een the ov erall matching probabilit y (represented b y ˆ d j,k u,v ) and the matching probability caused by pure c hance (represen ted by ˆ d j u · ˆ d k v ). 6 P eer T ruth Serum ( PTS ) PTS rew ards agent j b y the matching probabilit y of her votes to the peer agent k ’s votes. PTS mitigates the effect of a match caused by pure chance via rewriting the matching probability under different vote realizations. Let ¯ p − j,u b e the a verage marginal probability of voting u of all agents except j . PTS rewards agen t j by R PTS j = ˆ d j,k 0 , 0 / ¯ p − j, 0 + ˆ d j,k 1 , 1 / ¯ p − j, 1 . (3) 5.3 P eer prediction rew ards and accuracy of agen ts In this section, w e formally show that the fiv e p eer prediction mechanisms reflect forecasters’ true accu- racy . First, SSR and PSR reflect the underlying accuracy of predictions due to the un biasedness of their rew ards w.r.t. the (affine transformation of ) SPSR that they are built up on. As a direct corollary of their un biasedness, we ha ve the follo wing. Prop osition 1. 1. Under Assumptions A1 and A2, SSR r anks the agents in the or der of their me an SPSR that SSR is built up on asymptotic al ly ( |M| , |N | → ∞ ). 2. When ther e is an unbiase d estimate of the gr ound truth and al l agents ar e sc or e d with the same unbiase d estimate, PSR r anks the agents in the or der of their me an SPSR that PSR is built up on asymptotic al ly ( |M| → ∞ ). Second, the mec hanisms, DMI , CA , PTS , reflect the accuracy of each agent b ecause they essentially try to capture the informativeness of agents forecasts, i.e., the correlation b etw een the agen ts’ forecasts that is established through the ground truth instead of the pure chance. More sp ecifically , w e ha ve the follo wing prop osition. Prop osition 2. Under Assumptions A1 and A2, and assuming agents r ep ort truthful ly, the exp e cte d r ewar ds of DMI , CA , PTS r efle ct a c ertain ac cur acy me asur e of agents. In p articularly, 1. DMI r anks the agents in the or der of their r ep orts’ squar e d determinant mutual information ( Kong , 2020 ) w.r.t. the gr ound truth asymptotic al ly ( |M| , |N | → ∞ ). 2. CA r anks the agents in the or der of their r ep orts’ determinant mutual information w.r.t. the gr ound truth asymptotic al ly ( |M| , |N | → ∞ ). 3. PTS r anks the agents in the inverse or der of their signals’ exp e cte d weighte d 0-1 loss w.r.t. the gr ound truth outc ome asymptotic al ly ( |M| , |N | → ∞ ), when the binary answer dr awn fr om the me an pr e diction of al l agents has a true p ositive r ate and a true ne gative r ate b oth ab ove 0.5. Item 1 in Prop osition 2 follo ws straightforw ardly from Theorem 6.4 in ( Kong , 2020 ). W e present the pro ofs for the items 2 and 3 in App endix D . W e note that m utual information do es not directly imply accuracy in the binary case. F or example, a random v ariable Y 0 i = 1 − Y i con tains all information w.r.t. the ground truth Y i . But Y 0 i is clearly not an accurate prediction of ground truth Y i . How ev er, when agen ts’ forecasts p i,j are p ositiv ely correlated to the ground truth Y i , i.e., agents’ predictions are b etter than random guess, then the mutual information does rank forecasts in the correct order, i.e., ranking the p erfect prediction ( p i,j = Y i ) the highest and ranking random ones the low est. 6 Empirical Studies Our theoretical results suggest that the fiv e p eer prediction methods can effectiv ely identify participan ts who predict more accurately than others under certain assumptions. In practice, how ever, it is often c hallenging or impossible to know to what extent these assumptions hold. Therefore, we conduct extensive exp eriments to study the performance of our P AS-aided aggregators. W e use a div erse set of 14 real-w orld human forecast datasets and adopt tw o widely used accuracy metrics, the Brier score and the log score. W e first in tro duce our exp erimen tal setup, then examine the effectiveness of P AS in selecting top p erforming forecasters, and finally present a comprehensiv e ev aluation of our aggregators’ p erformance. W e first fo cus on binary even ts and then discussion our results on multi-outcome ev ents in Section 6.4 . 7 Items G1 G2 G3 G4 H1 H2 H3 M1a M1b M1c M2 M3 M4a M4b # of questions 94 111 122 94 72 80 86 50 50 50 80 80 90 90 # of agents 1409 948 1033 3086 484 551 87 51 32 33 39 25 20 20 Avg. # of ans. p er ques. 851 534 369 1301 188 252 33 51 32 33 39 18 20 20 Avg. # of ans. p er agent 56.74 62.46 43.55 39.63 28.03 36.5 32.8 49.88 49.96 50 79.97 60 90 89.5 Ma j. vote correct ratio 0.90 0.92 0.95 0.96 0.88 0.86 0.92 0.58 0.76 0.74 0.61 0.68 0.62 0.72 T able 2: Statistics ab out the binary even t datasets from GJP , HFC and MIT datasets Items G1 G2 G3 G4 H1 H2 H3 # of questions 8 24 42 43 81 80 86 # of agents 1409 948 1033 3086 484 551 87 Avg. # of ans. p er question 945.25 566.25 341.8 1104.58 136.30 202.99 26.03 Avg. # of ans. p er agent 5.37 14.34 13.9 15.39 22.81 30.20 29.32 Ma j. vote correct ratio 0.88 0.96 0.90 0.88 0.57 0.61 0.68 T able 3: Statistics ab out the multiple-outcome ev ent datasets from GJP and HFC datasets 6.1 Exp erimen t setup 6.1.1 Datasets Our 14 test datasets consist of 4 datasets from the Go od Judgement Pro jects (GJP) collected from 2011 to 2014 ( GJP , 2016 ), 3 datasets from the Hybrid F orecasting Comp etition (HFC) of v aried populations ( IARP A , 2019 ), and 7 MIT datasets ( Prelec et al. , 2017 ). These datasets v ary in several dimensions, including dataset size, sparsit y , topics, collecting en vironment, and participants’ p erformance. T ogether they offer a rich en vironment for ev aluating the p erformance of aggregators. The GJP and the HFC collected predictions about real-world issues in volving geopolitics and economics via y ear-long online forecast con tests. In these con tests, forecasting questions w ere opened, closed, and resolv ed dynamically , and forecasters’ accuracy can be ev aluated using previously resolv ed questions and used to aggregate predictions of remaining op en questions. In contrast, the MIT datasets are static prediction datasets, where participants predict on a set of questions all at once. The topics include the capital of states, the price interv al of arts, and the diagnosis of skin lesions. The MIT datasets also con tain additionally solicited predictions that participants made about other participan ts’ predictions. This information enables one to apply the surprising-p opularity-based aggregators. Our pap er fo cuses on the minimal-information aggregation setting. Therefore, w e ignore the temp oral information in the GJP and HFC datasets and only use each individual’s final forecast on each forecasting question. 4 W e also ignore the additional information solicited in MIT datasets when applying our aggre- gators, but use it for a surprising-p opularity-based b enc hmark aggregator. W e filter out participan ts with less than 15 predictions and questions with less than 10 answers from these datasets. This op eration only remo ved a few forecasting questions in the HFC datasets with no sufficient predictions to make meaningful aggregation. W e summarize the main statistics ab out the binary ev ents of the 14 datasets after filtering in T able 2 and the multi-outcome ev ents in T able 3 . More details ab out datasets can b e found in App endix C . 6.1.2 Benchmark aggregators In addition to the t wo base aggregators, Mean and Logit , which are widely-used in the minimal-information aggregation setting ( Satop¨ a¨ a et al. , 2014a ; Jose and Winkler , 2008 ), w e also use tw o other types of aggregators as our b enchmarks, the inference-based metho ds and the surprising-p opularit y-based metho ds. • Infer enc e-b ase d metho ds contain a wide range of minimal-information multi-task aggregators. These metho ds establish parameterized mo dels to characterize the latent features of forecasters suc h as their biases tow ards the ground truth probability and the v ariances in their b eliefs. Then, they infer these parameters as well as the ground truth using the forecasts across all even ts. In this type of aggrega- tors, we use the variational infer enc e for cr owdsour cing ( VI ) method as a b enc hmark. It is a go-to approac h to aggregate predictions in the mac hine learning comm unity . W e use the estimate ground truth probabilities giv en by VI as its predictions. Details of VI are included in App endix E . Other 4 W e obtain similar qualitative results when the first forecasts or the av erage forecasts are used. 8 Figure 1: The av erages of the true mean Brier score of top forecasters selected b y the five P AS and by the true Brier score. Figure 2: The p ortions of ov er- lapp ed agents, who are simu ltane- ously selected by all of the fiv e P AS and the true score. Figure 3: The Brier score of the fiv e mean-based P AS-aided aggre- gators with a v arying n umber of se- lected top agents on dataset G2. sophisticated metho ds in this category include the cultural consensus mo del ( Orav ecz et al. , 2014 ), the cognitiv e hierarch y mo del ( Lee and Danileik o , 2014 ), and the m ulti-task statistical surprising p opular- it y metho d ( McCo y and Prelec , 2017 ) 5 . W e will also compare to the p erformance these aggregators rep orted b y McCo y and Prelec ( 2017 ) on the MIT datasets. • Surprising-p opularity-b ase d metho ds are not minimal-information aggregators, but they represent a new trend of forecast aggregation ( Prelec et al. , 2017 ; P alley and Soll , 2019 ). They require forecasters to additionally predict other forecasters’ predictions ab out the even ts of in terest. Using this additional information, these metho ds can iden tify commonly shared information in participan ts’ forecasts and a void counting them multiple times in the aggregation. The typical aggregator in this category refers to the surprisingly-p opular algorithm ( Prelec et al. , 2017 ). W e use a more recent v ariant, called the minimal pivot ( MP ) method, as our benchmark. It has a better p erformance in generating probabilistic predictions. It has a simple form: the aggregated prediction equals t wo times the mean of the par- ticipan ts’ forecasts min us the mean of the participants’ predictions ab out other participants’ av erage prediction. Median is another p opular aggregator in the minimal information setting. In our test, its performance is alw ays b et ween the p erformance of Mean and Logit . Thus, w e omit our results ab out median. 6.1.3 Implementation of P AS-aided aggregators In our experiments, w e ev aluate 10 P AS-aided aggregators. Each P AS-aided aggregator uses one of the fiv e p eer prediction mec hanisms ( DMI , CA , PTS , SSR , PSR ) to compute P AS and then incorporate the P AS into one of the tw o base aggregators (the Mean and Logit ) using the rank&selection sc heme. These P AS-aided aggregators ha ve a single h yp er-parameter—the num b er of top participan ts selected for eac h forecasting question. W e set it to b e the larger one of 10 and 10% p ercen t of the total num b er of users. This hyper-parameter is shared among all P AS-aided aggregators on all datasets. Mean while, for SSR and PSR aggregators, w e set the SPSR they are built up on as the metric SPSR. W e use the output of the VI aggregator as the proxy used in PSR . 6 All these aggregators are describ ed in Algorithm 1 . 6.2 Smaller but smarter cro wd Before w e dive into the comprehensive comparison b etw een our P AS-aided aggregators and b enc hmarks, we first examine the effectiveness of P AS in identifying top forecasters and the influence of the num b er of top forecasters selected to the aggregation. Fig. 1 shows the av erage prediction accuracy of the top forecasters selected by the five P AS ( DMI , CA , PTS , SSR , PSR ) ov er the 14 datasets. F or all five P AS, the a verage of the true mean Brier scores of the selected top forecasters steadily increases (from around 0.3 to around 0.45) when we gradually enlarge the 5 This aggregator combines b oth inference and surprising-p opularity . 6 W e also tested using proxies (e.g, the mean of agents’ predictions and the extremized mean ( Witkowski et al. , 2017 )) in PSR , while using VI as the proxy giv es us the b est result. 9 selection range from top 5% to all forecasters. This result indicates that all five P AS scores effectively rank the forecasters in the order of their true performance. W e also notice that at each level of top forecasters selected, the mean accuracy of top forecasters selected b y different P AS is v ery similar. W e further examine the ov erlap of these top forecasters. The result (Fig. 2 ) suggests that the sets of top forecasters selected by differen t P AS scores hav e considerable ov erlap, and among these o verlapped forecasters, the p ortion of the actual top forecasters is also remark able. F or example, as shown in Fig. 2 , around 50% of forecasters are common among the top 30% forecasters under different P AS scores, and in these common forecasters, 60% forecasters are the actual top 30% forecasters (b ecause at the level of top 30%, 30% forecasters are shared b y all 5 P AS together with the true Brier score). This result further confirms that the fiv e P AS can identify true top p erformers and that they hav e similar abilities in doing s o. Next, we examine ho w the n um b er of top forecasters selected b y P AS influences the aggregation accuracy . Ov erall, we observ e that the accuracy of the P AS-aided aggregators p eaks at a certain top p ercen t (usually at top 5% to top 20%) and outp erforms the accuracy of the base aggregator that they are built up on. W e illustrate this observ ation with dataset G2 in Fig. 3 , whic h also shows the accuracy of a Brier-score-( BS )-aided aggregator. The p erformance of this BS -aided aggregator shows the “in hindsight” p erformance we could ac hieve if the p eer assessment is as accurate as if we knew the ground truth. In this particular dataset, the P AS-aided aggregators p erfectly recov er this “in hindsight” performance of the BS -aided aggregator (Fig. 3 ). Ov erall, these results confirm prior findings which sho w that there often exists a smaller but smarter cro wd whose mean prediction outp erforms that of the entire crowd (e.g. “sup erforecasters” ( Mellers et al. , 2015 ) and ( Goldstein et al. , 2014 )). Our contribution is to demonstrate that w e can identify this set of smarter forecasters using only their prediction information. 6.3 F orecast aggregation p erformance on binary even ts In this section, we presen t our main exp erimen tal results—the aggregation p erformance of our 10 P AS-aided aggregators against the benchmark aggregators on binary ev ents of the 14 datasets. Our extensiv e ev aluation highligh ts the following findings: 1. The performance of the four b enchmark aggregators v aries significantly across datasets, confirming the difficult y of forecast aggregation in the minimal-information setting. 2. The P AS-aided aggregators not only ha ve higher o verall accuracy than the b enc hmarks but also perform more stably and robustly across datasets. 3. While the p erformance of the 10 P AS-aided aggregators is not statistically different, the Mean -based P AS-aided aggregators tend to ha v e higher acc uracy and lo wer v ariance than the Logit -based P AS-aided aggregators. Our main results are shown in T able 4 and T able 5 . T able 4 shows the accuracy of the 10 P AS-aided aggregators and the b enchmark aggregators on eac h dataset under the Brier score. As can be seen, 9 out of 10 P AS-aided aggregators outp erform the b est of the b enchmarks on at least 5 datasets, and the remaining one outp erforms the b est b enc hmark on 4 datasets. F urthermore, each of the 5 P AS-aided Mean aggregators outp erforms the second-b est b enc hmark on at least 12 out of 14 datasets. Moreov er, no P AS- aided aggregator underp erforms the worst b enc hmark on any dataset, with only one exception of the PSR - aided Logit aggregator on dataset M1a. This is a significant improv ement as we can see that though these b enc hmark aggregators are carefully designed for aggregating forecasts in the minimal information setting, none of them has stable p erformance across datasets. T able 5 provides the n umber of datasets on which one aggregator statistically outp erforms the other for eac h pair of P AS-aided aggregators and b enc hmarks. Eac h of the 10 P AS-aided aggregators, esp ecially the Mean -based P AS-aided aggregators, statistically outp erforms each b enc hmark on at least 4 more datasets than it underp erforms, with a maxim um of 9 more datasets. Similar results are observed under the log scoring rule (T able 9 , App endix B and T able 5 ). Next, we give a more detailed review of the exp erimental results. P erformance of the b enc hmarks. The Logit aggregator p erforms better than the other b enc hmarks on the GJP and HFC datasets, but p erforms worse on the MIT datasets, while the Mean aggregator p erforms 10 Base aggr. P AS G1 G2 G3 G4 H1 H2 H3 M1a M1b M1c M2 M3 M4a M4b Mean DMI .125 .068 .071 .066 .219 .196 .110 .326 .126 .114 .434 .429 .535 .282 CA .127 .069 .073 .071 .200 .195 .126 .340 .126 .114 .454 .443 .536 .282 PTS .122 .069 .070 .066 .188 .192 .116 .359 .125 .114 .474 .443 .536 .282 SSR .137 .079 .072 .063 .164 .188 .122 .359 .116 .114 .474 .436 .522 .303 PSR .133 .065 .070 .059 .175 .187 .116 .459 .108 .107 .472 .451 .536 .278 Logit DMI .113 .053 .072 .037 .199 .194 .115 .517 .056 .058 .425 .545 .702 .325 CA .109 .053 .066 .036 .162 .191 .119 .547 .056 .058 .482 .569 .686 .325 PTS .109 .053 .071 .036 .172 .191 .120 .587 .066 .058 .508 .569 .686 .325 SSR .106 .053 .072 .039 .132 .187 .118 .587 .046 .058 .518 .556 .701 .422 PSR .106 .054 .071 .039 .182 .195 .117 .715 .037 .028 .535 .579 .686 .376 Mean (b enchmark) .206 .174 .114 .151 .212 .184 .143 .452 .347 .347 .480 .441 .473 .333 Logit (b enchmark) .116 .080 .066 .065 .136 .174 .122 .681 .433 .357 .500 .562 .663 .485 VI (b enchmark) .213 .072 .082 .085 .306 .325 .163 .595 .037 .000 .841 .610 .733 .345 MP (b enchmark) N/A N/A N/A N/A N/A N/A N/A .425 .251 .232 .479 .471 .609 .491 T able 4: The mean Brier scores (range [0, 2], the lo wer the b etter) of differen t aggregators on binary even ts of 14 datasets . The b est mean Brier score among b enc hmarks on each dataset is marked by bold font. The mean Brier scores of 10 P AS-aided aggregators that outp erform the best of b enc hmarks on each dataset are highligh ted in green ; those outp erforming the second b est of b enc hmarks are highligh ted in y ellow ; the w orst mean Brier scores ov er all aggregators on eac h dataset are highligh ted in red . in the other directions. This is lik ely b ecause that the questions in MIT datasets are more challenging than those in the GJP and HFC datasets (e.g., see the correctness ratio of ma jorit y vote sho wn in T able 2 ), and the Logit aggregator, whic h extremizes the mean prediciton, further w orsens the situation. VI predicts almost fla wlessly on datasets M1b, M1c, but is outp erformed by uninformativ e guess (predicting 0.5) on M2, M3, and M4a. This is likely b ecause the accuracy of VI heavily depends on the extent to which the data follo ws the assumed generative model that VI uses to infer the ground truth. MP has a relatively stable p erformance on the MIT datasets, but on some of these datasets, it is outp erformed by VI and Mean . P AS-aided aggregators vs. Mean and Logit . As can b e seen in T able 5 , the P AS-aided aggregators outp erform the Mean and the Logit aggregators with statistical significance on most datasets. Dataset H2 is the only exception where Mean and Logit are not outp erformed b y any P AS-aided aggregator under the Brier score. Ho wev er, a closer lo ok shows that the accuracy difference of these tw o aggregators in H2 is minimal (within 0.02). This adv antage of the P AS-aided aggregators ov er the Mean and the Logit aggregators is b ecause of the use of cross-task information when computing the P AS, i.e., the top forecasters are truly iden tified by these P AS using agents’ forecasts on multiple tasks. These empirical results suggest that one can safely replace the Mean and Logit with the P AS-aided aggregators and exp ect an accuracy improv ement in most cases (if a sufficien t num b er 7 of predictions are collected from eac h forecaster to compute the P AS). P AS-aided aggregators vs. VI and other inference-based methods W e notice that although VI ranks the worst in many datasets, the num b er of datasets on which VI statistically underp erforms eac h P AS-aided aggregator is smaller than those n umbers of the other b enc hmarks (T able 5 ). This is b ecause VI tends to output extreme predictions (close to 0 or 1) and thus receives extreme accuracy scores (e.g., close to 0 or 2 under the Brier score), requiring more even ts to draw statistically significan t conclusions. Also, as w e hav e mentioned, the p erformance of VI v aries significantly across different datasets (T able 4 ). If one is uncertain ab out whether the data follows the generative mo del assumed by VI , the P AS-aided aggregators (esp ecially the SSR -/ PSR -aided aggregators) are b etter choices. They p erform muc h closer to VI than the other b enc hmark aggregators on datasets where VI mak es almost p erfect predictions (datasets M1b, M1c), and perform more stably on datasets where VI makes extremely wrong predictions (datasets M2, M3, M4a). McCo y and Prelec ( 2017 ) rep orted the mean Brier score (with range [0,1]) of three other inference-based aggregators (the cultural consensus model, the cognitiv e hierarch y model and the m ulti-task statistical surprising p opularit y method) on MIT datasets (T able 10 , App endix B ). Based on their reports, only the m ulti-task statistical surprising popularity metho d outp erforms our P AS-aided aggregators on one more datasets than what VI do es. How ever, this metho d requires forecasters to provide additional predictions b ey ond the predictions of the even ts of in terest just as other surprising-p opularit y-based aggregators. P AS-aided aggregators vs. MP MP generally p erforms better than other b enc hmarks on the 7 MIT 7 W e will discuss this num b er in the next section. 11 Brier Score Log Score Base aggr. P AS Mean Logit VI MP Mean Logit VI MP Mean DMI 10, 1 7, 1 5, 2 5, 0 10, 1 7, 2 8, 2 6, 0 CA 8, 1 6, 1 5, 2 4, 0 8, 1 6, 2 8, 2 5, 0 PTS 9, 1 6, 1 5, 2 4, 0 9, 1 6, 2 9, 2 5, 0 SSR 8, 1 6, 0 6, 2 5, 0 8, 1 6, 3 7, 2 4, 0 PSR 8, 1 6, 1 5, 2 3, 0 8, 1 6, 2 9, 2 4, 0 Logit DMI 6, 2 6, 1 2, 0 3, 1 6, 2 4, 1 6, 0 3, 1 CA 6, 2 4, 0 3, 0 3, 1 7, 3 5, 0 5, 0 3, 2 PTS 6, 2 4, 0 3, 0 3, 2 6, 3 3, 0 5, 0 3, 2 SSR 7, 2 4, 0 3, 0 2, 2 7, 4 2, 0 5, 1 2, 3 PSR 6, 3 4, 1 4, 0 3, 2 6, 4 4, 1 5, 1 3, 3 T able 5: The tw o-sided paired t -test for the mean Brier scores and the mean log scores of eac h pair of a P AS-aided aggregator and a b enc hmark on binary even ts of 14 datasets. The first integer in eac h cell represen ts the n umber of datasets where the P AS-aided aggregator achiev es significan tly smaller mean score (with p-v alue < 0.05), while the second integer in eac h cell indicates the num b er of datasets where the b enc h- mark achiev es significan tly smaller mean score. The cells where the # of outperforms exceeds the # of underp erforms b y at least 4 are highlighted in green . (a) Brier score (b) Log scoring rule Figure 4: The mean and the standard deviation of the aggregation accuracy of the 10 P AS-aided aggregators ( DMI / CA / PTS / SSR / PSR -aided × Mean / Logit -based aggregators) and the b enchmarks o ver 14 datasets. datasets, as it uses the additionally solicited information av ailable these datasets. How ever, T able 5 still sho ws a salien t adv antage of P AS-aided Mean aggregators ov er MP . This result implies that when forecasters mak e predictions on multiple ev ents, the cross-task information leveraged by the P AS scores may b e more p o werful in facilitating aggregation than the additionally solicited information used in MP . Finally , we find no significant difference in the p erformance of P AS-aided aggregators that use different P AS. In particular, under the Brier score, no P AS-aided aggregator statistically outperforms another on more than three datasets if the same base aggregator is used. This is lik ely b ecause different P AS ha ve similar abilities in identifying the top forecasters as w e hav e shown in Fig. 2 . 6.3.1 Average p erformance across datasets W e presen t the mean and the standard deviation of the accuracy of our 10 P AS-aided aggregators and b enc hmarks ov er the 14 datasets in Fig. 4 (Concrete data can b e found in T able 11 , App endix B ). As can b e seen, all P AS-aided aggregators hav e b etter mean accuracy under the Brier score than all b enc hmarks. In particular, the five Mean -based P AS-aided aggregators outp erform all benchmarks with statistical significance 12 Brier Score Log Score Base aggr. P AS G2 G3 G4 H1 H2 H3 G2 G3 G4 H1 H2 H3 Mean DMI .099 .136 .115 .522 .527 .402 .219 .287 .264 .975 .986 .779 CA .103 .165 .123 .516 .526 .400 .229 .343 .283 .956 .985 .770 PTS .099 .139 .114 .509 .528 .403 .218 .291 .260 .947 .988 .771 SSR .136 .145 .109 .516 .524 .419 .320 .296 .254 .956 .966 .785 PSR .097 .126 .101 .521 .530 .406 .208 .255 .227 .969 .980 .763 Logit DMI .067 .131 .067 .488 .506 .442 .129 .233 .138 .909 .960 .878 CA .069 .136 .067 .484 .509 .439 .131 .249 .141 .887 .967 .866 PTS .065 .129 .065 .478 .512 .444 .127 .233 .135 .879 .974 .879 SSR .083 .127 .067 .493 .507 .461 .188 .225 .149 .894 .939 .898 PSR .069 .125 .061 .496 .518 .448 .129 .220 .130 .913 .962 .865 Mean (benchmark) .243 .232 .239 .534 .526 .445 .509 .484 .490 .992 .981 .839 Logit (benchmark) .147 .149 .161 .500 .505 .462 .298 .295 .309 .921 .947 .893 VI (benchmark) .083 .190 .186 .864 .780 .633 .202 .448 .438 1.996 1.803 1.417 T able 6: The mean Brier score and the mean log score of different aggregators on multi-outcome even ts of 6 datasets. The b est mean score among b enc hmarks on each dataset is marked by bold font. The mean scores of 10 P AS-aided aggregators that outperform the b est of benchmarks on each dataset are highlighted in green ; those outp erforming the second b est of b enc hmarks are highligh ted in y ellow ; the worst mean scores ov er all aggregators on each dataset are highlighted in red . (p < 0.05) under b oth the Brier score and the log scoring rule. 8 Moreo ver, the five Mean -based aggregators also show m uch smaller v ariances than the Logit and VI aggregators under b oth accuracy metrics, suggesting that the Mean -based P AS-aided aggregators are more stable than these tw o benchmarks. Within P AS-aided aggregators, the Mean -based ones appear to be more accurate and stable than the Logit -based ones, while the differences are not statistically significant. W e conjecture that as the P AS already select out the forecasters with more accurate predictions, the extremization provided by the Logit base aggregator no longer b enefits for any accuracy improv ement, but only increases the aggregation v ariance. These findings suggest that one can expect b etter accuracy and smaller p erformance v ariance when using P AS-aided aggregators instead of the b enc hmark aggregators. Moreov er, the Mean -based P AS-aided aggregators, especially the Mean -based DMI -aided aggregator, are likely to pro duce the b est aggregation outcomes. W e also ev aluated P AS-aided aggregators on smaller datasets that were sampled from the 14 original datasets. These datasets hav e 20 ev ents and 30 or 50 participan ts. W e observ e similar improv ements of the P AS-aided aggregators ov er the b enc hmarks. This result suggests that the P AS-aided aggregators ma y also mitigate the cold-start problem in long-term forecast aggregation settings, where only a small set of forecasts is av ailable with no ground truth yet revealed. W e present the details of this exp eriment in App endix A . 6.4 F orecast aggregation p erformance on m ulti-outcome ev ents Our 10 P AS-aided aggregators can be extended to agg regate forecasts on multi-outcome even ts, b ecause the 5 P AS scores and the t wo base aggregators can b e extended to multi-outcome even ts ( Satop¨ a¨ a et al. , 2014a ; Radano vic et al. , 2016 ; Shna yder et al. , 2016 ; Witk owski et al. , 2017 ; Liu et al. , 2020b ; Kong , 2020 ). How ev er, the p erformance of these multi-outcome-ev ent extensions may not b e as go o d as their binary counterparts for t wo reasons. First, in the multi-outcome ev ent settings, there are more laten t v ariables to b e estimated in the P AS scores, while the n umber of the samples (the multi-outcome ev ents to forec ast and the predictions collected) are usually smaller than those of binary ev ents (T able 2 vs. T able 3 ). Second, the assumptions under which the P AS scores theoretically reflect the true accuracy of forecasters are more difficult to meet for multi-outcome even ts. Therefore, if w e use these extended metho ds directly , the estimates of forecasters’ p erformance ma y b e noisy , leading to more noisy aggregated predictions. 8 The only exceptions are the PSR -aided aggregator under the Brier score, and the SSR -/ PSR -aided aggregators under the log score when compared to the MP aggregator, as the MP aggregator only applies to 7 MIT datasets. 13 Brier Score Log Score Base aggr. P AS Mean Logit VI Mean Logit VI Mean DMI 5, 0 1, 0 3, 0 3, 0 1, 0 3, 0 CA 5, 0 1, 0 3, 0 4, 0 1, 1 3, 0 PTS 5, 0 1, 0 3, 0 4, 0 1, 0 3, 0 SSR 4, 0 2, 0 3, 0 5, 0 1, 0 3, 0 PSR 5, 0 3, 0 3, 0 4, 0 3, 0 3, 0 Logit DMI 4, 0 1, 0 3, 0 4, 0 2, 0 3, 0 CA 4, 0 1, 0 3, 0 4, 0 3, 0 3, 0 PTS 4, 0 2, 0 3, 0 4, 0 3, 0 3, 0 SSR 3, 0 1, 0 3, 0 4, 0 3, 0 3, 0 PSR 3, 0 1, 0 3, 0 4, 0 3, 0 3, 0 T able 7: The tw o-sided paired t -test for mean Brier score and mean log score of each pair of a P AS-aided aggregator and a benchmark on m ulti-outcome even ts of 6 datasets. The first integer in each cell represen ts the num b er of datasets where the P AS-aided aggregator achiev es the significantly smaller mean score (with p-v alue < 0.05), while the second integer in each cell indicates the num b er of datasets where the b enchmark ac hieves the significantly smaller mean score. A more practical alternativ e is to apply the P AS of forecasters estimated on binary ev ents into the aggregation of multi-outcome ev ents. In the GJP and HFC pro jects, agen ts face b oth binary ev ents and m ulti-outcome even ts. Therefore, we can apply this approach on b oth GJP and HFC datasets. W e presen t the statistics of multi-outcome forecasting questions in the GJP and HFC datasets in T able 3 and present the aggregation results and comparisons in T able 6 and 7 . The results show a consistent and significan t adv antage of using the P AS-aided aggregators. The success in this approac h also suggest that agents hav e consisten t relative accuracy in making predictions on both binary even ts and m ulti-outcome even ts. In particular, on no dataset a b enchmark outp erforms a P AS-aided aggregation with statistical significance (the only exception is Logit v.s. CA -aided Mean on dataset H2). 7 Discussion and F uture Directions This pap er demonstrates that the P AS-aided aggregators generally hav e higher aggregation accuracy across datasets than the four b enchmark aggregators. Among the b enchmarks, the Mean , Logit , and MP aggregators are single-task aggregators that generate the final prediction of an ev ent using only the forecasts on that even t. Ho wev er, they were the top-performing aggregators in sev eral real-w orld, multi-task forecasting competitions suc h as in the Goo d Judgemen t pro ject ( Jose and Winkler , 2008 ; Satop¨ a¨ a et al. , 2014a ). The VI aggregator is a multi-task statistical-inference-based aggregator, whic h uses an inference metho d to infer the ground truth probabilit y based on cross-task information. Our P AS-aided aggregators can also b e viewed as a multi-task statistical-inference-based aggregator. The p eer prediction metho ds used in the P AS-aided aggregators are inference-lik e metho ds that estimate forecasters’ underlying exp ertise using all forecasts collected. Using cross-task information in aggregation gives the P AS-aided aggregators adv antages ov er the single- task b enchmark aggregator. W e can see that on datasets M1b and M1c, the three single-task b enchmarks p erform mo derately w ell (with a mean Brier score around 0.3), while the other benchmark aggregator using cross-task information, the VI aggregator, has almost p erfect predictions (with a mean Brier score close to 0). Our P AS-aided aggregators has similarly great p erformance on these tw o datasets as the VI aggregator. On the other hand, the P AS-aided aggregators appear to hav e more robust p erformance than the statistical- inference-based VI aggregator. F or example, on datasets M2, M3, and M4a, where VI has m uch worse p erformance than random guesses, the P AS-aided aggregators still hav e mo derate p erformance. Intuitiv ely , statistical inference methods are sensitiv e to underlying prop erties of the data, i.e., the extent to which the assumed probabilistic mo del reflects the true pattern of the data. Unlike typical statistical-inference- based aggregators, the P AS-aided aggregators do not directly infer the outcomes of the forecasting questions. Instead, they infer forecasters’ exp ertise from cross-task predictions and then use the exp ertise information to adjust the base aggregator. This op eration likely makes the P AS-aided aggregators more robust to the 14 v ariation of the data. Although the P AS-aided aggregators demonstrated significant accuracy impro vemen t on datasets where individuals’ ov erall p erformance is either go od or p o or and the num b er of forecasts collected p er question is either high or low (GJP datasets and MIT datasets), we find their accuracy improv ement is minimal on the HF C datasets, where the num b er of forecasts each forecaster made ( < 40) is relatively small. This observ ation is consistent with the theoretical requirements for P AS scores to accurately estimate forecasters’ true p erformance: Each forecaster has consistent accuracy across ev ents, and each forecaster has made a sufficien t num b er of predictions. Therefore, if an insufficient num b er of predictions has b een made by each forecaster, the P AS scores may not reflect forecasters’ factual accuracy well. In addition, the fiv e P AS scores that w e tested in theory all rely on the assumption that the predictions of differen t forecasters are indep enden t conditioned on the underlying even t outcome to reflect the forecasters’ true accuracy . Although the P AS-aided aggregators p erform well on our 14 datasets, where the assumption is lik ely not hold strictly , one should still b e careful ab out using the P AS-aided aggregators in scenarios where this assumption is saliently violated, for example, when forecasters are encouraged to discuss with eac h other b efore making predictions and when forecasters are mac hine predictors trained using similar data and metho ds. In this pap er, w e tak e the first step to understand the p ossibilit y of using p eer prediction metho ds to ro- bustly impro ve the collectiv e intelligence in prediction tasks. Our approach has the adv an tage of only requir- ing a minimal amoun t of information to b e collected and placing almost no restriction on cro wsourcing work- flo w. Th us, our metho ds ha ve the p oten tial of b ecoming a comp onen t of more in teractive human-mac hine forecasting systems, where other techniques of b oosting collective intelligence, such as teaming ( Canonico et al. , 2019 ), workflo w design ( Lin et al. , 2012 ), promoting interactions ( Bigham et al. , 2015 ) and AI algo- rithms ( W eld et al. , 2015 ), are also presen t. F rom another p erspective, the human-mac hine computation systems are no w also developed for many complex tasks, such as image segmen tation ( Song et al. , 2018 ) and article editing ( Zhang et al. , 2017 ). An imp ortan t problem is that how we b o ost collective intelligence for solving these complex tasks. Our approach provides a wa y to p oten tially reduce this problem to how w e can devise effective correlation metrics to capture the information quality of these resp onses. All ab o ve are in teresting future research directions. Ac knowledgemen ts This research is supported in part b y National Science F oundation (NSF) under gran ts CCF-1718549, IIS-2007951, and I IS-2007887, and the Defense Adv anced Researc h Pro jects Agency (D ARP A) and Space and Nav al W arfare Systems Center P acific (SSC Pacific) under Con tract No. N66001-19-C-4014. The views and conclusions con tained herein are those of the authors and should not be in terpreted as necessarily representing the official p olicies, either expressed or implied, of NSF, DARP A, SSC P acific or the U.S. Gov ernment. The U.S. Gov ernment is authorized to repro duce and distribute reprints for go vernmen tal purp oses not withstanding an y copyrigh t annotation therein. References Arpit Agarwal, Debmaly a Mandal, David C Park es, and Nisarg Shah. Peer prediction with heterogeneous users. In ACM EC , pages 81–98. ACM, 2017. Denis Allard, Alessandro Comunian, and Philipp e Renard. Probabilit y aggregation metho ds in geoscience. Mathematic al Ge oscienc es , 44(5):545–581, 2012. Willy Aspinall. A route to more tractable exp ert advice. Natur e , 463(7279):294–295, 2010. P av el Atanaso v, Phillip Rescob er, Eric Stone, Sam uel A Swift, Emile Serv an-Schreiber, Philip T etlo c k, Lyle Ungar, and Barbara Mellers. Distilling the wisdom of crowds: Prediction markets vs. prediction p olls. Management scienc e , 63(3):691–706, 2016. Jonathan Baron, Barbara A Mellers, Philip E T etlo c k, Eric Stone, and Lyle H Ungar. Tw o reasons to mak e aggregated probability forecasts more extreme. De cision Analysis , 11(2):133–145, 2014. Jeffrey P Bigham, Mic hael S Bernstein, and Eytan Adar. Human-computer interaction and collectiv e in tel- ligence. Handb o ok of c ol le ctive intel ligenc e , 57, 2015. 15 Da vid V Budescu and Ev a Chen. Identifying exp ertise to extract the wisdom of crowds. Management Scienc e , 61(2):267–280, 2015. Lorenzo Barb eris Canonico, Christopher Flathmann, and Nathan McNeese. Collectively intelligen t teams: In tegrating team cognition, collectiv e in telligence, and ai for future teaming. In Pr o c e e dings of the Human F actors and Er gonomics So ciety Annual Me eting , volume 63, pages 1466–1470. SAGE Publications Sage CA: Los Angeles, CA, 2019. Rob ert T Clemen. Combining forecasts: A review and annotated bibliography . International journal of for e c asting , 5(4):559–583, 1989. Rob ert T Clemen and Rob ert L Winkler. Com bining economic forecasts. Journal of Business & Ec onomic Statistics , 4(1):39–46, 1986. F rancis Galton. V ox p opuli, 1907. Go od Judgmen t Pro ject GJP . GJP Data, 2016. URL https://doi.org/10.7910/DVN/BPCDH5 . Tilmann Gneiting and Adrian E Raftery . Strictly prop er scoring rules, prediction, and estimation. Journal of the Americ an Statistic al Asso ciation , 102(477):359–378, 2007. Naman Go el and Boi F altings. Deep bay esian trust : A dominant and fair incentiv e mechanism for crowd, 2019. Daniel G Goldstein, Randolph Preston McAfee, and Siddharth Suri. The wisdom of smaller, smarter cro wds. In ACM EC , pages 471–488. ACM, 2014. IARP A. Hybrid forecasting comp etition. https://www.iarpa.gov/index.php/research- programs/hfc? id=661 , 2019. Victor Richmond R Jose and Robert L Winkler. Simple robust av erages of forecasts: Some empirical results. International journal of for e c asting , 24(1):163–169, 2008. Y uqing Kong. Dominantly truthful multi-task p eer prediction with a constant num b er of tasks. In SODA , pages 2398–2411. SIAM, 2020. Y uqing Kong, Katrina Ligett, and Gran t Schoeneb eck. Putting p eer prediction under the micro (economic) scop e and making truth-telling fo cal. In WINE , pages 251–264. Springer, 2016. Ralf HJM Kurvers, Stefan M Herzog, Ralph Hertwig, Jens Krause, Mehdi Moussaid, Giusepp e Argenziano, Iris Zalaudek, Patt y A Carney , and Max W olf. How to detect high-p erforming individuals and groups: Decision similarity predicts accuracy . Scienc e advanc es , 5(11):eaa w9011, 2019. Mic hael D Lee and Irina Danileiko. Using cognitive mo dels to com bine probabilit y estimates. Judgment and De cision Making , 9(3):259, 2014. Christopher Lin, Mausam Mausam, and Daniel W eld. Dynamically switc hing betw een synergistic w orkflows for crowdsourcing. In Pr o c e e dings of the AAAI Confer enc e on Artificial Intel ligenc e , v olume 26, 2012. Qiang Liu, Jian Peng, and Alexander T Ihler. V ariational inference for crowdsourcing. In A dvanc es in neur al information pr o c essing systems , pages 692–700, 2012. Y ang Liu, Michael Gordon, Juntao W ang, Michael Bishop, Yiling Chen, Thomas Pfeiffer, Charles Twardy , and Domenico Viganola. Replication markets: Results, lessons, challenges and opp ortunities in ai repli- cation. arXiv pr eprint arXiv:2005.04543 , 2020a. Y ang Liu, Jun tao W ang, and Yiling Chen. Surrogate scoring rules. In Pr o c e e dings of the 21st ACM Confer enc e on Ec onomics and Computation , pages 853–871, 2020b. Alb ert E Mannes, Ric hard P Larric k, and Jac k B Soll. The so cial psychology of the wisdom of crowds. 2012. 16 John McCoy and Drazen Prelec. A statistical mo del for aggregating judgments by incorp orating p eer predictions. arXiv pr eprint arXiv:1703.04778 , 2017. Barbara Mellers, Eric Stone, T erry Murray , Angela Minster, Nick Rohrbaugh, Mic hael Bishop, Ev a Chen, Josh ua Bak er, Y uan Hou, Mic hael Horo witz, et al. Iden tifying and c ultiv ating sup erforecasters as a method of improving probabilistic predictions. Persp e ctives on Psycholo gic al Scienc e , 10(3):267–281, 2015. N. Miller, P . Resnic k, and R. Zeckhauser. Eliciting informative feedback: The peer-prediction metho d. Management Scienc e , 51(9):1359–1373, 2005. Zita Orav ecz, Joachim V andekerc khov e, and William H Batchelder. Bay esian cultural consensus theory . Field Metho ds , 26(3):207–222, 2014. Zita Orav ecz, Royce Anders, and William H Batchelder. Hierarc hical bay esian mo deling for test theory without an answer key . Psychometrika , 80(2):341–364, 2015. Asa P alley and Ville Satop¨ a¨ a. Boosting the wisdom of crowds within a single judgmen t problem: Selective a veraging based on p eer predictions. Available at SSRN 3504286 , 2020. Asa B Palley and Jack B Soll. Extracting the wisdom of crowds when information is shared. Management Scienc e , 65(5):2291–2309, 2019. Dra ˇ zen Prelec. A bay esian truth serum for sub jectiv e data. Scienc e , 306(5695):462–466, 2004. Dra ˇ zen Prelec, H Sebastian Seung, and John McCoy . A solution to the single-question cro wd wisdom problem. Natur e , 541(7638):532, 2017. Goran Radano vic, Boi F altings, and Radu Jurca. Incentiv es for effort in cro wdsourcing using the peer truth serum. ACM TIST , 7(4):48, 2016. Ro opesh Ranjan and Tilmann Gneiting. Combining probability forecasts. Journal of the R oyal Statistic al So ciety: Series B (Statistic al Metho dolo gy) , 72(1):71–91, 2010. Ville A Satop¨ a¨ a, Jonathan Baron, Dean P F oster, Barbara A Mellers, Philip E T etlo ck, and Lyle H Un- gar. Com bining m ultiple probabilit y predictions using a simple logit model. International Journal of F or e c asting , 30(2):344–356, 2014a. Ville A Satop¨ a¨ a, Shane T Jensen, Barbara A Mellers, Philip E T etlo ck, Lyle H Ungar, et al. Probability aggregation in time-series: Dynamic hierarchical mo deling of sparse expert b eliefs. Annals of Applie d Statistics , 8(2):1256–1280, 2014b. Victor Shna yder, Arpit Agarwal, Rafael F rongillo, and Da vid C P arkes. Informed truthfulness in multi-task p eer prediction. In ACM EC , pages 179–196. ACM, 2016. Jean Y Song, Raymond F ok, Alan Lundgard, F an Y ang, Juho Kim, and W alter S Lasec ki. Two to ols are b etter than one: T o ol diversit y as a means of impro ving aggregate crowd performance. In 23r d International Confer enc e on Intel ligent User Interfac es , pages 559–570, 2018. Lyle Ungar, Barbara Mellers, Ville Satop¨ a¨ a, Philip T etlo c k, and Jon Baron. The go od judgmen t pro ject: A large scale test of differen t metho ds of com bining exp ert predictions. In 2012 AAAI F al l Symp osium Series , 2012. Guanc hun W ang, Sanjeev R Kulk arni, H Vincent Poor, and Daniel N Osherson. Aggregating large sets of probabilistic forecasts by weigh ted coherent adjustmen t. De cision Analysis , 8(2):128–144, 2011. Daniel S W eld, Christopher H Lin, and Jonathan Bragg. Artificial intelligence and collectiv e intelligence. Handb o ok of Col le ctive Intel ligenc e , pages 89–114, 2015. Jens Witko wski and Da vid Park es. A robust bay esian truth serum for small p opulations. In Pr o c e e dings of the 26th AAAI Confer enc e on Artificial Intel ligenc e , AAAI ’12, 2012. 17 Jens Witk owski, P av el Atanaso v, Lyle H Ungar, and Andreas Krause. Prop er pro xy scoring rules. In Thirty-First AAAI Confer enc e on Artificial Intel ligenc e , 2017. Am y X Zhang, Lea V erou, and David Karger. Wikum: Bridging discussion forums and wikis using recursive summarization. In Pr o c e e dings of the 2017 ACM Confer enc e on Computer Supp orte d Co op er ative Work and So cial Computing , pages 2082–2096, 2017. 18 App endix A F orecast aggregation p erformance on small datasets This section examines the p erformance of our P AS-aided aggregators and b enc hmark aggregators o v er smaller datasets. Sp ecifically , for each of the 14 original datasets, w e uniformly randomly sample without replacemen t 20 binary even ts and 30 or 50 participants to generate a smaller dataset. W e keep the original participant set for those MIT datasets with less than 30 or 50 participan ts (T able 2 ). Mean while, we still maintain that eac h even t receives at least 10 responses and that eac h participan t forecasts on at least 15 ev ents. The HFC datasets are to o sparse to generate suc h small datasets with this forecast densit y requiremen t. Therefore, w e remov e them from the examination. F or each of the remaining 11 datasets, w e run random sampling 30 times and rep ort the av erage aggregation p erformance ov er these 30 runs under the Brier score in T able 8a (50 participants sampled for eac h run) and T able 8b (30 participants sampled for eac h run). Both tables demonstrate a consistent impro vemen t of using the Mean-based P AS-aided aggregators, with b etter relativ e p erformance (compared to the b enc hmarks) ac hieved on the datasets with 50 participan ts sampled. This result indicates that our P AS-aided aggregators can also be applied to relatively small prediction datasets (e.g., the forecasts collected at the cold-start stage of long-term forecast competitions, where no ground truth information has yet b een resolved) and impro ve the aggregation p erformance. 19 Base aggr. Score G1 G2 G3 G4 M1a M1b M1c M2 M3 M4a M4b Mean DMI .124 .070 .087 .047 .389 .175 .143 .496 .407 .468 .273 CA .115 .066 .076 .040 .371 .161 .134 .490 .406 .500 .269 PTS .117 .066 .076 .041 .423 .177 .135 .496 .407 .500 .269 SSR .121 .073 .076 .050 .492 .200 .134 .483 .406 .505 .277 PSR .120 .070 .076 .051 .524 .183 .170 .498 .413 .504 .283 Logit DMI .115 .067 .093 .032 .540 .172 .091 .563 .507 .607 .348 CA .112 .060 .087 .027 .524 .156 .091 .557 .508 .662 .330 PTS .112 .060 .087 .029 .597 .190 .085 .566 .506 .668 .339 SSR .106 .064 .088 .043 .660 .232 .073 .545 .505 .674 .368 PSR .113 .067 .085 .049 .691 .199 .132 .588 .515 .652 .359 Mean (benchmark) .193 .166 .106 .135 .453 .347 .345 .480 .399 .436 .310 Logit (benchmark) .115 .084 .076 .055 .683 .438 .340 .497 .497 .599 .458 VI (benchmark) .213 .110 .093 .070 .673 .265 .308 .862 .577 .721 .353 SP (benchmark) N/A N/A N/A N/A .507 .190 .310 .890 .487 .637 .543 (a) 20 binary ev ents and 50 participan ts sampled for each run Base aggr. Score G1 G2 G3 G4 M1a M1b M1c M2 M3 M4a M4b Mean DMI .166 .096 .090 .080 .442 .160 .160 .473 .390 .512 .313 CA .154 .083 .059 .061 .440 .153 .151 .479 .386 .534 .296 PTS .154 .085 .061 .062 .465 .155 .154 .472 .388 .547 .299 SSR .156 .085 .061 .064 .480 .150 .152 .481 .393 .542 .321 PSR .158 .082 .062 .064 .528 .170 .179 .482 .397 .540 .332 Logit DMI .158 .080 .077 .054 .611 .153 .133 .515 .500 .692 .397 CA .149 .068 .062 .048 .640 .140 .112 .539 .494 .713 .363 PTS .148 .069 .063 .046 .652 .151 .120 .519 .496 .712 .380 SSR .141 .069 .066 .049 .697 .136 .093 .527 .500 .696 .416 PSR .152 .072 .069 .057 .720 .176 .160 .551 .507 .704 .412 Mean (benchmark) .208 .161 .091 .135 .473 .327 .358 .475 .387 .475 .354 Logit (benchmark) .134 .084 .054 .058 .720 .381 .380 .491 .493 .665 .512 VI (benchmark) .239 .113 .080 .077 .724 .224 .274 .869 .550 .773 .411 SP (benchmark) nan nan nan nan .573 .230 .313 .903 .440 .687 .647 (b) 20 binary ev ents and 30 participan ts sampled for each run T able 8: The mean Brier scores (range [0, 2], the lo wer the b etter) of differen t aggregators on randomly sampled sub-datasets of 4 GJP datasets and 7 MIT datasets. The best mean Brier score among b enc hmarks on each dataset is marked b y b old font. The mean Brier scores of 10 P AS-aided a ggregators that outp erform the b est of b enchmarks on each dataset are highligh ted in green ; those outp erforming the second b est of b enc hmarks are highligh ted in yello w ; the w orst mean Brier scores o ver all aggregators on each dataset are highligh ted in red . 20 B Missing tables Base aggr. P AS G1 G2 G3 G4 H1 H2 H3 M1a M1b M1c M2 M3 M4a M4b Mean DMI .236 .141 .143 .148 .370 .324 .187 .377 .242 .230 .625 .643 .880 .414 CA .241 .146 .156 .162 .351 .323 .235 .477 .238 .230 .642 .640 .880 .450 PTS .231 .142 .141 .147 .326 .317 .194 .499 .236 .230 .666 .640 .880 .450 SSR .246 .188 .148 .143 .314 .309 .212 .632 .226 .291 .669 .643 .911 .502 PSR .261 .134 .139 .126 .314 .310 .198 .642 .221 .236 .678 .644 .880 .441 Logit DMI .176 .115 .137 .084 .344 .327 .260 .583 .125 .094 .643 1.097 1.495 .691 CA .168 .114 .128 .073 .244 .330 .271 1.040 .100 .094 .734 1.093 1.495 .689 PTS .167 .114 .135 .082 .280 .329 .280 1.132 .111 .094 .776 1.093 1.495 .689 SSR .155 .110 .135 .093 .209 .318 .282 1.542 .086 .138 .746 1.125 1.431 .920 PSR .164 .115 .136 .091 .272 .334 .267 1.517 .075 .054 .805 1.097 1.495 .766 Mean (b enchmark) .365 .323 .242 .296 .373 .313 .268 .633 .520 .521 .672 .634 .686 .497 Logit (b enchmark) .185 .138 .131 .119 .205 .267 .257 1.338 .782 .524 .718 1.047 1.380 1.003 VI (b enchmark) .548 .176 .198 .206 .712 .699 .384 1.356 .073 .010 1.859 1.385 1.464 .741 MP (b enchmark) N/A N/A N/A N/A N/A N/A N/A .597 .384 .373 .671 .804 1.226 1.042 T able 9: The mean log scores (the low er the b etter) of different aggregators on binary ev ents of 14 datasets. The b est mean score among b enc hmarks on eac h dataset is mark ed by b old font. The mean scores of 10 P AS-aided aggregators that outp erform the b est of b enc hmarks on each dataset are highligh ted in green ; those outp erforming the second b est of b enc hmarks are highlighted in yello w ; the worst mean scores ov er all aggregators on each dataset are highlighted in red . Aggregators M1a M1b M1c M2 M3 M4a M4b Cultural consensus mo del ( Orav ecz et al. , 2015 ) 0.55 0.02 0.00 0.76 0.56 0.64 0.31 Cognitive hierarchy mo del ( Lee and Danileiko , 2014 ) - - 0.32 0.48 0.46 - - Statistical surprising p opularit y metho d ( McCoy and Prelec , 2017 ) 0.24 0.06 0.02 0.60 0.51 0.65 0.35 T able 10: The mean Brier scores of three statistical-inference-based aggregators on MIT datasets rep orted b y McCoy and Prelec ( 2017 ). The Brier score has b een re-scaled to the range [0,2] to align with ours. The b old fon t indicates the only places where these aggregators outperform the worst of our fiv e mean-based P AS aggregators. Mean-based Logit-based Benc hmarks DMI CA PTS SSR PSR DMI CA PTS SSR PSR Mean Logit VI MP 9 Mean (Brier) .221 .226 .226 .225 .230 .244 .247 .254 .257 .266 .290 .317 .315 .423 Std. (Brier) .150 .153 .158 .155 .168 .212 .221 .225 .233 .249 .130 .224 .267 .125 Mean (Log) .354 .369 .364 .388 .373 .441 .470 .484 .521 .513 .453 .578 .701 .728 Std. (Log) .214 .213 .222 .231 .234 .409 .444 .452 .508 .508 .154 .446 .573 .297 T able 11: The mean and the standard deviation of the mean Brier scores and the mean log scores of the 10 P AS-aided aggregators and the b enc hmarks o ver 14 datasets. The b old fon t means that the data is significan tly b etter than the coun terparts of all b enc hmarks with p-v alue < 0.05. 9 As MP only applies to 7 MIT datasets, the data of MP in this table should not be compared directly to that of the others. 21 C More details ab out the datasets GJP datasets. GJP datasets ( Ungar et al. , 2012 ; Atanaso v et al. , 2016 ; GJP , 2016 ) contain four datasets ab out forecasts on geopolitical questions collected from 2011 to 2014. The dataset of eac h year differs in both the forecasting questions and the participan t p ools, and is denoted b y G1 to G4 in our paper corresp ondingly . When collecting the forecasts, the participan ts w ere given differen t treatmen ts: some were giv en probabilistic training, some were teamed up and allo wed to discuss with each other b efore giving their own predictions, and some made predictions solely . Participan ts who demonstrated consistently high prediction accuracy across different forecasting questions in previous y ears were iden tified as “sup erforecasters” and were teamed up to participate in the forecast tournament in the following year ( Mellers et al. , 2015 ). The participants’ prediction accuracy has also b een shown to b e influenced by different treatmen ts ( Atanaso v et al. , 2016 ). HF C datasets. HF C datasets ( IARP A , 2019 ) contain three datasets collected in 2018 with forecasting questions ranging from geopolitics to economics and en vironmen ts. W e use H1 to denote the dataset collected b y the Hughes Researc h Lab oratories (HRL), with participants recruited from Amazon Mechanical T urk (AMT) as H1. W e use H2 to denote the dataset collected by IRAP A, with participants recruited from Amazon Mechanical T urk (AMT). Moreo ver, we use H3 to denote the dataset collected by IRAP A, with participan ts recruited via in vitation and recommendation. MIT datasets. MIT datasets contain sev en datasets (denoted as M1a, M1b, M1c, M2, M3, M4a, M4b ( Prelec et al. , 2017 )) collected for seven forecast b eha vior studies and for testing forecast aggregation metho ds. The forecasting questions range from the capital of states to the price interv al of some artw orks and some trivial kno wledge. In the datasets, participants w ere ask ed to giv e binary (y es-or-no) answ ers to the forecasting questions instead of probabilistic predictions. Datasets M1c, M2, M3 also contain the confidence for the binary answ ers, whic h w e directly in terpret in to probabilistic predictions of the fa vored binary answ ers when we aggregate the predictions. Moreo ver, all of the seven datasets contain participan ts’ answers to an additional question for eac h forecasting question. This additional question asks the participants to estimate the p ercen tage of other forecasters who choose the same binary answer as theirs. This information will b e used by one of the b enchmark aggregators we test. In particular, these seven datasets were collected to develop and ev aluate information elicitation and aggregation methods on questions where the ma jority is lik ely to b e wrong ( Prelec et al. , 2017 ). Therefore, these datasets hav e a relativ ely lo w participants’ p erformance. 22 D Missing Pro ofs Pr o of. Proof of Theorem 2 . The result ab out DMI is implied by Theorem 6.4 in ( Kong , 2020 ). The result ab out CA can b e pro ved in a similar wa y by observing that CA is asymptotically equiv alent to determinant m utual information for binary even ts. F or completeness, we present the pro of for CA . W e also present the pro of for PTS b elow. F or CA : First, w e in tro duce the determinant mutual information ( Kong , 2020 ). Consider tw o discrete random v ariable X and W with the same supp ort V . Let d ( X, W ) = ( d u,v ) u,v ∈V b e the joint distribution of X and W , where d u,v = Pr( X = u and W = v ). Let d ( X | W ) = ( d u,v ) u,v ∈V b e the conditional probability matrix, where d u,v = Pr( X = u | W = v ). Definition 1. The determinant mutual information of two binary r andom variables X and W is | det( d ( X, W )) | . W e denote the determinant mutual information of X , W as D M ( X , W ) = | det( d ( X , W )) | . W e will in volv e the use of its tw o prop erties introduced b elo w. Prop osition 3. L et X , X 0 , W b e thr e e discr ete r andom variables with the same supp ort, and X 0 is less informative than X w.r.t. W , i.e., X 0 is indep endent of W c onditioning X . • (Information monotonicity) D M ( X 0 , W ) ≤ D M ( X , W ) . The ine quality is strict when | det( d ( X , W )) | 6 = 0 and d ( X 0 | X ) is not a p ermutation matrix. • (R elatively invarianc e) D M ( X 0 , W ) = D M ( X, W ) | det( d ( X 0 | X )) | . The information monotonicity is the key property for b eing a mutual information. No w, by Assumption A1 and the truthfulness assumption, we can consider the rep orted signal of agent j on a generic task as a binary random v ariable p j ( p j ∈ { 0 , 1 } ). W e denote the ground truth of the generic task as y and denote the join t distribution of agen t j ’s reports and the ground truth as D j, ∗ = ( d j, ∗ u,v ) u,v ∈{ 0 , 1 } , where d j, ∗ u,v = Pr( p j = u and y = v ). Similarly , let D j,k b e the joint distribution of agent j ’s and agent k ’s rep orts. The empirical joint distribution ˆ D j,k is an unbiased and asymptotically consistent estimator of the true joint distribution D j,k . So asymptotically ( | M | → ∞ ), w e hav e ˆ D j,k = D j,k . 10 Recall that CA compute the reward of agent j given a reference p eer k as: R CA j = ∆ · S g n (∆) , where ∆ = ( δ u,v ) u,v ∈{ 0 , 1 } , and δ u,v = ˆ d j,k u,v − ˆ d j u · ˆ d k v . By trivial math, we hav e δ 0 , 0 = δ 1 , 1 = − δ 0 , 1 = − δ 1 , 0 and R DMI j = 2 | δ 0 , 0 | . F urther, asymptotically ( |M| → ∞ ), | δ 0 , 0 | = d j,k 0 , 0 − d j 0 · d k 0 = | det( D j,k ) | = D M ( p j , p k ). Th us, we get that asymptotically ( |M| → ∞ ), R DMI j = D M ( p j , p k ) . No w, for another agen t j 0 6 = j , when k is also selected as her reference p eer, we hav e asymptotically ( | M | → ∞ ), R DMI j − R DMI j 0 = D M ( p j , p k ) − DM ( p 0 j , p k ) = | D M ( p k | y ) | ( DM ( p j , y ) − DM ( p 0 j , y )) (4) ∝ D M ( p j , y ) − DM ( p 0 j , y ) This equation holds due to the relatively in v ariance of the determinant m utual information and the Assump- tion A2. This equation holds for an y reference agent k 6 = j, j 0 . Th us, when agent j has a higher m utual information w.r.t. ground truth, she gets a higher reward than agent j ’ for any reference p eer k 6 = j, j 0 . Asymptotically ( |N | → ∞ ), with sufficien t n umber of agen ts, the probabilit y that agen t j 0 ( j ) are selected as agent j ’s ( j 0 ’s) reference p eer can b e neglected. Therefore, the exp ected reward, with exp ectation taken o ver the reference p eer selection, of CA rank the agents in the order of the determinant m utual information of agents’ reports w.r.t. ground truth. F or PTS: By the coun terpart argumen t in the pro of for CA , under Assumption A1, w e can treat the rep ort p j as a random v ariable for a generic task with ground truth v ariable denoted as y . Let ¯ d u,v = P j ∈M d j, ∗ u,v / |M| 10 F or simplicity of exp osition, we abuse the use of “=” here. 23 represen ting the join t distribution of a uniformly randomly pick ed rep ort on a task w.r.t. the ground truth. Let ¯ d u = ¯ d u, 0 + ¯ d u, 1 , u ∈ { 0 , 1 } b e the marginal probability that an av erage agen t rep orting p j = 1. F urther, let q v b e the marginal distribution of y = v . W e hav e q v = d j, ∗ 0 ,v + d j, ∗ 1 ,v , ∀ v ∈ { 0 , 1 } . Let E [ R PTS j ] be the exp ected rew ard of agent j under PTS . E [ R PTS j ] = 1 |N | − 1 X k 6 = j d j,k 0 , 0 ¯ p − j, 0 + d j,k 1 , 1 ¯ p − j, 1 ( |M| → ∞ ) = 1 |N | − 1 X k 6 = j q 0 d j, ∗ 0 , 0 d k, ∗ 0 , 0 + q 1 d j, ∗ 0 , 1 d k, ∗ 0 , 1 ¯ p − j, 0 + q 0 d j, ∗ 1 , 0 d k, ∗ 1 , 0 + q 1 d j, ∗ 1 , 1 d k, ∗ 1 , 1 ¯ p − j, 1 (Assumption A2) = q 0 d j, ∗ 0 , 0 ¯ d 0 , 0 + q 1 d j, ∗ 0 , 1 ¯ d 0 , 1 ¯ d 0 + q 0 d j, ∗ 1 , 0 ¯ d 1 , 0 + q 1 d j, ∗ 1 , 1 ¯ d 1 , 1 ¯ d 1 ( |N | → ∞ ) = q 0 d j, ∗ 0 , 0 ¯ d 0 , 0 + q 1 ( q 1 − d j, ∗ 1 , 1 ) ¯ d 0 , 1 ¯ d 0 + q 0 ( q 0 − d j, ∗ 0 , 0 ) ¯ d 1 , 0 + q 1 d j, ∗ 1 , 1 ¯ d 1 , 1 ¯ d 1 = q 0 ¯ d 0 , 0 ¯ d 0 − ¯ d 1 , 0 ¯ d 1 d j, ∗ 0 , 0 + q 0 ¯ d 1 , 1 ¯ d 1 − ¯ d 1 , 0 ¯ d 0 d j, ∗ 1 , 1 + constant, where constant = ( q 1 ) 2 ¯ d 0 , 1 ¯ d 0 + ( q 0 ) 2 ¯ d 1 , 0 ¯ d 1 . As with sufficient n umber of agents, q 0 , q 1 and ¯ d u,v , ¯ d u , ( u, v ∈ { 0 , 1 } ) are all constant to eac h agent, therefore, for each agent j ∈ N , E [ R PTS j ] is the same w eighted function of the matching probability d j, ∗ 0 , 0 and d j, ∗ 1 , 1 of the agent. Note that ¯ d 0 , 0 ¯ d 0 and ¯ d 1 , 1 ¯ d 1 are the precision of the mean prediction of agents for y = 0 and y = 1. If ¯ d 0 , 0 ¯ d 0 > 0 . 5 and ¯ d 1 , 1 ¯ d 1 > 0 . 5, we hav e ¯ d 0 , 0 ¯ d 0 − ¯ d 0 , 1 ¯ d 1 > 0 . 5 and ¯ d 1 , 1 ¯ d 1 − ¯ d 1 , 0 ¯ d 0 > 0 . 5, then E [ R PTS j ] is a negative function of a an exp ected w eighted 0-1 loss of agent j . (Note that an exp ected weigh ted 0-1 loss of agent j is expressed by αd j, ∗ 0 , 1 + β d j, ∗ 1 , 0 ( α, β > 0).) 24 E V ariational inference for crowdsourcing V ariational inference for crowdsourcing ( VI ), prop osed in ( Liu et al. , 2012 ), is a computationally efficien t inference metho d that builds a statistical mo del on agents’ predictions ov er multiple questions to infer the ground truths of these questions. T o mak e our pap er self-contained, we present a s k etc h of VI , which mainly follo ws Section 3.2 of ( Liu et al. , 2012 ). VI consider the following statistical settings (assumptions): Agents provide binary predictions, i.e., p ij ∈ { 0 , 1 } and hav e heterogeneous prediction abilities. Each agent j ’s prediction abilit y is characterized b y a parameter c j , which is the correct probability of its predictions, i.e., c j = P ( p ij = y i ) , ∀ i ∈ M j . Moreov er, c j , ∀ j are i.i.d. drawn from some b eta distribution Beta( α , β ) with an exp ectation no less than 0.5, i.e., E c j ∼ Beta( α,β ) ≥ 0 . 5 , ∀ j . The goal of VI is to compute the marginal distribution of y i under the ab ov e statistical assumptions. The marginal distribution is then used as the aggregated prediction ˆ q i for even t i . Let δ ij = 1 { p ij = y i } . The joint p osterior distribution of the agents’ abilities c := ( c 1 , ..., c |N | ) and the ground truth outcomes y := ( y 1 , ..., y |M| ) conditioned on the predictions and hyper-parameter α, β is P ( c , y |{ p ij } ij , α, β } ) ∝ Y j ∈N P ( c j | α, β ) Y i ∈M j c δ ij j (1 − c j ) (1 − δ ij ) . (5) Therefore, the marginal distribution of y i is P ( y i |{ p ij } ij , α, β ) = P y i =0 , 1 ,i ∈M\{ i } R c P ( c , y |{ p ij } ij , α, β } ) d c . P ( y i |{ p ij } ij , α, β ) is computationally hard due to the summation of all y i , i ∈ M and the integration of c j , j ∈ N . T o solv e this obstacle, VI adopts the mean field metho d. It appro ximates P ( c , y |{ p ij } ij , α, β } ) with a fully factorized distribution d ( c , y ) = Q i ∈M µ i ( y i ) Q j ∈N ν j ( c j ) for some probability distribution function µ i , i ∈ M and ν j , j ∈ N , and determines the b est d ( c , y ) by minimizing the the KL divergence: KL[ d ( c , y ) | P ( c , y |{ p ij } ij , α, β } )] = − E ( c , y ) ∼ d ( c , y ) [log( P ( c , y |{ p ij } ij , α, β } ))] − X i ∈M H ( µ i ) − X j ∈N H ( ν j ) (6) H ( · ) is the entrop y function. Noting the prior distribution of q j , j ∈ N is a Beta distribution, we could deriv e the following mean field up date using the blo ck coordinate descen t metho d: Up dating µ i : µ i ( y i ) ∝ Y j ∈N i a δ ij j b 1 − δ ij j , (7) Up dating ν j : ν i ( c j ) ∝ Beta( X i ∈M j µ i ( p ij ) + α, X i ∈M j µ i (1 − p ij ) + β ) , (8) where a j = exp( E c j ∼ ν j [ln c j ]) and b j = exp( E c j ∼ ν j [ln(1 − c j )]). Let ¯ c j = E c j ∼ ν j [ c j ]. Applying the first order appro ximation ln (1 + x ) ≈ x with x = c j − ¯ c j ¯ c j on a j and b j , we can get a j ≈ ¯ c j and b j ≈ 1 − ¯ c j and an appro ximate mean field up date, Up dating µ i : µ i ( y i ) ∝ Y j ∈N i ¯ c δ ij j (1 − ¯ c j ) 1 − δ ij , (9) Up dating ν j :¯ c j = P i ∈M j µ i ( p ij ) + α |M j | + α + β . (10) In our exp eriments, w e used the tw o-coin mo del extension of VI ( Liu et al. , 2012 ), where the prediction abilit y of an agen t j is characterized by tw o parameters c j, 0 and c j, 1 with c j, 0 := P ( p ij = 0 | y i = 0) and c j, 1 := P ( p ij = 1 | y i = 1). Consequently , the approximate mean field up date is Up dating µ i : µ i ( y i ) ∝ Y j ∈N i ¯ c δ ij j,y i (1 − ¯ c j,y i ) 1 − δ ij , y i ∈ { 0 , 1 } , (11) Up dating ν j :¯ c j,k = P i ∈M j µ i ( k ) + α P i ∈M j 1 { p ij = k } + α + β , k ∈ { 0 , 1 } . (12) 25 ( Prelec et al. , 2017 ) has tested the p erformance of the culture consensus mo del ( CCM ) ( Orav ecz et al. , 2014 ) and the cognitive hierarch y model ( CHM ) ( Lee and Danileiko , 2014 ) on MIT datasets, while CCM has a sligh tly b etter performance. VI has the similar p erformance on MIT datasets compared to CCM . Therefore, w e choose to test VI as a representativ e for multi-task aggregators. 26 F Surrogate scoring rules W e illustrate how the error rates e 0 , e 1 of the noisy signal z for a particular agent j ∗ on a particular task i ∗ is estimated. W e assume that the joint distribution of age n ts’ reports and the ground truth on each even t is the same. Let s i,j ∼ Bern( p i,j ) b e a pr e diction signal for any agent j ∈ N on a task i 0 ∈ M . z can b e equiv alently defined as a prediction signal uniformly randomly pic ked from set { s i,j } j 6 = j ∗ . At the same time, for each ev ent i 0 ∈ M , we uniformly randomly dra w three prediction signals without replacement from { s i,j } j 6 = j ∗ and denote them by r i, 1 , r i, 2 , r i, 3 . Given our assumption and with sufficiently n umber of agents, w e know that the error rates of r i, 1 , r i, 2 , r i, 3 w.r.t. the ground truth y i are the same to those of z for any i ∈ N . Let p 1 b e the prior probability of y i = 1 for any i ∈ N . Therefore, we ha ve the following three equations. The left-hand-sides of ab ov e equations are the theoretical probabilities of a single, a double and a triple dra ws of z for an even t i turning out to b e all 1 given the error rates of z , resp ectively . The right-hand-sides are the observed real frequencies of a single, a double and a triple draws of predictions on an even t turning out to b e all 1, which can b e computed using signal set { s i,j } i,j . These three equations hold exactly with infinite num b er of even ts and agents and hold appro ximately with finite num b er of even ts and agents. In non-trivial cases, there alw ays exists a unique solution to these three equations while satisfies e 1 + e 0 < 1 and p 1 ∈ [0 , 1]. The solution is given in Algorithm 2 . Algorithm 2 Estimation of error rates e 0 and e 1 for an agent j ∗ on task i ∗ Require: All predictions P Ensure: e 0 , e 1 1: Construct the prediction signal sets { s i,j } i,j 6 = j ∗ 2: Uniformly randomly select predictions without replacement z i , r i, 1 , r i, 2 , r i, 3 from { s i,j } j 6 = j ∗ for all i ∈ N . 11 3: c 1 ← P i ∈N 1 { r i, 1 =1 } N ; c 2 ← P i ∈N 1 { r i, 1 = r i, 2 =1 } N ; c 3 ← P i ∈N 1 { r i, 1 = r i, 2 = r i, 3 =1 } N 4: a ← c 3 − c 1 c 2 c 2 − c 2 1 ; b ← c 1 c 3 − c 2 2 c 2 − c 2 1 5: e 0 ← a 2 − √ a 2 − 4 b 2 ; e 1 ← 1 − a 2 − √ a 2 − 4 b 2 11 F or each even t i , we can select the prediction from each agent j ∈ N i with probabilities prop ortional to 1 | M j | so as to achiev e the uniformly randomly selection. 27
Original Paper
Loading high-quality paper...
Comments & Academic Discussion
Loading comments...
Leave a Comment