Live Visualization of Dynamic Software Cities with Heat Map Overlays
💡 Research Summary
The paper introduces a novel approach for visualizing software systems as three‑dimensional “software cities” enriched with heat‑map overlays that are generated from live trace analysis. While prior work on the city metaphor has largely focused on static code metrics or on pre‑recorded execution traces, this work integrates dynamic, near‑real‑time data collection, processing, and rendering into a single toolchain, eliminating the need for manual or semi‑automatic post‑processing steps.
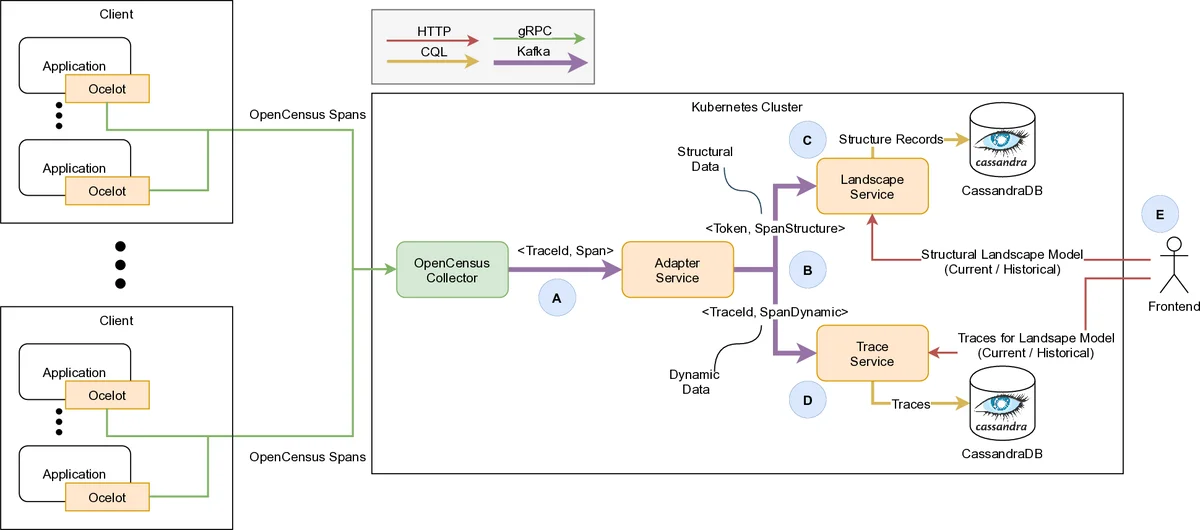
The implementation builds on the open‑source web‑based visualization platform ExplorViz, which already visualizes live runtime behavior by monitoring method entry and exit events via the inspectIT Ocelot Java agent. Collected events are split into structural data (host, application name, fully qualified operation name) and dynamic data (timestamps). Structural information, which is highly repetitive, is cached to reduce network traffic, while dynamic data is used to reconstruct execution traces. These traces are fed into the backend, which aggregates them and forwards the results to the frontend. The frontend updates the entire city and heat‑map visualization every ten seconds—a period chosen empirically to balance responsiveness with cognitive load.
The heat‑map overlay is rendered as a semi‑transparent layer positioned above the city’s foundation plate. A thin black line links each class to its corresponding heat‑map cell, preserving spatial awareness without obscuring the underlying city. Four built‑in metrics are provided: (1) Instance Count (number of objects created per class), (2) Import Coupling (ICCD – total outgoing method calls from a class), (3) Export Coupling (ECCD – total incoming method calls to a class), and (4) a combined Import & Export Coupling. Users can switch metrics at runtime through a dialog box. Moreover, the metric‑calculation engine is exposed as a JavaScript web‑worker API, allowing developers to plug in custom metrics without modifying the core system.
Three temporal modes govern how metric values are aggregated over time:
- Snapshot mode – only the data from the current snapshot are considered, providing a view equivalent to the static city but with the added clarity of a heat‑map.
- Continuously aggregated mode – each new metric value is combined with 50 % of the previous value, yielding a smoothed, cumulative view that highlights long‑term trends such as steadily increasing call volumes.
- Windowed mode – the current snapshot is compared against a snapshot taken a configurable number of intervals earlier (default window = 10). The resulting heat‑map values can be positive (growth) or negative (decline), enabling rapid detection of sudden changes.
Interaction features complement the visual encoding. Hovering over a class or a communication line displays a popup with precise statistics (e.g., “46 objects instantiated for BaseEntity”). Clicking a class fades out unrelated elements, emphasizing its direct communication partners. The heat‑map can be toggled on or off; when off, the city’s communication lines remain fully visible, allowing users to focus on call flow without the color overlay.
ExplorViz, together with its heat‑map extension, is packaged as Docker images and is publicly available. The same backend and data pipeline are reused in an augmented‑reality (AR) client, and a forthcoming virtual‑reality (VR) client will also support the heat‑map overlay, demonstrating the approach’s portability across interaction modalities.
The authors acknowledge that metric computation currently occurs on the client side, which may limit scalability for very large systems. Future work includes moving these calculations to a dedicated backend service, potentially leveraging cloud‑native architectures to improve performance and support larger trace volumes.
In summary, the paper contributes a fully integrated, live visualization pipeline that couples the intuitive spatial metaphor of software cities with dynamic heat‑map overlays. By allowing developers to select runtime‑dependent metrics on the fly and to view them through multiple temporal lenses, the system provides immediate insight into performance hotspots, object‑creation patterns, and coupling dynamics that are difficult to obtain from static analyses alone. This capability promises to accelerate program comprehension, debugging, and refactoring activities in modern, continuously evolving software systems.
Comments & Academic Discussion
Loading comments...
Leave a Comment