Modeling contact networks of patients and MRSA spread in Swedish hospitals
Methicillin-resistant Staphylococcus aureus (MRSA) is a difficult-to-treat infection that only in the European Union affects about 150,000 patients and causes extra costs of 380 million Euros annually to the health-care systems. Increasing efforts have been taken to mitigate the epidemics and to avoid potential outbreaks in low endemic settings. Understanding the population dynamics of MRSA through modeling is essential to identify the causal mechanisms driving the epidemics and to generalize conclusions to different contexts. We develop an innovative high-resolution spatiotemporal contact network model of interactions between patients to reproduce the hospital population in the context of the Stockholm County in Sweden and simulate the spread of MRSA within this population. Our model captures the spatial and temporal heterogeneity caused by human behavior and by the dynamics of mobility within wards and hospitals. We estimate that in this population the epidemic threshold is at about 0.008. We also identify that these heterogeneous contact patterns cause the emergence of super-spreader patients and a polynomial growth of the epidemic curve. We finally study the effect of standard intervention control strategies and identify that screening is more effective than improved hygienic in order to cause smaller or null outbreaks.
💡 Research Summary
This study presents a high‑resolution spatiotemporal contact‑network model of patient interactions in the entire Stockholm County health‑care system and uses it to simulate the spread of methicillin‑resistant Staphylococcus aureus (MRSA). The authors compiled admission and discharge records for 743,182 patients across 485 hospitals and nursing homes over 3,059 consecutive days, yielding 2,019,236 admission events. By linking any two patients who were present in the same ward on the same day, they constructed a daily‑updated network in which vertices represent patients and edges represent indirect contacts mediated by health‑care workers or contaminated surfaces. This approach captures the true heterogeneity of ward sizes, weekly and seasonal admission cycles, and the highly skewed distributions of length‑of‑stay and inter‑admission intervals (most stays are short, but a long‑tail of very long stays exists).
The infection dynamics are modeled with three states: Uninfected (U), Contagious (C), and Infectious (I). Upon contact, an uninfected patient becomes contagious with probability βC if the source is C and βI if the source is I; the authors set βC = βI = β for simplicity. A contagious patient either progresses to infectious after an average incubation of τinfec = 9.5 days with probability μ = 0.2, or recovers to U after τrec = 370 days. Treated patients recover after τtreat = 7 days, and admitted patients may already be contagious with probability αadm (set to zero in the threshold analysis).
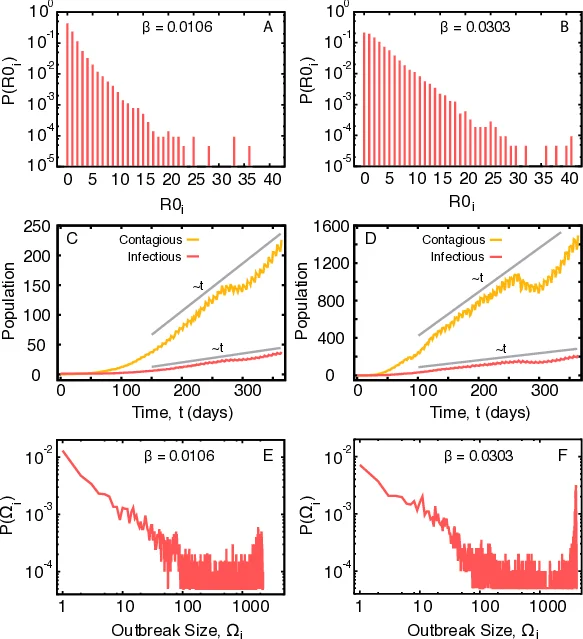
Using a one‑year slice of the data (170,839 patients, 20,483,587 contacts), the authors performed stochastic simulations to estimate the basic reproduction number R0 as a function of β. They repeatedly seeded a single infected individual and counted secondary infections over 20,000 runs. The epidemic threshold was identified at β ≈ 0.008, where R0 = 1; above this value, large outbreaks become probable. The distribution of secondary infections is highly skewed: most patients generate zero or one secondary case, while a tiny fraction can cause up to 40 secondary infections, acting as super‑spreaders. These individuals typically have unusually long ward stays or move across many wards, giving them high temporal degree in the network.
Temporal dynamics show an initial lag of about 100 days followed by a polynomial (approximately linear) increase in the number of contagious and infectious patients. Weekly and seasonal admission patterns imprint modest fluctuations on the epidemic curve, but the overall growth remains dominated by network heterogeneity rather than deterministic exponential rise. Outbreak size (Ω = C + I at day 365) exhibits a bimodal distribution: many simulations end with fewer than 100 cases, yet there is a non‑negligible probability of outbreaks exceeding 1,000 cases.
Intervention simulations compared two standard control measures: (1) admission screening that reduces αadm (i.e., fewer patients enter already contagious) and (2) improved hand hygiene that reduces β. Screening consistently produced a larger reduction in final outbreak size than hygiene improvement, highlighting that early removal of potential index cases is more effective than modest reductions in per‑contact transmission probability in a highly heterogeneous contact network.
The paper acknowledges limitations: health‑care workers are not explicitly modeled, community transmission is ignored, and the emergence of new antibiotic resistance during the simulation period is not considered. Nevertheless, by grounding the model in real patient flow data, the study demonstrates that realistic temporal contact structures generate super‑spreader phenomena, polynomial epidemic growth, and a wide spectrum of possible outbreak sizes. The findings suggest that infection‑control policies in low‑endemic settings should prioritize admission screening and targeted monitoring of patients with prolonged or frequent ward exposure, rather than relying solely on generic hygiene campaigns.
Comments & Academic Discussion
Loading comments...
Leave a Comment