Phase mapping for cardiac unipolar electrograms with neural network instead of phase transformation
A phase mapping is an approach to processing signals of electrograms recorded from the surface of cardiac tissue. The main concept of phase mapping is the application of the phase transformation with the aim to obtain signals with useful properties. In our study, we propose to use a simple sawtooth signal instead of a phase signal for processing of electrogram data and building of the phase maps. We denote transformation that can provide this signal as a phase-like transformation (PLT). PLT defined via a convolutional neural network that is trained on a dataset from computer models of cardiac tissue electrophysiology. The proposed approaches were validated on data from the detailed personalized model of the human torso electrophysiology. This paper includes visualization of the phase map based on PLT and shows the robustness of the proposed approaches in the analysis of the complex non-stationary periodic activity of the excitable cardiac tissue.
💡 Research Summary
This paper proposes a novel approach to phase mapping of cardiac unipolar electrograms by replacing the traditional mathematical phase transformation with a data‑driven “phase‑like transformation” (PLT) that yields a simple sawtooth waveform ranging from 0 to 1. The authors argue that conventional phase mapping—typically based on Hilbert transforms or time‑shifts—suffers from sensitivity to noise, requires subjective parameter tuning, and becomes ambiguous for non‑stationary periodic activity such as atrial flutter or ventricular tachycardia. To overcome these limitations, they define the essential characteristics of a phase signal (a sharp transition at each depolarization and a linear decay between transitions) and encode them in a sawtooth shape.
Training data are generated from a 1‑D myocardial strand model solved with the monodomain equation. By varying stimulation frequency (2000–200 Hz), conduction velocity (10–80 cm/s), electrode height (5–80 mm) and position, they obtain 300 synthetic unipolar electrograms, each 4096 ms long at 1 kHz sampling. For each signal, the depolarization instant is identified using a 0 mV threshold, and a corresponding sawtooth target is constructed. The dataset is split evenly into training and validation sets (150 signals each).
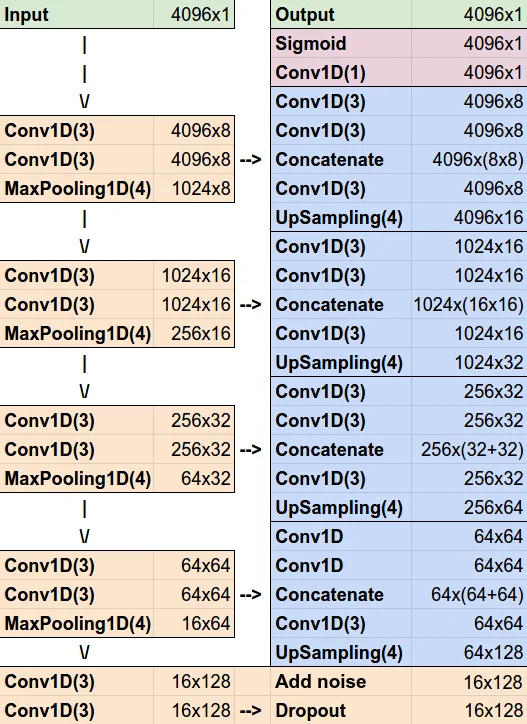
A convolutional neural network based on the U‑Net architecture is adapted to 1‑D inputs: kernels are 3 × 1, pooling/upsampling layers are 4 × 1, dropout (30 %) and Gaussian noise (σ = 0.2) are added for robustness, and the loss combines mean absolute error (MAE) and mean squared error (MSE) with equal weight. The network processes windows of 4096 samples and outputs a PLT signal of the same length. Training converges after more than 100 epochs, achieving MAE = 0.0250 and MSE = 0.0021 on the training set, and MAE = 0.0327, MSE = 0.0024 on validation. Manual inspection shows only 10 mis‑detected upstrokes out of 859 (≈1.2 %). The model handles both regular periodic activation and high‑frequency alternans, with occasional failure on signals containing closely spaced double peaks.
To test generalization, the authors apply the trained network to a highly realistic, personalized 3‑D torso‑heart model. This model is built from a patient’s CT scan, includes anatomically accurate geometry of the ventricles, lungs, blood pools, and spinal cord, and assigns tissue‑specific conductivities. Electrophysiology is simulated with the TNNP06 ventricular cell model, a bidomain formulation for wave propagation, and an S1‑S2 protocol to initiate a re‑entrant spiral wave. The simulation yields 34 354 unipolar electrograms (4096 ms each) on the heart surface, representing a realistic ventricular tachycardia scenario.
Applying the PLT network to these signals produces sawtooth waveforms that, when interpolated spatially, generate phase maps. The resulting maps clearly delineate the rotor core and the wavefront, matching the ground‑truth activation pattern obtained directly from the simulated transmembrane potentials. Quantitatively, the MAE on the 3‑D test set rises to 0.0888 (MSE = 0.0266), reflecting the increased complexity, far‑field effects, and noise inherent in the full torso model. Nevertheless, the visual correspondence demonstrates that the PLT approach retains the essential topological information required for arrhythmia localization.
The study’s contributions are threefold: (1) it replaces a handcrafted phase extraction pipeline with a learned mapping, eliminating the need for manual filter design and parameter selection; (2) it introduces an interpretable target waveform (the sawtooth) that directly encodes depolarization events, making the transformation transparent; (3) it shows that a network trained on simple 1‑D data can successfully generalize to sophisticated 3‑D personalized simulations, suggesting feasibility for clinical translation.
In the discussion, the authors highlight the robustness of PLT to non‑stationary periodic behavior and its potential applicability to various recording configurations, including single‑point catheters, multi‑electrode arrays, balloon catheters, and both invasive and non‑invasive mapping systems. They acknowledge the higher error on realistic data and propose future work on (i) validation with actual patient recordings, (ii) model compression for real‑time deployment, and (iii) extension to multi‑channel inputs using 2‑D/3‑D convolutional architectures. If successfully translated, PLT could improve the accuracy and speed of arrhythmia mapping, aiding catheter ablation procedures and advancing the understanding of complex cardiac electrophysiology.
Comments & Academic Discussion
Loading comments...
Leave a Comment