PathologyGAN: Learning deep representations of cancer tissue
Histopathological images of tumors contain abundant information about how tumors grow and how they interact with their micro-environment. Better understanding of tissue phenotypes in these images could reveal novel determinants of pathological proces…
Authors: Adalberto Claudio Quiros, Roderick Murray-Smith, Ke Yuan
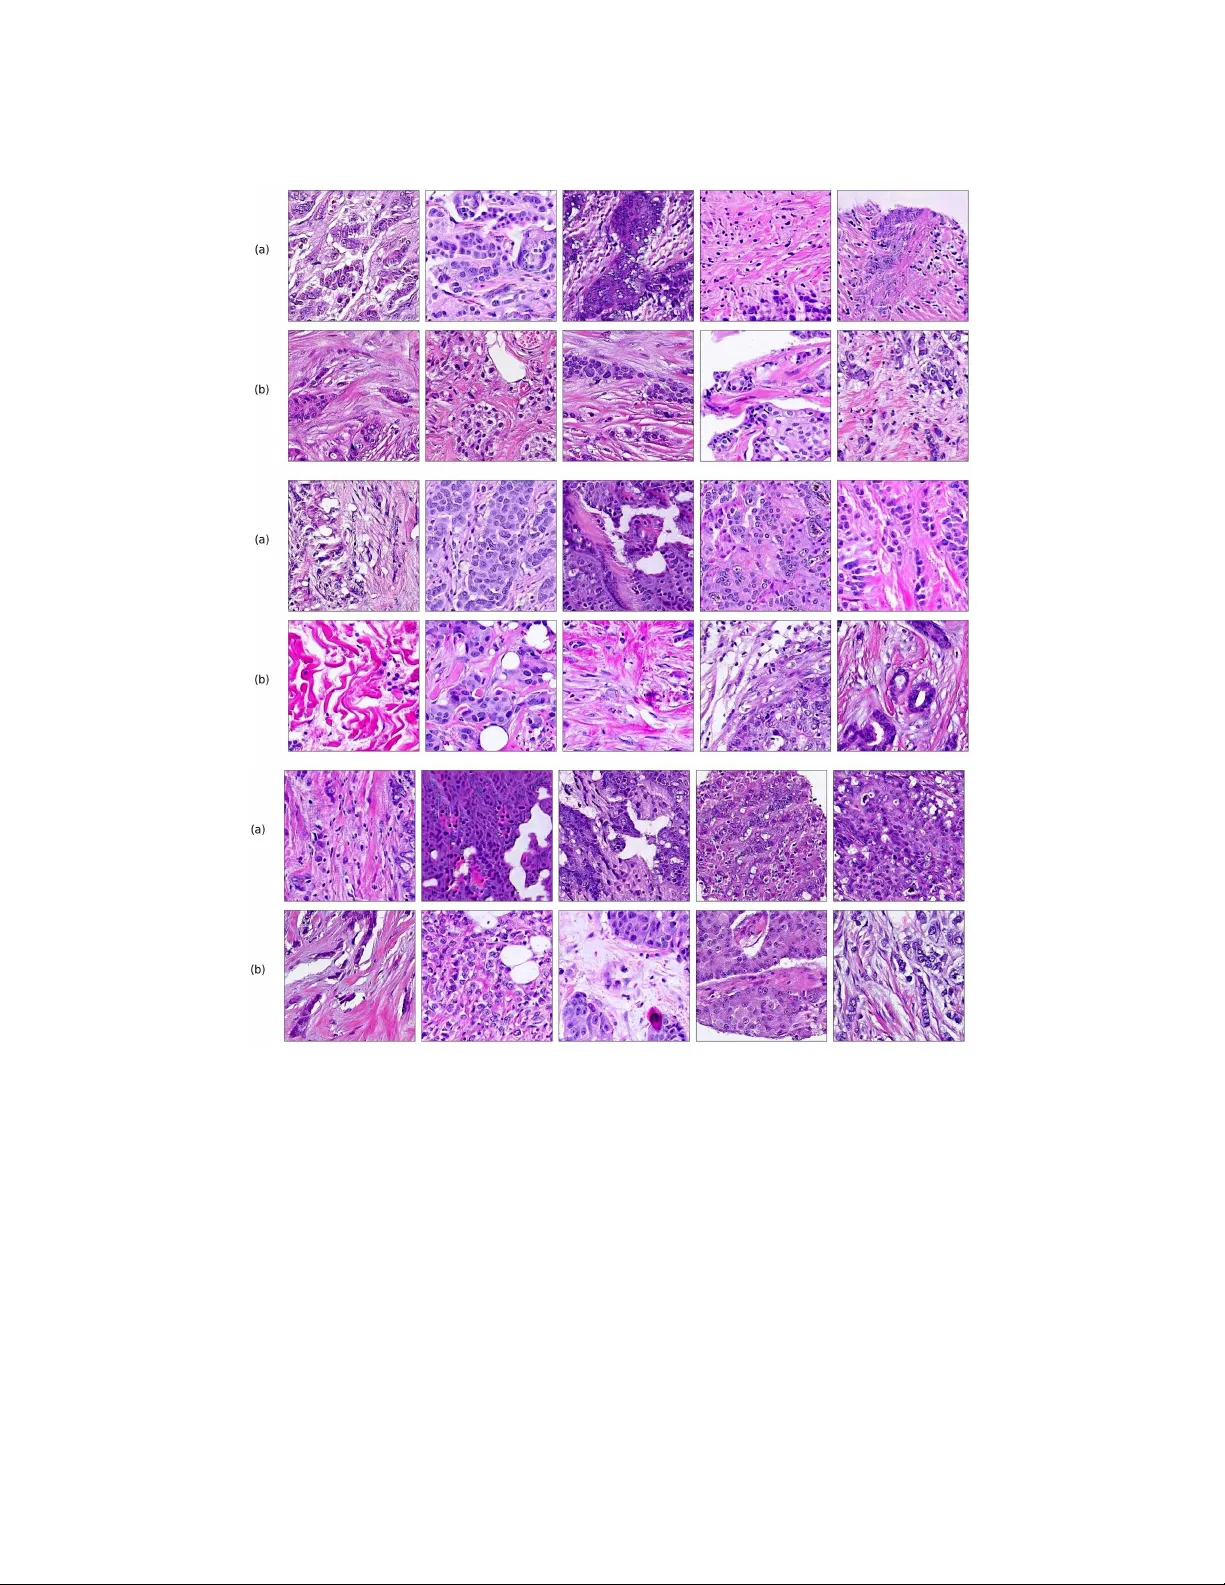
Journal of Machine Learning for Biomedical Imaging. 2021:4. pp 1-48 Submitted 09/2020; Published 03/2021 Special Issue: Medical Imaging with Deep Learning (MIDL) 2020 P athologyGAN: Learning deep represen tations of cancer tissue Adalb erto Claudio Quiros a.claudio-quiros.1@research.gla.ac.uk School of Computing Science, Universit y of Glasgo w, Glasgow, Scotland, UK Ro deric k Murray-Smith roderick.murra y-smith@glasgo w.ac.uk School of Computing Science, Universit y of Glasgo w, Glasgow, Scotland, UK Ke Y uan ke.yuan@glasgo w.ac.uk School of Computing Science, Universit y of Glasgo w, Glasgow, Scotland, UK Abstract Histopathological images of tumors contain abundant information about how tumors gro w and ho w they in teract with their micro-environmen t. Better understanding of tissue phenot yp es in these images could rev eal nov el determinants of pathological pro cesses un- derlying cancer, and in turn improv e diagnosis and treatment options. Adv ances of Deep learning makes it ideal to ac hieve those goals, how ev er, its application is limited b y the cost of high quality lab els from patients data. Unsup ervised learning, in particular, deep generativ e mo dels with representation learning prop erties provides an alternative path to further understand cancer tissue phenot yp es, capturing tissue morphologies. In this pap er, we dev elop a framework which allows Generativ e Adv ersarial Netw orks (GANs) to capture key tissue features and uses these characteristics to give structure to its laten t space. T o this end, we trained our mo del on tw o differen t datasets, an H&E colorectal cancer tissue from the National Center for T umor diseases (NCT, Germany) and an H&E breast cancer tissue from the Netherlands Cancer Institute (NKI, Netherlands) and V ancouv er General Hospital (V GH, Canada). Comp osed of 86 slide images and 576 tissue micro-arrays (TMAs) resp ectively . W e show that our mo del generates high quality images, with a F r´ ec het Inception Dis- tance (FID) of 16.65 (breast cancer) and 32.05 (colorectal cancer). W e further assess the qualit y of the images with cancer tissue characteristics (e.g. count of cancer, lympho cytes, or stromal cells), using quantitativ e information to calculate the FID and showing consis- ten t performance of 9.86. Additionally , the laten t space of our mo del sho ws an in terpretable structure and allows seman tic v ector op erations that translate in to tissue feature transfor- mations. F urthermore, ratings from tw o exp ert pathologists found no significant difference b et ween our generated tissue images from real ones. The co de, generated images, and pretrained mo dels are av ailable at https://github. com/AdalbertoCq/Pathology- GAN Keyw ords: Generativ e Adversarial Netw orks, Digital Pathology . 1. In troduction Cancer is a disease with extensiv e heterogeneity , where malignant cells in teract with im- m une cells, stromal cells, surrounding tissues and blo o d vessels. Histological images, suc h as haematoxylin and eosin (H&E) stained tissue microarrays (TMAs) or whole slide images (WSI), are a high-throughput imaging technology used to study such diversit y . Despite b e- © 2021 Adalberto Claudio Quiros, Ro derick Murra y-Smith, & Ke Y uan. License: CC-BY 4.0. Guest Editors: Marleen de Bruijne, T al Arb el, Ismail Ben Ayed, Herv ´ e Lombaert https://www.melba- journal.org/article/21657 . A.C.Q., R.M.S., & K.Y. ing ubiquitous in clinical settings, analytical to ols of H&E images remain primitive, making these v aluable data largely under-explored. Consequen tly , cellular behaviours and the tu- mor micro environmen t recorded in H&E images remain p o orly understo o d. Increasing our understanding of such micro environmen t interaction holds the k ey for improv ed diagnosis and treatmen t of cancer. Figure 1: (a): Images (224 × 224) from P athologyGAN trained on H&E breast cancer tissue. (b): Real images, Inception-V1 closest neighbor to the generated ab ov e in (a). (c): Images (224 × 224) from P athologyGAN trained on H&E colorectal cancer tissue. (d) Real images, Inception-V1 closest neighbor to the generated ab ov e in (c). The motiv ation for our work is to dev elop metho ds that could lead to a b etter under- standing of phenotype diversit y b etw een/within tumors. W e hypothesize that this div ersity could b e substan tial giv en the highly diverse genomic and transcriptomic landscap es ob- serv ed in large scale molecular profiling of tumors across multiple cancer t yp es (Campb ell et al., 2020). W e argue that represen tation learning with GAN-based mo dels is the most promising to ac hieve our goal for the tw o follo wing reasons: 1. By b eing able to generate high fidelit y images, a GAN could learn the most relev ant descriptions of tissue phenot yp e. 2. The contin uous latent representation learned b y GANs could help us quan tify differ- ences in tissue arc hitectures free from sup ervised information. In this pap er, we propose to use Generative Adv ersarial Net works (GANs) to learn represen tations of en tire tissue architectures and define an interpretable latent space (e.g. colour, texture, spatial features of cancer and normal cells, and their in teraction). T o this end, w e present the following contributions: 1. W e prop ose P athologyGANs to generate high fidelit y cancer tissue images from a structured laten t space. The mo del com bines BigGAN (Brock et al., 2019), St yleGAN 2 P a thologyGAN: Learning deep represent a tions of cancer tissue (Karras et al., 2019) and Relativistic Average Discriminator (Jolico eur-Martineau, 2019). 2. W e assess the qualit y of the generated images through t wo different methods: con- v olutional Inception-V1 features and prognostic features of the cancer tissue, such as coun ts and densities of different cell t yp es (Bec k et al., 2011; Y uan et al., 2012). Both features are b enchmark ed with the F r´ ec het Inception Distance (FID). The results sho w that the mo del captures pathologically meaningful representations, and when ev aluated by exp ert pathologists, generated tissue images are not distinct from real tissue images. 3. W e sho w that our mo del induces an ordered latent space based on tissue characteristics (e.g. cancer cell density or tissue t ype), this allows to perform linear v ector op erations that transfer in to high level tissue image changes. 2. Related W orks Deep learning has b een widely applied in digital pathology , from these we can differen tiate b et ween sup ervised and unsup ervised learning approaches. Sup ervised applications range from mitosis and cell detection (T ellez et al., 2018; Xu et al., 2019a; Zhang et al., 2019b), nuclei and tumor segmentation (Qu et al., 2019; Qaiser et al., 2019), histological subt yp e classification (Coudray et al., 2018; W ei et al., 2019), to surviv al and prognosis modeling (Katzman et al., 2018; Lee et al., 2018). Recently , there ha ve b een dev elopmen ts on relating phenot yp e to the molecular underpining of tumors, in particular genomic characteristics (Coudray et al., 2018; Sc hmauch et al., 2020; W o erl et al., 2020; F u et al., 2020; Coudray and Tsirigos, 2020; Kather et al., 2020), and spatial transcriptomics (Vic k ovic et al., 2019; He et al., 2020; Bergenstr ˚ ahle et al., 2020a; Sc hmauc h et al., 2020; W ang et al., 2020; Bergenstr ˚ ahle et al., 2020b). F urthermore, previous tradi- tional computer vision approaches (Bec k et al., 2011; Y uan et al., 2012) already iden tified correlation b et ween phenotype patterns and patient surviv al. These w orks highlight the imp ortance and opp ortunities that building tissue phenot yp e representations bring, provid- ing insight into surviv al or genomic information purely from tissue images such as TMA or WSIs. Nev ertheless, these metho ds require data labeling which is usually costly in time and effort, this is particularly the case for sequencing deriv ed molecular labels. In addition, deep learning approaches hav e a lack of interpretabilit y , whic h is also a ma jor limiting factor in making a real impact in clinical practice. Unsup ervised learning applications mostly fo cus on n uclei (Xu et al., 2016; Mahmo o d et al., 2018), tissue (de Bel et al., 2018), or region-of-interest segmentation (Gadermayr et al., 2018, 2019), b esides stain transformation (Rana et al., 2018; Xu et al., 2019b) and normalization (Zanjani et al., 2018). Within unsup ervised learning, generative mo dels hav e b een briefly used for tissue generation (Levine et al., 2020), ho w ever this mo del lac ks of represen tation learning prop erties. On the other hand, there has b een some initial work on building cell and n uclei representations with mo dels suc h as InfoGAN (Hu et al., 2019) and Sparse Auto-Enco ders (Hou et al., 2019), although these models fo cus either on small sections of images or cells instead of larger tiles of tissue. 3 A.C.Q., R.M.S., & K.Y. Building phenot yp e representations based on tissue arc hitecture and cellular attributes remains a field to b e further explored. Generative mo dels offer the ability to create tissue represen tations without exp ensiv e lab els and representations not only correlated with a predicted outcome (as in discriminativ e mo dels), rather creating represen tations based on the similarities across the c haracteristics of tissue samples. T ak e a p oin t mutation for example, it is no w understo o d that mutations are frequently only shared in subp opulations of cancer cells within a tumor (Gerstung et al., 2020; Dentro et al., 2020). Therefore, it’s difficult to kno w if a p oint m utation is presen ted in the cells recorded in a image. F undamen tally , s upervised approach is limited b y the fact that molecular and clinical lab els are often obtained from materials that are physically different from the ones in the images. The asso ciations are therefore highly indirect and sub ject to man y confounding factors F rom generative mo dels, Generative Adv ersarial Net works (GANs) hav e b ecome in- creasingly p opular, applied to different domains from imaging to signal pro cessing. GANs (Go o dfello w et al., 2014) are able to learn high fidelity and diverse data representations from a target distribution. This is done with a generator, G ( z ), that maps random noise, z ∼ p z ( z ), to samples that resemble the target data, x ∼ p data ( x ), and a discriminator, D ( x ), whose goal is to distinguish b et ween real and generated samples. The goal of a GAN is find the equilibrium in the min-max problem: min G max D V ( D , G ) = E x ∼ p data ( x ) [log D ( x )] + E z ∼ p z ( z ) [log(1 − D ( G ( z )))] . (1) Since its introduction, mo deling distributions of images has b ecome the mainstream ap- plication for GANs, firstly in tro duced by Radford et al. (2015). State-of-the-art GANs such as BigGAN (Bro c k et al., 2019) and StyleGAN (Karras et al., 2019) hav e recently b een use to generate impressiv e high-resolution images. Additionally , solutions like Sp ectral Normal- ization GANs (Miyato et al., 2018), Self-Atten tion GANs (Zhang et al., 2019a), and also BigGAN hav e ac hieved high div ersity images in data sets like ImageNet (Deng et al., 2009), with 14 million images and 20 thousand different classes. A t the same time, ev aluating these mo dels has been a challenging task. Man y different metrics such as Inception Score (IS) (Salimans et al., 2016), F r´ ec het Inception Distance (FID) (Heusel et al., 2017), Max- im um Mean Discrepancy (MMD) (Gretton et al., 2012), Kernel Inception Distance (KID) (Bi ´ nk owski et al., 2018), and 1-Nearest Neighbor classifier (1-NN) (Lop ez-Paz and Oquab, 2016) hav e b een prop osed to do so, and thorough empirical studies (Huang et al., 2018; Barratt and Sharma, 2018) ha ve shed some ligh t on the adv antages and disadv antages of eac h them. Ho w ever, the selection of a feature space is crucial for using these metrics. In our work w e tak e a step tow ards developing a generativ e mo del that learns phenot ypes through tissue architectures and cellular characteristics, introducing a GAN with represen- tation learning prop erties and an in terpretable latent space. W e advocate that in the future these phenot yp e represen tations could giv e us insight ab out the div ersity within/across can- cer types and their relation to genomic, transcriptomic, and surviv al information; finally leading to b etter treatmen t and prognosis of the disease. 4 P a thologyGAN: Learning deep represent a tions of cancer tissue Figure 2: High level arc hitecture of PathologyGAN. W e include details of eac h mo dule’s arc hitecture in the App endix K 3. Metho ds 3.1 PathologyGAN W e used BigGAN (Bro ck et al., 2019) as a baseline architecture and in tro duced changes whic h empirically impro ved the F r´ ec het Inception Distance (FID) and the structure of the laten t space. BigGAN has b een shown to b e a successful GAN in replicating datasets with a div erse n umber of classes and large amoun ts of samples, suc h as ImageNet with approximately 1 M samples and 20 K classes. F or this reason, we theorize that such mo del will b e able to learn and replicate the div erse tissue phenot yp es con tained in whole slide images (WSI), b eing able to handle the large amoun t of tiles/patches resulting from diving the WSIs. W e follow ed the same arc hitecture as BigGAN, emplo y ed Spectral Normalization in b oth generator and discriminator, self atten tion lay ers, and w e also use orthogonal initialization and regularization as men tioned in the original pap er. W e mak e use of the Relativistic Av erage Discriminator (Jolico eur-Martineau, 2019), where the discriminator’s goal is to estimate the probability of the real data b eing more realistic than the fake. W e take this approach instead of follo wing the Hinge loss (Lim and Y e, 2017) as the GAN ob jective. W e find that this c hange mak es the mo del conv ergence faster and pro duce higher quality images. Images using the Hinge loss did not capture the morphological structure of the tissue (we pro vide examples of these results in the App endix C). The discriminator, and generator loss function are form ulated as in Equations 2 and 3, where P is the distribution of real data, Q is the distribution for the fak e data, and C ( x ) is the non-transformed discriminator output or critic: L Dis = − E x r ∼ P h log ˜ D ( x r ) i − E x f ∼ Q h log 1 − ˜ D ( x f ) i , (2) L Gen = − E x f ∼ Q h log ˜ D ( x f ) i − E x r ∼ P h log 1 − ˜ D ( x r ) i , (3) ˜ D ( x r ) = sigmoid C ( x r ) − E x f ∼ Q C ( x f ) ) , (4) ˜ D ( x f ) = sigmoid ( C ( x f ) − E x r ∼ P C ( x r )) . (5) Additionally , we introduce t wo elements from StyleGAN (Karras et al., 2019) with the purp ose of allowing the generator to freely optimize the latent space and find high-level features of the cancer tissue. First, a mapping net work M comp osed by four dense ResNet la yers (He et al., 2016), placed after the latent vector z ∼ N (0 , I ), with the purp ose of 5 A.C.Q., R.M.S., & K.Y. allo wing the generator to find the latent space w ∼ M ( z ) that b etter disentangles the laten t factors of v ariation. Secondly , style mixing regularization, where t wo different latent vectors z 1 and z 2 are run in to the mapping netw ork and fed at the same time to the generator, randomly choosing a lay er in the generator and providing w 1 and w 2 to the different halves of the generator (e.g. on a generator of ten la yers and being six the randomly selected la yer, w 1 w ould feed lay ers one to six and w 2 seven to ten). St yle mixing regularization encourages the generator to localize the high level features of the images in the laten t space. W e also use adaptiv e instance normalization (AdaIN) on our mo dels, providing the entire laten t vectors. W e use the Adam optimizer (Kingma and Ba, 2014) with β 1 = 0 . 5 and same learning rates of 0 . 0001 for b oth generator and discriminator, the discriminator takes 5 steps for eac h of the generator. Eac h mo del was trained on an NVIDIA Titan R TX 24 GB for appro ximately 72 hours. 3.2 Datasets T o train our mo del, we used t w o different datasets, an H&E colorectal cancer tissue from the National Cen ter for T umor diseases (NCT, German y) (Kather et al., 2018) and an H&E breast cancer tissue from the Netherlands Cancer Institute (NKI, Netherlands) and V ancouv er General Hospital (VGH, Canada) (Beck et al., 2011). The H&E breast c ancer dataset was built from the Netherlands Cancer Institute (NKI) cohort and the V ancouv er General Hospital (VGH) cohort with 248 and 328 patients, re- sp ectiv ely . Each of them include TMA images, along with clinical patien t data such as surviv al time, and estrogen-receptor (ER) status. The original TMA images all ha v e a resolution of 1128 × 720 pixels, and we split eac h of the images in to smaller patches of 224 × 224, and allo wed them to o verlap b y 50%. W e also p erformed data augmentation on these images, a rotation of 90 ◦ , and 180 ◦ , and vertical and horizontal inv ersion. W e filtered out images in whic h the tissue cov ers less than 70% of the area. In total this yield to a training set of 249K images and a test set of 62K. The H&E colorectal cancer dataset provides 100K tissue images of 224 × 224 resolution, eac h image has an asso ciated t yp e of tissue label: adip ose, bac kground, debris, lympho cytes, m ucus, smo oth muscle, normal colon mucosa, cancer-asso ciated stroma, and colorectal ade- no carcinoma epithelium (tumor). This dataset is comp osed of 86 H&E stained human cancer tissue slides. In order to c heck the mo del’s flexibility and abilit y to work with dif- feren t datasets, w e decided not to apply any data augmen tation and use the tiles as they are pro vided. In b oth datasets, w e perform the partition ov er the total tissue patc hes, not according to patients, since our goal is to verify the ability to learn tissue representations. W e trained our mo del on the V GH/NKI and NCT datasets for 45 and 130 ep o chs, resp ectively . In App endix B we study the mo del’s capacity in capturing represen tations with small size datasets (5K, 10K, 20K) v erifying its conv erge and abilit y to generalize. 3.3 Ev aluation metric on PathologyGAN The F r ´ ec het Inception Distance (FID) (Heusel et al., 2017) is a common metric used to measure GANs p erformance, and it quantifies the GAN’s ability to learn and repro duce the 6 P a thologyGAN: Learning deep represent a tions of cancer tissue original data distribution. The goal of the FID score is to measure the similarit y in qualit y and div ersity b etw een real p data ( x ) and generated data p g ( x ). Instead to measuring the distance b etw een the real and generated distributions in the pixel space, it uses a pretrained ImageNet Inception Netw ork (Szegedy et al., 2016) to extract features of each image, reducing the dimensionalit y of the samples and obtaining vision-relev an t features. F eature samples are fitted into a m ultiv ariate Gaussian distribution obtaining real N ( µ data , Σ data ) and generated N ( µ g , Σ g ) feature distributions. Finally , it uses the F r´ ec het distance (F r´ ec het, 1957) to measure the difference b etw een the t w o distributions: F I D = d 2 (( µ data , Σ data ) , ( µ g , Σ g )) = || µ data − µ g || 2 2 + T r (Σ data + Σ g − 2(Σ data Σ g ) 1 / 2 ) W e ev aluate our mo del b y calculating the FID score from 10 K generated images and randomly sampling 10 K real images. W e fo cus on using FID as it is a common GAN ev aluation metho d (Brock et al., 2019; Karras et al., 2019; Miyato et al., 2018; Zhang et al., 2019a) that reliably captures differences b et ween the real and generated distributions. Additionally , w e provide more details in App endix I comparing FID to other metrics such as Kernel Inception Distance (KID) or 1-Nearest Neigh b or (1-NN) in the context of digital pathology . 3.4 Quantification of cancer cells in generated images - Breast cancer tissue In our results, we use the counts of cancer cells and other cellular information as a mean to measure the image qualit y and represen tation learning properties of our model. The motiv ation b ehind this approac h is to ensure that our mo del capture meaningful and faithful represen tations of the tissue. W e use this information in tw o differen t w a ys, first as an alternativ e feature space for FID as eac h image is translated in to a vector with cellular information in the tissue, and secondly to lab el each generated tissue image according to the cancer cell density , allowing us to visualize the represen tation learning prop erties of our mo del’s latent space. The CRImage tool (Y uan et al., 2012) uses an SVM classifier to provide quantitativ e information ab out tumor cellular c haracteristics in tissue. This approach allo ws us to gath er pathological information in the images, namely the num b er of cancer cells, the n um b er of other t yp es of cells (suc h as stromal or lympho cytes), and the ratio of tumorous cells p er area. W e limit the use of this information to breast cancer tissue, since the to ol was devel- op ed for this sp ecific case. Figure 3 displays an example of ho w the CRImage captures the differen t cells in the generated images, such as cancer cells, stromal cells, and lympho cytes. Finally , we created 8 differen t classes that account for coun ts of cancer cells in the tissue image, and consecutiv ely we label each generated image with the corresp onding class, allo wing us to more clearly visualize the relation b etw een cancer cell density in generated images and the mo del’s laten t space. 3.5 Tissue t yp e assignation on generated images - Colorectal cancer tissue The NCT colorectal cancer dataset pro vides a label along each 224 × 224 tissue sample and we mak e use of this information to label eac h generated image with a type of tissue, assigning a label to eac h generated image according to the 10-nearest neighbors of real images in the Inception-V1 feature space. 7 A.C.Q., R.M.S., & K.Y. Figure 3: CRImage identifies different cell types in our generated images. Cancer cells are highligh ted with a green color, while lympho cytes and stromal cells are high- ligh ted in yello w. In Figure 4 we show generated images on the left column and the nearest real neighbors on the remaining columns. W e present the differen t tissue types: tumor (i), stroma (j), m uscle (k), lympho cytes (l), debris (m), mucus (n), adip ose (o), and bac kground (p). F rom this e xample, we can conclude that distance in feature space gives a go o d reference to find the tissue t yp e of generated images. 4. Results 4.1 Image qualit y analysis W e study the fidelit y of the generated images and their distribution in relation to the original data in tw o differen t wa ys, through measures of FID metrics and by visualizing the closest neigh b ors b etw een generated and real images. W e calculate F r ´ ec het Inception Distance (FID) with tw o differen t approaches, with the usual conv olutional features of a Inception-V1 netw ork and with cellular information ex- tracted from the CRImage cell classifier, as explained in Section 3.4. W e restrict using CRImage to breast cancer tissue only since it w as developed for that particular purp ose. T able 1 sho ws that our mo del is able to achiev e an accurate c haracterization of the cancer tissue. Using the Inception feature space, FID sho ws a stable representation for all mo dels with v alues similar to ImageNet mo dels of BigGAN (Brock et al., 2019) and SAGAN (Zhang et al., 2019a), with FIDs of 7.4 and 18.65, resp ectively or StyleGAN (Karras et al., 2019) trained on FFHQ with FID of 4.40. Using the CRImage cellular information as feature space, FID sho ws again close representations to real tissue. Additionally , in Figure 4 w e presen t samples of generated images (first column) and its closest real neigh b ors in Inception-V1 feature space, the images are paired b y rows. (a-h) corresp ond to different random samples of breast cancer tissue. In the case of colorectal cancer, we provide examples of differen t t yp es of tissue: tumor (i), stroma (j), muscle (k), lympho cytes (l), debris (m), mucus (n), adip ose (o), and background (p). W e can see that generated and real images hold the same morphological c haracteristics. 8 P a thologyGAN: Learning deep represent a tions of cancer tissue Mo del Inception FID Inception FID CRImage FID Colorectal Breast Breast P athologyGAN 32.05 ± 3 16.65 ± 2.5 9.86 ± 0.4 T able 1: Ev aluation of PathologyGANs. Mean and standard deviations are computed ov er three different random initializations. The low FID scores in both feature space suggest consisten t and accurate representations. Figure 4: Nearest neighbors in Inception-V1 feature space for breast cancer (a-h) and col- orectal cancer (i-p). F or eac h ro w, first column images corresponds to a generated tissue samples from PathologyGAN, the remaining columns are the closest real images in feature space. 4.2 Analysis of latent represen tations In this section we fo cus on the P athologyGAN’s latent space, exploring the impact of in tro ducing a mapping netw ork in the generator and using style mixing regularization. Here we will pro vide examples of its impact on linear interpolations and vector op erations on the latent space w , as w ell as visualizations on the latent space w . W e conclude that P athologyGAN holds representation learning prop erties ov er cancer tissue morphologies. 9 A.C.Q., R.M.S., & K.Y. Figures 5 and 6 capture ho w the latent space w has a structure that shows direct relationship with tissue prop erties. T o create this figures, we generated 10 K images and lab eled them accordingly to Sections 3.4 and 3.5, along with each tissue image we also hav e the corresp onding latent vector w and we used UMAP (McInnes et al., 2018) to pro ject them to a t wo dimensional space. Figure 5 reveals the relationship b etw een num ber of cancer cells in the breast cancer tissue and regions of the laten t space, low counts of cancer cells (class 0) are concentrated at quadran t I I while they increase as we mov e to quadran t I V (class 7). Figure 6 displa ys ho w the distinct regions of the laten t space generate differen t kinds of tissue. These examples pro vide evidence of a structured latent space according to tissue cellular c haracteristics and tissue type. W e include a further detailed exploration with density and scatter plots in the App endix E. W e also found that linear in terp olations b et ween t wo latent v ectors w hav e b etter feature transformations when the mapping net work and style mixing regularization are introduced. Figure 7 sho ws linear interpolations in latent space w b et ween images with malignan t tissue and b enign tissue. (a, c) corresp ond to a mo del with a mapping net work and st yle mixing regularization and (b, d) to a mo del without those features, we can see that transitions on (a, c) include an increasing p opulation of cancer cells rather than the fading effect observed Figure 5: Latent space of PathologyGAN trained on breast cancer tissue from Netherlands Cancer Institute (NKI) and V ancouver General Hospital (VGH) dataset. Uniform Manifold Approximation and Pro jection (UMAP) representations of generated tissue samples, each generated image is lab eled with the density of cancer cells, class 0 for lo west and class 8 for highest. Mo ving from quadrant I I to quadran t I V in the UMAP represen tation corresp onds to increasing the density of cancer cells in the generated tissue. 10 P a thologyGAN: Learning deep represent a tions of cancer tissue Figure 6: Latent space of PathologyGAN trained on colorectal cancer tissue from National Cen ter for T umor (NCT) dataset. Uniform Manifold Appro ximation and Pro jec- tion (UMAP) represen tations of generated tissue samples, eac h generated image is lab eled with the type of tissue. Different regions of the latent space generate distinct kinds of tissue. in images of (b, d). This result indicates that (a, c) b etter translates interpolations in the laten t space, as real cells do not fade aw a y . In addition, we p erformed linear vector op erations in w , that translated into semantic image features transformations. In Figure 8 we pro vide examples of three vector op erations that result in to feature alterations in the images. This evidence shows further supp ort on the relation b et ween a structured latent space and tissue characteristics. Finally , we explored how linear interpolation and v ector op erations translate into the individual points in the latent space. In Figure 9 w e pro vide examples of in terp olations from stroma to tumor in colorectal cancer, and tumor to lympho cytes in breast cancer. Through the intermediate v ectors we sho w that gradual transitions in the latent space translate in to smo oth feature transformations, in these cases increase/decrease of tumorous cells or increase of lympho cyte coun ts. Alternativ ely , Figure 10 sho ws how results from v ector op erations fall into regions of the laten t space that corresp ond to the exp ected tissue t yp e or a com bination of features suc h as tumor and lympho cytes. With these figures w e visualize the meaningful representations of cells and tissue t yp es, and also the interpretabilit y of the laten t space. Appendix H contains additional examples of these visualizations. 4.3 Pathologists’ results T o demonstrate that the generated images can sustain the scrutiny of clinical examination, w e asked exp ert pathologists to take a test, setup as follows: 11 A.C.Q., R.M.S., & K.Y. Figure 7: Linear interpolation in the latent space w from a b enign (less cancer cells, left end) to a malignant tissue (more cancer cells, right end) on breast cancer (a, b) and colorectal cancer (c, d). (a, c) P athologyGAN mo del interpolations with a mapping net work and st yle mixing regularization. (b, d) PathologyGAN mo del in terp olations without a mapping netw ork and style mixing regularization. (a, c) includes an increasing p opulation of cancer cells rather than a fading effect from mo del (b, d), this shows that mo del (a, c) b etter translates high level features of images from laten t space vectors. • 50 Individual images - Pathologists were asked to rate all individual images from 1 to 5, where 5 mean t the image app eared the most real. W e c hose fake images in t wo wa ys, with half of them hand-selected and the other half with fak e images that had the smallest Euclidean distance to real images in the con volutional feature space (Inception-V1). All the real images are randomly selected b etw een the three closest neigh b ors of the fake images. Figure 11 shows the test results in terms of false p ositive vs true p ositive for breast (a) and colorectal cancer tissue (b). W e can see that pathologist classification is close to random. The pathologists men tioned that the usual pro cedure is to work with larger images with bigger resolution, but that the generated fake images w ere of a quality , that at the 224 × 224 size used in this work, they w ere not able to differentiate b et ween real and fake tissue. 5. Discussion Our goal is to dev elop a generative mo del that is able to capture and create represen tations based tissue architectures and cellular characteristics that define phenot yp e, for this reason 12 P a thologyGAN: Learning deep represent a tions of cancer tissue Figure 8: Linear vector operations on the latent space w translate into image feature trans- formations. W e gather latent vectors that generate images with different high lev el features and p erform linear op erations on the vectors b efore w e feed the generator, resulting into semantic translations of the characteristics of the im- ages. W e p erform the arithmetic op erations (a, b, and c) on breast cancer tissue and (d, e, f, and g) on colorectal cancer tissue. our results are fo cused on testing tw o features of our mo del: Image qualit y of generated tissue and in terpretability of representations/structure of the latent space. Through image quality w e tested the mo del’s ability to learn and repro duce the distri- bution of tissue and cellular information, w e argue that by doing so it would hav e capture phenot yp es. The FID results on T able 1 sho w that PathologyGAN do es repro duce these dis- tributions not only when it is judged b y conv olutional features (32 . 05 / 16 . 65) but also when w e use an external to ol to directly quan tify cellular information in the tissue (9 . 86). W e w ould lik e to highlight that the FID score measures the distribution difference b etw een real and generated samples, and given the low v alues we argue that the mo del is also capturing the abundance or scarcit y of different tissue patterns. Figure 4 shows generated tissue samples and their closest real neigh b ors in the Inception- V1 conv olutional space, allowing us to visually insp ect the similarity b etw een them. In the colorectal cancer samples we can see that the differen t types of tissue (from tumor (i) to bac kground (p)) clearly resemble the real tissue. Breast cancer tissue samples (a-h) also 13 A.C.Q., R.M.S., & K.Y. Figure 9: Uniform Manifold Approximation and Pro jection (UMAP) representations of gen- erated tissue samples where linear in terpolations in the laten t space are high- ligh ted. Colorectal cancer (left) sho ws a transition b et ween stroma and tumor, while Brest cancer (right) sho ws a transition b etw een tumor and lympho cytes. Starting vectors are colored in blue while intermediate points of the interpola- tions are colored in red. Through the intermediate vectors we show that gradual transitions in the latent space translate into smo oth feature transformations, in- crease/decrease of tumorous cells or increase of lympho cyte coun ts. sho w the same result where the real and generated tissue present the same patterns and shap es. As an additional image q uality v erification, w e tested the generated images of our model against pathologists’ interpretation. W e aimed to test that the generated tissues do not con tain any artifacts that give them aw a y as fak e through the ey es of professionals. Giv en the near random classification b etw een real/fake in Figure 11, we conclude that generated samples are realistic enough to pass as real through the examination of pathologists. W e argue this is relev an t b ecause the mo del is able to repro duce tissue patterns to whic h pathologists are accustom to. With the previous results we conclude that the mo del is able to repro duce the detail and distribution of tissue, not only from the con v olutional features or cellular characteristics p ersp ectiv e, but also by the interpretation of pathologists. In relation to PathologyGAN’s laten t space structure and in terpretabilit y of its repre- sen tations, Figures 5 and 6 sho w how distinct regions of the latent space hold tissue and cellular information ab out the generated images. Figure 5 shows a clear relationship b e- t ween regions of the laten t space and the cancer cell density in the tissue, while Figure 6 directly links the region of the space with the differen t tissue types (e.g. tumor, stroma, 14 P a thologyGAN: Learning deep represent a tions of cancer tissue Figure 10: Uniform Manifold Approximation and Pro jection (UMAP) representations of generated tissue samples where v ectors in volv ed in the linear v ector operations are highligh ted. Original vectors are colored in blue while the results are col- ored in red. W e sho w colorectal cancer examples on the left and breast cancer examples on the right. Af ter vector operations the results fall into regions of the latent space that corresp ond to the tissue type (left) or a combination of features, tumor and lympho cytes (righ t). m uscle, lympho cytes, debris, m ucus, adipose, and background). In Figures 7 and 9 w e relate linear interpolations b et ween laten t v ectors and generated tissue attributes, showing that gradual transitions in the laten t space transfer in to smooth feature transformations, in these cases increase/decrease of tumorous cells or increase of lympho cyte counts. Finally , Fig- ures 8 and 10 pro vide examples of linear vector op erations and their translation in to tissue c haracteristic c hanges, with different tissue c hanges. These results pro vide supp ort on the represen tation learning prop erties of the mo del, not only holding meaningful information of cell and tissue t yp es but also an interpretable insight to the representations themselves. As future research, we consider that our mo del could b e used in different settings. P athologyGAN could b e extended to achiev e higher resolutions suc h as 1024 × 1024, a lev el of resolution which could include complete TMAs which hold v alue for diagnosis and prognosis. In these cases, pathologists’ insight will hold a higher v alue, since they are used to working at WSI or TMA level. In addition, the study with pathologists could b e extended to include a larger n umber of exp erts and to use a random sample of generated images whic h would give a less biased result. 15 A.C.Q., R.M.S., & K.Y. Figure 11: ROC curve of P athologists’ real/fake classification for breast (a) and colorectal cancer tissue (b). The near random classification p erformance from b oth exp ert pathologists suggests that generated tissue images do not present artifacts that giv e aw a y the tissue as generated. The represen tation learning prop erties of the mo del can also contribute as a educational to ol, pro viding tissue samples with certain cellular characteristics that are rare, elucidating p ossible transitions of tissue (e.g. from tumor to high lympho cyte infiltration), or enabling the study of b orderline cases (e.g. atypia) b etw een generated images and pathologists in terpretations. F urthermore, the mo del could b e used to generate synthetic samples to improv e clas- sifiers p erformance, helping to a void o verfitting and providing samples with rare tissue pathologies. Finally , we consider the mo del can contribute to c haracterizing phenot yp e patterns, cre- ating represen tations by cellular and tissue morphologies, this is where we think the tissue represen tation learning prop erties are key . Linking these phenot yp es to patient related in- formation such as genomic, transcriptomic information, or surviv al exp ectancy . Ultimately this could giv e insight to the tumor micro environmen t recorded in the WSIs and a b etter understanding of the disease. In order to achiev e this goal, it will require exploring the addition of an enco der to map real images into the GAN’s laten t space (Quiros et al., 2020) and verify its conv erge when large amoun ts of samples are used, since WSIs in datasets like TCGA could amoun t to millions of tissue samples. 6. Conclusion W e presented a new approac h to the use of machine learning in digital pathology , using GANs to learn cancer tissue represen tations. W e assessed the quality of the generated images through the FID metric, using the conv olutional features of a Inception-V1 net work and quantitativ e cellular information of the tissue, b oth sho wed consistent state-of-the-art v alues for differen t kinds of tissue, breast and colorectal cancer. W e sho wed that our mo del allo ws high lev el interpretation of its latent space, e v en p erforming linear op erations that translate in to feature tissue transformations. Finally , w e demonstrate that the quality of 16 P a thologyGAN: Learning deep represent a tions of cancer tissue the generated images do not allow pathologists to reliably find differences b etw een real and generated images. With PathologyGAN we prop osed a generative mo del that captures representations of en tire tissue architectures and defines an interpretable laten t space (e.g. colour, texture, spatial features of cancer and normal cells, and their in teraction), contributing to generativ e mo dels abilit y to capture phenotype representations. Ac kno wledgments W e w ould lik e to thank Joanne Edwards, Christopher Bigley , and Elizabeth Mallon for helpful insigh ts and discussions on this work. W e will also lik e to ackno wledge funding supp ort from Univ ersity of Glasgow on A.C.Q sc holarship, K.Y from EPSRC grant EP/R018634/1., and R.M-S. from EPSRC grants EP/T00097X/1 and EP/R018634/1. Ethical Standards The work follows appropriate ethical standards in conducting research and writing the man uscript. Our mo dels were trained with publicly av ailable data, for which no ethical appro v al w as required. Conflicts of Interest W e declare w e don’t hav e conflicts of in terest. References Shane Barratt and Rishi Sharma. A note on the Inception score. CoRR , abs/1801.01973, 2018. URL . Andrew H Bec k, Ankur R Sangoi, Samuel Leung, Rob ert J Marinelli, T orsten O Nielsen, Marc J v an de Vijver, Rob ert B W est, Matt v an de Rijn, and Daphne Koller. Systematic analysis of breast cancer morphology uncov ers stromal features asso ciated with surviv al. Sci T r ansl Me d , 3(108):108ra113, No v 2011. ISSN 1946-6242 (Electronic); 1946-6234 (Linking). doi: 10.1126/scitranslmed.3002564. Joseph Bergenstr ˚ ahle, Ludvig Larsson, and Joakim Lundeberg. Seamless integration of image and molecular analysis for spatial transcriptomics workflo ws. BMC Genomics , 21(1):482, 2020a. doi: 10.1186/s12864- 020- 06832- 3. URL https://doi.org/10.1186/ s12864- 020- 06832- 3 . Ludvig Bergenstr ˚ ahle, Bry an He, Joseph Bergenstr ˚ ahle, Alma Andersson, Joakim Lunde- b erg, James Zou, and Jonas Maask ola. Sup er-resolved spatial transcriptomics by deep data fusion. bioRxiv , page 2020.02.28.963413, 01 2020b. 17 A.C.Q., R.M.S., & K.Y. Mik o la j Bi ´ nko wski, Dougal J. Sutherland, Mic hael Arb el, and Arthur Gretton. Dem ystifying MMD GANs. In International Confer enc e on L e arning R epr esentations , 2018. URL https://openreview.net/forum?id=r1lUOzWCW . Andrew Bro c k, Jeff Donahue, and Karen Simony an. Large scale GAN training for high fidelit y natural image synthesis. In International Confer enc e on L e arning R epr esentations , 2019. URL https://openreview.net/forum?id=B1xsqj09Fm . P eter J. Campbell, Gad Getz, Jan O. Korbel, and et al. Pan-cancer analysis of whole genomes. Natur e , 578(7793):82–93, 2020. Nicolas Coudray and Aristotelis Tsirigos. Deep learning links histology , molecular sig- natures and prognosis in cancer. Natur e Canc er , 1(8):755–757, 2020. doi: 10.1038/ s43018- 020- 0099- 2. URL https://doi.org/10.1038/s43018- 020- 0099- 2 . Nicolas Coudray , Paolo Santiago Ocamp o, Theo dore Sakellaropoulos, Na vneet Narula, Matija Snuderl, David F eny¨ o, Andre L. Moreira, Narges Razavian, and Aristotelis Tsiri- gos. Classification and m utation prediction from non–small cell lung cancer histopathol- ogy images using deep learning. Natur e Me dicine , 24(10):1559–1567, 2018. doi: 10.1038/s41591- 018- 0177- 5. URL https://doi.org/10.1038/s41591- 018- 0177- 5 . Thomas de Bel, Meyk e Hermsen, Bart Smeets, Luuk Hilbrands, Jeroen v an der Laak, and Geert Litjens. Automatic segmentation of histopathological slides of renal tissue using deep learning. In Me dic al Imaging 2018: Digital Patholo gy , v olume 10581, page 1058112. In ternational So ciety for Optics and Photonics, 2018. J. Deng, W. Dong, R. So c her, L.-J. Li, K. Li, and L. F ei-F ei. ImageNet: A Large-Scale Hierarc hical Image Database. In CVPR09 , 2009. Stefan C. Dentro, Ignaty Leshc hiner, and et al. Characterizing genetic intra-tumor hetero- geneit y across 2,658 h uman cancer genomes. bioRxiv , 2020. doi: 10.1101/312041. URL https://www.biorxiv.org/content/early/2020/04/22/312041 . Maurice F r´ ec het. Sur la distance de deux lois de probabilit ´ e. COMPTES RENDUS HEB- DOMAD AIRES DES SEANCES DE L A CADEMIE DES SCIENCES , 244(6):689–692, 1957. Y u F u, Alexander W. Jung, Ramon Vi ˜ nas T orne, San tiago Gonzalez, Harald V¨ ohringer, Artem Shmatko, Lucy R. Y ates, Mercedes Jimenez-Linan, Luiza Mo ore, and Moritz Ger- stung. P an-cancer computational histopathology reveals m utations, tumor comp osition and prognosis. Natur e Canc er , 1(8):800–810, 2020. doi: 10.1038/s43018- 020- 0085- 8. URL https://doi.org/10.1038/s43018- 020- 0085- 8 . Mic hael Gadermayr, Laxmi Gupta, Barbara M Klinkhammer, P eter Bo or, and Dorit Mer- hof. Unsup ervisedly training gans for segmen ting digital pathology with automatically generated annotations. arXiv pr eprint arXiv:1805.10059 , 2018. 18 P a thologyGAN: Learning deep represent a tions of cancer tissue Mic hael Gaderma yr, Laxmi Gupta, Vitus App el, Peter Bo or, Barbara M Klinkhammer, and Dorit Merhof. Generative adv ersarial net works for facilitating stain-indep enden t su- p ervised and unsupervised segmentation: a study on kidney histology . IEEE tr ansactions on me dic al imaging , 38(10):2293–2302, 2019. Moritz Gerstung, Clemency Jolly , and et al. The evolutionary history of 2,658 cancers. Natur e , 578(7793):122–128, 2020. Ian Goo dfellow, Jean Pouget-Abadie, Mehdi Mirza, Bing Xu, David W arde-F arley , Sherjil Ozair, Aaron Courville, and Y osh ua Be ngio. Generativ e adversarial nets. In Z. Ghahra- mani, M. W elling, C. Cortes, N. D. La wrence, and K. Q. W ein b erger, editors, A dvanc es in Neur al Information Pr o c essing Systems 27 , pages 2672–2680. Curran Asso ciates, Inc., 2014. URL http://papers.nips.cc/paper/5423- generative- adversarial- nets. pdf . Arth ur Gretton, Karsten M. Borgw ardt, Malte J. Rasch, Bernhard Sch¨ olkopf, and Alexan- der Smola. A kernel t wo-sample test. Journal of Machine L e arning R ese ar ch , 13(25): 723–773, 2012. URL http://jmlr.org/papers/v13/gretton12a.html . Bry an He, Ludvig Bergenstr ˚ ahle, Linnea Stenbeck, Abubak ar Abid, Alma Andersson, ˚ Ak e Borg, Jonas Maaskola, Joakim Lundeb erg, and James Zou. In tegrating spatial gene expression and breast tumour morphology via deep learning. Natur e Biome d- ic al Engine ering , 4(8):827–834, 2020. doi: 10.1038/s41551- 020- 0578- x. URL https: //doi.org/10.1038/s41551- 020- 0578- x . Kaiming He, Xiangyu Zhang, Shao qing Ren, and Jian Sun. Deep residual learning for image recognition. 2016 IEEE Confer enc e on Computer Vision and Pattern R e c o gnition (CVPR) , Jun 2016. doi: 10.1109/cvpr.2016.90. URL http://dx.doi.org/10.1109/ cvpr.2016.90 . Martin Heusel, Hub ert Ramsauer, Thomas Un terthiner, Bernhard Nessler, and Sepp Ho c hreiter. Gans trained b y a t wo time-scale update rule con verge to a lo cal nash equi- librium. In I. Guy on, U. V. Luxburg, S. Bengio, H. W allach, R. F ergus, S. Vishw anathan, and R. Garnett, editors, A dvanc es in Neur al Information Pr o c essing Systems 30 , pages 6626–6637. Curran Asso ciates, Inc., 2017. Le Hou, V u Nguy en, Ariel B Kanevsky , Dimitris Samaras, T ahsin M Kurc, Tianhao Zhao, Ra jarsi R Gupta, Yi Gao, W enjin Chen, David F oran, and Jo el H Saltz. Sparse au- to enco der for unsup ervised nucleus detection and representation in histopathology im- ages. Pattern r e c o gnition , 86:188–200, 02 2019. doi: 10.1016/j.patcog.2018.09.007. URL https://pubmed.ncbi.nlm.nih.gov/30631215 . Bo Hu, Y e T ang, Eric I-Chao Chang, Y ubo F an, Mao de Lai, and Y an Xu. Unsup er- vised learning for cell-level visual represen tation in histopathology images with gener- ativ e adv ersarial net works. IEEE Journal of Biome dic al and He alth Informatics , 23 (3):1316–1328, Ma y 2019. ISSN 2168-2208. doi: 10.1109/jbhi.2018.2852639. URL http://dx.doi.org/10.1109/JBHI.2018.2852639 . 19 A.C.Q., R.M.S., & K.Y. Gao Huang, Y ang Y uan, Qiantong Xu, Ch uan Guo, Y u Sun, F elix W u, and Kilian W ein- b erger. An empirical study on ev aluation metrics of generativ e adv ersarial net works, 2018. URL https://openreview.net/forum?id=Sy1f0e- R- . Alexia Jolicoeur-Martineau. The relativistic discriminator: a key elemen t missing from standard GAN. In International Confer enc e on L e arning R epr esentations , 2019. URL https://openreview.net/forum?id=S1erHoR5t7 . T ero Karras, Sam uli Laine, and Timo Aila. A style-based generator arc hitecture for generativ e adv ersarial netw orks. 2019 IEEE/CVF Confer enc e on Computer Vision and Pattern R e c o gnition (CVPR) , Jun 2019. doi: 10.1109/cvpr.2019.00453. URL http://dx.doi.org/10.1109/CVPR.2019.00453 . Jak ob Nik olas Kather, Niels Halama, and Alexander Marx. 100,000 histological images of human colorectal cancer and healthy tissue, April 2018. URL https://doi.org/10. 5281/zenodo.1214456 . Jak ob Nikolas Kather, Lara R. Heij, Heik e I. Grabsc h, and et al. P an-cancer image-based de- tection of clinically actionable genetic alterations. Natur e Canc er , 1(8):789–799, 2020. doi: 10.1038/s43018- 020- 0087- 6. URL https://doi.org/10.1038/s43018- 020- 0087- 6 . Jared L. Katzman, Uri Shaham, Alexander Cloninger, Jonathan Bates, Tingting Jiang, and Y uv al Kluger. Deepsurv: p ersonalized treatmen t recommender system using a cox prop ortional hazards deep neural net work. BMC Me dic al R ese ar ch Metho dolo gy , 18(1), F eb 2018. ISSN 1471-2288. doi: 10.1186/s12874- 018- 0482- 1. URL http://dx.doi.org/ 10.1186/s12874- 018- 0482- 1 . Diederik P Kingma and Jimm y Ba. Adam: A metho d for sto c hastic optimization. arXiv pr eprint arXiv:1412.6980 , 2014. C. Lee, W. Zame, Jinsung Y o on, and M. V. D. Sc haar. Deephit: A deep learning approach to surviv al analysis with comp eting risks. In AAAI , 2018. Adrian B Levine, Jason P eng, Da vid F arnell, Mitchell Nursey , and et al. Syn thesis of di- agnostic quality cancer pathology images b y generative adv ersarial netw orks. The Jour- nal of Patholo gy , 252(2):178–188, 2020. doi: https://doi.org/10.1002/path.5509. URL https://onlinelibrary.wiley.com/doi/abs/10.1002/path.5509 . Jae Hyun Lim and Jong Ch ul Y e. Geometric GAN, 2017. Da vid Lop ez-Paz and Maxime Oquab. Revisiting classifier tw o-sample tests, 2016. F aisal Mahmo o d, Daniel Borders, Richard Chen, Gregory McKa y , Kev an J Salimian, Alexander Baras, and Nicholas Durr. Deep adversarial training for multi-organ nuclei segmen tation in histopathology images, 09 2018. Rob ert J. Marinelli, Kelli Mon tgomery , Chih Long Liu, Nigam Shah, Wijan Prap ong, Mic hael Nitzb erg, Zac hariah K Zac hariah, Gavin Sherlo ck, Y aso dha Natkunam, Rob ert 20 P a thologyGAN: Learning deep represent a tions of cancer tissue B W est, Matt v an de Rijn, Patric k O Brown, and Catherine A Ball. The stan- ford tissue microarray database. Nucleic acids r ese ar ch , 36:D871–7, 02 2008. doi: 10.1093/nar/gkm861. Leland McInnes, John Healy , Nathaniel Saul, and Luk as Großberger. UMAP: Uniform Manifold Appro ximation and Pro jection. Journal of Op en Sour c e Softwar e , 3(29), 2018. T ak eru Miy ato, T oshiki Kataok a, Masanori Koy ama, and Y uichi Y oshida. Sp ectral nor- malization for generativ e adversarial netw orks. In International Confer enc e on L e arning R epr esentations , 2018. URL https://openreview.net/forum?id=B1QRgziT- . T alha Qaiser, Y ee-W ah Tsang, Daiki T aniyama, Naoy a Sak amoto, Kazuaki Nak ane, David Epstein, and Nasir Ra jp o ot. F ast and accurate tumor segmentation of histology images using p ersisten t homology and deep conv olutional features. Me dic al image analysis , 55: 1–14, 2019. Hui Qu, Gregory Riedlinger, Pengxiang W u, Qiaoying Huang, Jingru Yi, Subha jyoti De, and Dimitris Metaxas. Joint segmen tation and fine-grained classification of n uclei in histopathology images. In 2019 IEEE 16th International Symp osium on Biome dic al Imag- ing (ISBI 2019) , pages 900–904. IEEE, 2019. Adalb erto Claudio Quiros, Ro derick Murra y-Smith, and Ke Y uCoudan. Learning a lo w dimensional manifold of real cancer tissue with pathologygan, 2020. Alec Radford, Luke Metz, and Soumith Chin tala. Unsup ervised represen tation learning with deep con volutional generative adversarial netw orks, 2015. Aman Rana, Gregory Y auney , Alarice Lo we, and Pratik Shah. Computational histological staining and destaining of prostate core biopsy RGB images with Generative Adversarial Neural Net w orks. 2018 17th IEEE International Confer enc e on Machine L e arning and Applic ations (ICMLA) , Dec 2018. doi: 10.1109/icmla.2018.00133. URL http://dx.doi. org/10.1109/ICMLA.2018.00133 . Tim Salimans, Ian Go o dfello w, W o jciec h Zaremba, Vic ki Cheung, Alec Radford, Xi Chen, and Xi Chen. Impro ved techniques for training gans. In D. D. Lee, M. Sugiyama, U. V. Luxburg, I. Guyon, and R. Garnett, editors, A dvanc es in Neur al Information Pr o c essing Systems 29 , pages 2234–2242. Curran Asso ciates, Inc., 2016. URL http: //papers.nips.cc/paper/6125- improved- techniques- for- training- gans.pdf . Beno ˆ ıt Sc hmauc h, Alb erto Romagnoni, Elo die Pronier, Charlie Saillard, Pascale Maill´ e, Julien Calderaro, Aur´ elie Kamoun, Meriem Sefta, Sylv ain T oldo, Mikhail Zaslavskiy , Thomas Clozel, Matahi Moarii, Pierre Courtiol, and Gilles W ainrib. A deep learn- ing mo del to predict rna-seq expression of tumours from whole slide images. Natur e Communic ations , 11(1):3877, 2020. doi: 10.1038/s41467- 020- 17678- 4. URL https: //doi.org/10.1038/s41467- 020- 17678- 4 . C. Szegedy, V. V anhouck e, S. Ioffe, J. Shlens, and Z. W o jna. Rethinking the inception arc hitecture for computer vision. In 2016 IEEE Confer enc e on Computer Vision and Pattern R e c o gnition (CVPR) , pages 2818–2826, 2016. doi: 10.1109/CVPR.2016.308. 21 A.C.Q., R.M.S., & K.Y. Da vid T ellez, Maschenk a Balkenhol, Irene Otte-H¨ oller, Rob v an de Lo o, Rob V ogels, P eter Bult, Carla W auters, Willem V reuls, Suzanne Mol, Nico Karssemeijer, et al. Whole- slide mitosis detection in h&e breast histology using phh3 as a reference to train distilled stain-in v arian t con volutional netw orks. IEEE tr ansactions on me dic al imaging , 37(9): 2126–2136, 2018. Sanja Vic ko vic, G¨ okcen Eraslan, F redrik Salm´ en, and et al. High-definition spatial tran- scriptomics for in situ tissue profiling. Natur e Metho ds , 16(10):987–990, 2019. Y uliang W ang, Sh uyi Ma, and W alter L. Ruzzo. Spatial modeling of prostate can- cer metab olic gene expression rev eals extensive heterogeneit y and selective vulnerabil- ities. Scientific R ep orts , 10(1):3490, 2020. doi: 10.1038/s41598- 020- 60384- w . URL https://doi.org/10.1038/s41598- 020- 60384- w . Jason W. W ei, Laura J. T afe, Y evgeniy A. Linnik, Louis J. V aickus, Naofumi T omita, and Saeed Hassanp our. Pathologist-lev el classification of histologic patterns on resected lung adeno carcinoma slides with deep neural netw orks. Scientific R ep orts , 9(1):3358, 2019. doi: 10.1038/s41598- 019- 40041- 7. URL https://doi.org/10.1038/s41598- 019- 40041- 7 . Ann-Christin W o erl, Markus Eckstein, Josephine Geiger, Daniel C. W agner, T amas Daher, Philipp Stenzel, Aur´ elie F ernandez, Arndt Hartmann, Michael W and, Wilfried Roth, and Sebastian F o ersch. Deep learning predicts molecular subtype of muscle-in v asiv e bladder cancer from con ven tional histopathological slides. Eur op e an Ur olo gy , 78(2):256 – 264, 2020. ISSN 0302-2838. doi: h ttps://doi.org/10.1016/j.eururo.2020.04.023. URL http: //www.sciencedirect.com/science/article/pii/S0302283820302554 . Bolei Xu, Jingxin Liu, Xianxu Hou, Bozhi Liu, Jon Garibaldi, Ian O Ellis, Andy Green, Linlin Shen, and Guoping Qiu. Lo ok, in vestigate, and classify: A deep h ybrid atten tion metho d for breast cancer classification. In 2019 IEEE 16th international symp osium on biome dic al imaging (ISBI 2019) , pages 914–918. IEEE, 2019a. Jun Xu, Lei Xiang, Qingshan Liu, Hannah Gilmore, Jianzhong W u, Jinghai T ang, and Anan t Madabh ushi. Stac ked sparse auto enco der (ssae) for n uclei detection on breast cancer histopathology images. IEEE tr ansactions on me dic al imaging , 35(1):119–130, 01 2016. doi: 10.1109/TMI.2015.2458702. URL https://pubmed.ncbi.nlm.nih.gov/ 26208307 . Qian tong Xu, Gao Huang, Y ang Y uan, Ch uan Guo, Y u Sun, F elix W u, and Kilian Q. W ein b erger. An empirical study on ev aluation metrics of generativ e adv ersarial net works. CoRR , abs/1806.07755, 2018. URL . Zhao yang Xu, Carlos F ern´ andez Moro, B´ ela Boz´ oky , and Qianni Zhang. GAN-based Virtual Re-Staining: A promising solution for whole slide image analysis, 2019b. Yin yin Y uan, Henrik F ailmezger, Oscar M Rueda, H Raza Ali, Stefan Gr¨ af, Suet-F eung Chin, Roland F Sc hw arz, Christina Curtis, Mark J Dunning, Helen Bardwell, Nicola Johnson, Sarah Doyle, Gulisa T urashvili, Elena Prov enzano, Sam Aparicio, Carlos Caldas, and Florian Marko w etz. Quan titative image analysis of cellular heterogeneit y in breast 22 P a thologyGAN: Learning deep represent a tions of cancer tissue tumors complemen ts genomic profiling. Sci T r ansl Me d , 4(157):157ra143, Oct 2012. ISSN 1946-6242 (Electronic); 1946-6234 (Linking). doi: 10.1126/scitranslmed.3004330. F. G. Zanjani, S. Zinger, B. E. Bejnordi, J. A. W. M. v an der Laak, and P . H. N. de With. Stain normalization of histopathology images using generativ e adv ersarial netw orks. In 2018 IEEE 15th International Symp osium on Biome dic al Imaging (ISBI 2018) , pages 573–577, 2018. Han Zhang, Ian Go o dfello w, Dimitris Metaxas, and Augustus Odena. Self-atten tion gen- erativ e adv ersarial netw orks. In International Confer enc e on Machine L e arning , pages 7354–7363. PMLR, 2019a. Zizhao Zhang, Pingjun Chen, Mason McGough, F uyong Xing, Ch unbao W ang, Marilyn Bui, Y uanpu Xie, Manish Sapk ota, Lei Cui, Jasreman Dhillon, et al. Pathologist-lev el in- terpretable whole-slide cancer diagnosis with deep learning. Natur e Machine Intel ligenc e , 1(5):236–245, 2019b. 23 A.C.Q., R.M.S., & K.Y. App endix A. Co de W e pro vide the co de at this location: https://github.com/AdalbertoCq/Pathology- GAN App endix B. Dataset size impact on represen tations. T o further understand P athologyGAN’s b eha vior with different dataset sizes and its abilit y to generalize, we sub-sample the NCT and created differen t dataset sizes of 5 K , 10 K , and 20 K images. W e measure the abilit y to generalize and hold meaningful representations in tw o w ays: b y measuring the FID against the complete dataset of 100 K and b y exploring the laten t space, in order to c heck its structure. Figure 12 sho ws that PathologyGAN’s laten t space shows a structure regarding tissue t yp es even for 5 K samples, although it is not able to reliably generalize the original dataset distribution. T able 2 shows how 20 K samples are enough to achiev e a reasonable FID with 41 . 92. Figure 12: Latent space of PathologyGAN trained on colorectal cancer tissue from National Cen ter for T umor (NCT) dataset with 5 K samples. Uniform Manifold Approx- imation and Pro jection (UMAP) representations of generated tissue samples, eac h generated image is lab eled with the t yp e of tissue. Even with 5 K samples, P athologyGAN holds an structured laten t sap ce where different regions of the laten t space generate distinct kinds of tissue. 24 P a thologyGAN: Learning deep represent a tions of cancer tissue NCT Datase Size FID 5K 83.52 10K 56.03 20K 41.92 Complete 100K 32.05 T able 2: Ev aluation of P athologyGANs for different dataset sizes. App endix C. Hinge vs Relativistic Av erage Discriminator In this section we show corresp onding generated images and loss function plots for Rela- tivistic Av erage Discriminator mo del and Hinge Loss mo del. Figure 13: Left grid images corresp ond to Relativistic Average Discriminator mo del vs right grid images from the Hinge loss mo del. W e can see that the Relativistic Av erage mo del is able to repro duce cancer tissue characteristics compared to Hinge loss, whic h do es not. Figure 14: (a) Generator and Discriminator loss functions of the Relativistic Av erage Dis- criminator mo del, (b) Generator and Discriminator loss functions from the Hinge loss mo del. Here we capture the corresp onding loss functions to the images in Figure 13, b oth of them conv erge but only Relativistic Av erage Discriminator pro duces meaningful images. 25 A.C.Q., R.M.S., & K.Y. App endix D. Nearest Neigh b ors Additional Samples Figure 15: Nearest neigh b ors in Inception-V1 feature space for breast cancer (a-h) and colorectal cancer (i-p). F or each row, first column images corresp onds to a generated tissue samples from PathologyGAN, the remaining columns are the closest real images in feature space. App endix E. Mapping Net work and St yle Mixing Regularization Comparison T o measure the impact of in tro ducing a mapping netw ork and using style mixing regular- ization during training, we pro vide different figures of the latent space w for tw o P athology- GANs, one using these features and another one without them. W e include b oth datasets, breast and colorectal cancer tissue. Figures 16, 17, 18, and 19 capture the clear difference in the laten t space ordering with resp ect to the counts of cancer cells and types of tissue in the image. Without a mapping net work and style mixing regularization the laten t space w sho ws a random placement of the vectors sub ject to the tissue characteristics, when these tw o elements are introduced differen t regions of the latent space pro duce images with distinct characteristics. 26 P a thologyGAN: Learning deep represent a tions of cancer tissue Figure 16: Breast cancer tissue: Comparison of the latent space w for tw o different Pathol- ogyGAN models, (a-h) include a mapping net w ork and style mixing regular- ization, and (i-p) do not include them. Eac h sub-figure shows datap oin ts only related to one of the classes, and each class is sub ject to the count of cancer cells in the tissue image, (a) and (i) [class 0] are asso ciated to images with the lo west num b er of cancer cells, (h) and (p) [class 8] with the largest. In the model (a-h) images with increasing n umber of cancer cells corresp ond to prop ortionally mo ving to quadran t I V in the 2 dimensional space , where (i-p) are randomly placed. This figure sho ws how including the mapping netw ork and style mixing regularization in tro duces representation learning prop erties. 27 A.C.Q., R.M.S., & K.Y. Figure 17: Breast cancer tissue: Comparison of the latent space w for tw o different Pathol- ogyGAN models, (a-h) include a mapping net w ork and style mixing regular- ization, and (i-p) do not include them. Eac h sub-figure shows the densit y of datap oin ts only related to one of the classes, and eac h class is sub ject to the coun t of cancer cells in the tissue image, (a) and (i) [class 0] are asso ciated to im- ages with the low est n umber of cancer cells, (h) and (p) [class] with the largest. In the mo del (a-h) images with increasing num b er of cancer cells corresp ond to prop ortionally moving to quadrant I V in the 2 dimensional space , where (i-p) are randomly placed. This figure shows ho w including the mapping net work and st yle mixing regularization introduces representation learning prop erties. 28 P a thologyGAN: Learning deep represent a tions of cancer tissue Figure 18: Colorectal cancer tissue: Comparison of the laten t space w for t wo different P athologyGAN mo dels, (a-h) include a mapping net w ork and st yle mixing reg- ularization, and (i-p) do not include them. Each sub-figure shows datap oin ts only related to to one type of tissue. In the mo del (a-h) distinct regions of the laten t space corresp ond to different tissue types, while in mo del (i-p) they are randomly placed. This figure shows how including the mapping netw ork and st yle mixing regularization introduces representation learning prop erties. 29 A.C.Q., R.M.S., & K.Y. Figure 19: Colorectal cancer tissue: Comparison of the laten t space w for t wo different P athologyGAN mo dels, (a-h) include a mapping net w ork and st yle mixing reg- ularization, and (i-p) do not include them. Eac h sub-figure shows the density of datap oin ts only related to one type of tissue. In the mo del (a-h) distinct regions of the latent space correspond to different tissue t yp es, while in mo del (i-p) they are randomly placed. This figure shows ho w including the mapping net work and st yle mixing regularization introduces representation learning prop erties. 30 P a thologyGAN: Learning deep represent a tions of cancer tissue App endix F. V ector Op eration Samples Figure 20: Breast cancer: samples of vector op erations with different images, all op erations corresp ond to: Benign tissue and lympho cytes- b enign tissue + tumorous tissue = cancer cells and lympho cytes. Figure 21: Breast cancer: samples of vector op erations with different images, all op erations corresp ond to: Benign tissue with patc hes of cancer cells - tumorous = b enign tissue. 31 A.C.Q., R.M.S., & K.Y. Figure 22: Breast cancer: samples of vector op erations with different images, all opera- tions correspond to: T umorous tissue with lymphocytes - b enign tissue with lympho cytes + b enign tissue = tumorous or necrotic tissue. 32 P a thologyGAN: Learning deep represent a tions of cancer tissue Figure 23: Colorectal cancer: samples of vector op erations with differen t images, all op er- ations corresp ond to: T umor tissue - T umor tissue + Stroma tissue = Stroma Tissue. 33 A.C.Q., R.M.S., & K.Y. Figure 24: Colorectal cancer: samples of vector op erations with differen t images, all op era- tions correspond to: Stroma tissue + Lymphocytes = Stroma and Lympho cytes. Figure 25: Colorectal cancer: samples of vector op erations with differen t images, all op er- ations correspond to: Adip ose tissue + Lymphocytes = Adip ose and Lympho- cytes. 34 P a thologyGAN: Learning deep represent a tions of cancer tissue Figure 26: Colorectal cancer: samples of vector op erations with differen t images, all op er- ations corresp ond to: Adip ose tissue + T umor tissue = Adip ose and T umor. App endix G. P athologyGAN at 448x448 W e include in this section exp erimental results of a 448 × 448 image resolution mo del. W e trained this mo del for 90 ep o chs ov er appro ximately fiv e da ys, using four NVIDIA Titan R TX 24 GB. Ov er one model the results of Inception FID and CRImage FID w ere 29 . 53 and 203 resp ectiv ely . W e found that CRImage FID is highly sensitive to changes in the images since it lo oks for morphological shap es of cancer cells, lympho cytes, and stroma in the tissue, at this resolution the generated tissue images don’t hold the same high qualit y as in the 224 × 224 case. As we capture in the Conclusion section, this is an opp ortunity to impro ve the detail in the generated image at high resolutions. Figure 27 sho w three examples of comparisons b etw een (a) P athologyGAN images and (b) real images. Additionally , the represen tation learning properties are still preserv ed in the laten t space. Figure 28 captures the density of cancer cells in the 448 × 448 tissue images as previously presen ted for the 224 × 224 case in App endix C. 35 A.C.Q., R.M.S., & K.Y. Figure 27: (a): Images (448 × 448) from P athologyGAN trained on H&E breast cancer tissue. (b): Real images. 36 P a thologyGAN: Learning deep represent a tions of cancer tissue Figure 28: Scatter and density plots of 448 × 448 samples on the UMAP reduced represen- tation of the laten t space w . Each subfigure (a-h) belongs to samples of only one class, where eac h class represents a range of counts of cancer cells in the tissue image. (a) accoun ts for images with the low est n umber of cancer cells and (h) corresp onds to images with the largest count, subfigures from (a) to (h) b elong to increasing num b er of cancer cells. As previously shown in Figure 16 and 17 for the 224 × 224 resolution, representation learning prop erties are still held at 448 × 448. 37 A.C.Q., R.M.S., & K.Y. App endix H. Visualization of linear in terp olations and v ector op erations in the latent space. Figure 29: Uniform Manifold Approximation and Pro jection (UMAP) representations of generated tissue samples where linear in terp olations in the laten t space are high- ligh ted. W e presen t colorectal cancer transition from stroma to tumor, stroma to lympho cytes, and tumor to lympho cytes. Starting vectors are colored as blue while intermediate p oints of the in terp olations are colored as red. Through the in termediate vectors we sho w that gradual transitions in the laten t space trans- late into smo oth feature transformations, increase/decrease of tumorous cells or increase of lympho cyte coun ts. 38 P a thologyGAN: Learning deep represent a tions of cancer tissue Figure 30: Uniform Manifold Approximation and Pro jection (UMAP) representations of generated tissue samples where linear in terp olations in the laten t space are high- ligh ted. W e presen t breast cancer transition from stroma to tumor, stroma to lympho cytes, and tumor to lympho cytes. Starting v ectors are colored as blue while intermediate p oints of the in terp olations are colored as red. Through the in termediate vectors we sho w that gradual transitions in the laten t space trans- late into smo oth feature transformations, increase/decrease of tumorous cells or increase of lympho cyte coun ts. 39 A.C.Q., R.M.S., & K.Y. Figure 31: Uniform Manifold Approximation and Pro jection (UMAP) representations of generated tissue samples where v ectors in volv ed in the linear v ector operations are highligh ted. Original vectors are colored in blue while the results are colored in red. W e show colorectal cancer examples where after vector op erations the results fall in to regions of the latent space that corresp ond to the tissue type. 40 P a thologyGAN: Learning deep represent a tions of cancer tissue Figure 32: Uniform Manifold Approximation and Pro jection (UMAP) representations of generated tissue samples where v ectors in volv ed in the linear v ector operations are highligh ted. Original vectors are colored in blue while the results are colored in red. W e sho w breast cancer examples where after v ector op erations the results com bination of different features such as tumor, b enign tissue, or lympho cytes. 41 A.C.Q., R.M.S., & K.Y. App endix I. GAN ev aluation metrics for digital pathology In this section, w e inv estigate ho w relev an t GAN ev aluation metrics p erform on distinguish- ing differences in cancer tissue distributions. W e cen ter our attention on metrics that are mo del agnostic and work with a set of generated images. W e fo cus on F r ´ ec het Inception distance (FID), Kernel Inception Distance (KID), and 1-Nearest Neighbor classifier (1-NN) as common metrics to ev aluate GANs. W e do not include Inception Score and Mo de Score b ecause they do not compare to real data directly , they require a classification netw ork on surviv al times and estrogen-receptor (ER), and they hav e also show ed low er p erformance when ev aluating GANs (Barratt and Sharma, 2018; Xu et al., 2018). Xu et al. (2018) rep orted that the choice of feature space is critical for ev aluation metrics, so w e follo w these results by using the ’po ol 3’ la yer from an ImageNet trained Inception-V1 as a con volutional feature space. W e set up t wo exp eriments to test how the ev aluation metrics capture: • Artificial contamination from differen t staining markers and cancer types. • Consistency when tw o sample distributions of the same database are compared. I.1 Detecting c hanges in markers and cancer tissue features W e used multiple cancer types and mark ers to accoun t for alterations of color and shap es in the tissue. Markers highligh t parts of the tissue with differen t colors, and cancer types ha ve distinct tissues structures. Examples of these changes are display ed in Figure 33. W e constructed one reference image set with 5000 H&E breast cancer images from our data sets of NKI and VGH, and compared it against another set of 5000 H&E breast cancer images con taminated with other markers and cancer types. W e used three types of marker-cancer combinations for contamination, all from the Stanford TMA Database (Marinelli et al., 2008): H&E - Bladder cancer, Cathepsin-L - Breast cancer, and CD137 - Lymph/Colon/Liv er cancer. Figure 33: Different cancer types and mark ers. (a) H&E Breast cancer, (b) H&E Bladder cancer, (c) Capthepsin-L Breast cancer, and (d) CD137 Bone marrow cancer. W e can see differen t coloring p er marker, and tissue architecture p er cancer type. Eac h set of images was constructed by randomly sampling from the resp ective marker- cancer type data set, which is done to minimize the ov erlap b etw een the clean and contam- inated sets. Figure 34 sho ws ho w (a) FID, (b) KID, (c) 1-NN behav e when the reference H&E breast cancer set is measured against multiple p ercentage of con taminated H&E breast cancer sets. Mark er t yp es hav e a large impact due to color change and all metrics capture this except for 42 P a thologyGAN: Learning deep represent a tions of cancer tissue 1-NN. Cathepsin-L highligh ts parts of the tissue with brown colors and CD137 has similar color to necrotic tissue on H&E breast cancer, but still far from the c haracteristic pink color of H&E. Accordingly , H&E-Bladder has a b etter score in all metrics due to the color stain, again exp ect for 1-NN. Cancer tissue type differences are captured b y all the metrics, which sho ws a marker predominance, but w e can see that on the H&E marker the differences b et ween breast and bladder types are still captured. In this exp eriment, we find that FID and KID hav e a gradual resp onse distinguishing b et ween markers and cancer tissue types, how ev er 1-NN is not able to give a measure that clearly defines these c hanges. Figure 34: Distinguishing a set H&E Breast cancer images against different con tamination of markers and cancer t yp es. F or a metric to b e optimnal, the v alue should decreas along with the contamination. (a) corresponds to FID, (b) KID, (c) 1-NN. FID and KID gradually define c hanges in marker and tissue type, 1-NN do es not pro vide a clear measure of the changes. I.2 Reliability on ev aluation metrics Another ev aluation we p erformed was to study which metrics are consistent when tw o indep enden t sample distributions with the same con tamination percentage are compared. T o construct this test, for each contamination p ercentage, we create t w o indep endent sample sets of 5000 images and compare them against each other. Again, w e constructed these image sets by randomly selecting images for each of the marker-cancer databases. W e do this to ensure there are no o verlapping images b etw een the distributions. In Figure 35 we sho w that (a) FID has a stable p erformance, compared to (b) KID, and esp ecially (c) 1-NN. The metrics should show a close to zero distance for each of the con tamination rates since w e are comparing tw o sample-distributions from the same data set. This shows that only FID has a close to zero constan t b ehavior across differen t data sets when comparing the same tissue image distributions. Based on these t wo exp erimen ts, we argue that 1-NN do es not clearly represent c hanges in the cancer t yp es and mark er, and both KID and 1-NN do not give a constant reliable measure across different mark ers and cancer types. Therefore we fo cused on FID as the most promising ev aluation metrics. 43 A.C.Q., R.M.S., & K.Y. Figure 35: Consistency of metrics when tw o indep endent sets of images with the same con tamination are compared. Consistent metrics should b e close to zero for eac h of the contamination rates. (a) FID, (b) KID, and (c) 1-NN, w e can see that FID is the metric that sho ws a close to zero constant measure. App endix J. P athologists T ests W e pro vide in here examples of the tests taken by the pathologists: Figure 36: Individual images for breast cancer tissue. Figure 37: Individual images for colorectal cancer tissue. 44 P a thologyGAN: Learning deep represent a tions of cancer tissue App endix K. Mo del Architecture Generator Net work G : w → x Dense La yer, adaptive instance normalization (AdaIN), and leakyReLU 200 → 1024 Dense La yer, AdaIN, and leakyReLU 1024 → 12544 Reshap e 7 × 7 × 256 ResNet Con v2D Lay er, 3x3, stride 1, pad same, AdaIN, and leakyReLU 0 . 2 7 × 7 × 256 → 7 × 7 × 256 Con vT ransp ose2D Lay er, 2x2, stride 2, pad upscale, AdaIN, and leakyReLU 0 . 2 7 × 7 × 256 → 14 × 14 × 512 ResNet Con v2D Lay er, 3x3, stride 1, pad same, AdaIN, and leakyReLU 0 . 2 14 × 14 × 512 → 14 × 14 × 512 Con vT ransp ose2D Lay er, 2x2, stride 2, pad upscale, AdaIN, and leakyReLU 0 . 2 14 × 14 × 512 → 28 × 28 × 256 ResNet Con v2D Lay er, 3x3, stride 1, pad same, AdaIN, and leakyReLU 0 . 2 28 × 28 × 256 → 28 × 28 × 256 A ttention Lay er at 28 × 28 × 256 Con vT ransp ose2D Lay er, 2x2, stride 2, pad upscale, AdaIN, and leakyReLU 0 . 2 28 × 28 × 256 → 56 × 56 × 128 ResNet Con v2D Lay er, 3x3, stride 1, pad same, AdaIN, and leakyReLU 0 . 2 56 × 56 × 128 → 56 × 56 × 128 Con vT ransp ose2D Lay er, 2x2, stride 2, pad upscale, AdaIN, and leakyReLU 0 . 2 56 × 56 × 128 → 112 × 112 × 64 ResNet Con v2D Lay er, 3x3, stride 1, pad same, AdaIN, and leakyReLU 0 . 2 112 × 112 × 64 → 112 × 112 × 64 Con vT ransp ose2D Lay er, 2x2, stride 2, pad upscale, AdaIN, and leakyReLU 0 . 2 112 × 112 × 64 → 224 × 224 × 32 Con v2D Lay er, 3x3, stride 1, pad same, 32 → 3 224 × 224 × 32 → 224 × 224 × 3 Sigmoid T able 3: Generator Netw ork Architecture details of P athologyGAN mo del. 45 A.C.Q., R.M.S., & K.Y. Discriminator Net work C : x → d x ∈ R 224 × 224 × 3 ResNet Con v2D Lay er, 3x3, stride 1, pad same, and leakyReLU 0 . 2 224 × 224 × 3 → 224 × 224 × 3 Con v2D Lay er, 2x2, stride 2, pad do wnscale, and leakyReLU 0 . 2 224 × 224 × 3 → 122 × 122 × 32 ResNet Con v2D Lay er, 3x3, stride 1, pad same, and leakyReLU 0 . 2 122 × 122 × 32 → 122 × 122 × 32 Con v2D Lay er, 2x2, stride 2, pad do wnscale, and leakyReLU 0 . 2 122 × 122 × 32 → 56 × 56 × 64 ResNet Con v2D Lay er, 3x3, stride 1, pad same, and leakyReLU 0 . 2 56 × 56 × 64 → 56 × 56 × 64 Con v2D Lay er, 2x2, stride 2, pad do wnscale, and leakyReLU 0 . 2 56 × 56 × 64 → 28 × 28 × 128 ResNet Con v2D Lay er, 3x3, stride 1, pad same, and leakyReLU 0 . 2 28 × 28 × 128 → 28 × 28 × 128 A ttention Lay er at 28 × 28 × 128 Con v2D Lay er, 2x2, stride 2, pad do wnscale, and leakyReLU 0 . 2 28 × 28 × 128 → 14 × 14 × 256 ResNet Con v2D Lay er, 3x3, stride 1, pad same, and leakyReLU 0 . 2 14 × 14 × 256 → 14 × 14 × 256 Con v2D Lay er, 2x2, stride 2, pad do wnscale, and leakyReLU 0 . 2 14 × 14 × 256 → 7 × 7 × 512 Flatten 7 × 7 × 512 → 25088 Dense La yer and leakyReLU, 25088 → 1024 Dense La yer and leakyReLU, 1024 → 1 T able 4: Discriminator Netw ork Architecture details of P athologyGAN mo del. 46 P a thologyGAN: Learning deep represent a tions of cancer tissue Mapping Net work M : z → w z ∈∼ R 200 ∼ N (0 , I ) ResNet Dense La yer and ReLU, 200 → 200 ResNet Dense La yer and ReLU, 200 → 200 ResNet Dense La yer and ReLU, 200 → 200 ResNet Dense La yer and ReLU, 200 → 200 Dense La yer, 200 → 200 T able 5: Mapping Netw ork Architecture details of P athologyGAN mo del. 47
Original Paper
Loading high-quality paper...
Comments & Academic Discussion
Loading comments...
Leave a Comment