Simple connectome inference from partial correlation statistics in calcium imaging
In this work, we propose a simple yet effective solution to the problem of connectome inference in calcium imaging data. The proposed algorithm consists of two steps. First, processing the raw signals to detect neural peak activities. Second, inferring the degree of association between neurons from partial correlation statistics. This paper summarises the methodology that led us to win the Connectomics Challenge, proposes a simplified version of our method, and finally compares our results with respect to other inference methods.
💡 Research Summary
This paper presents a straightforward yet powerful pipeline for inferring neuronal connectivity from calcium‑imaging recordings. The authors split the problem into two distinct stages. In the first stage, raw fluorescence traces are cleaned and transformed so that only the sharp, high‑amplitude spikes—interpreted as neuronal firing events—remain. The cleaning consists of (i) a low‑pass smoothing filter (either a simple three‑point moving average f₁ or a weighted version f₂) to suppress high‑frequency noise, (ii) a backward difference operator g to highlight rapid upward changes, (iii) a hard‑threshold h that discards values below a user‑defined τ, and (iv) a global regularization w that down‑weights spikes occurring during periods of high overall network activity while up‑weighting those occurring in quieter periods. The composition w ∘ h ∘ g ∘ f (with f being f₁ or f₂) yields a denoised, spike‑only signal ready for statistical analysis.
In the second stage, the processed signals are modeled as samples from a multivariate Gaussian distribution X ∼ N(μ, Σ). The authors compute the precision matrix Σ⁻¹ and derive the partial correlation coefficient for each unordered pair (i, j) as p_{i,j}=−Σ⁻¹_{ij}/√(Σ⁻¹_{ii} Σ⁻¹_{jj}). Under the Gaussian assumption, p_{i,j}=0 if and only if X_i and X_j are conditionally independent given all other variables, meaning that indirect pathways are filtered out. Because partial correlation is symmetric, the method does not infer edge direction, but the Connectomics Challenge scoring (AUC‑ROC and AUC‑PR) does not penalize this lack of orientation.
The authors note that the number of time points (T≈179 500) far exceeds the number of neurons (p=1 000), allowing a direct inversion of Σ without regularization. Nevertheless, they also explore a dimensionality‑reduction variant that keeps only the top M≈0.8 p principal components before inversion, which reduces computational load while preserving performance. Sensitivity analyses reveal that the choice of low‑pass filter, the threshold τ, and the regularization function w strongly affect the final partial‑correlation scores. To mitigate this dependence, they average the partial‑correlation matrices obtained from multiple parameter settings, a strategy they call “Averaged Partial Correlation”.
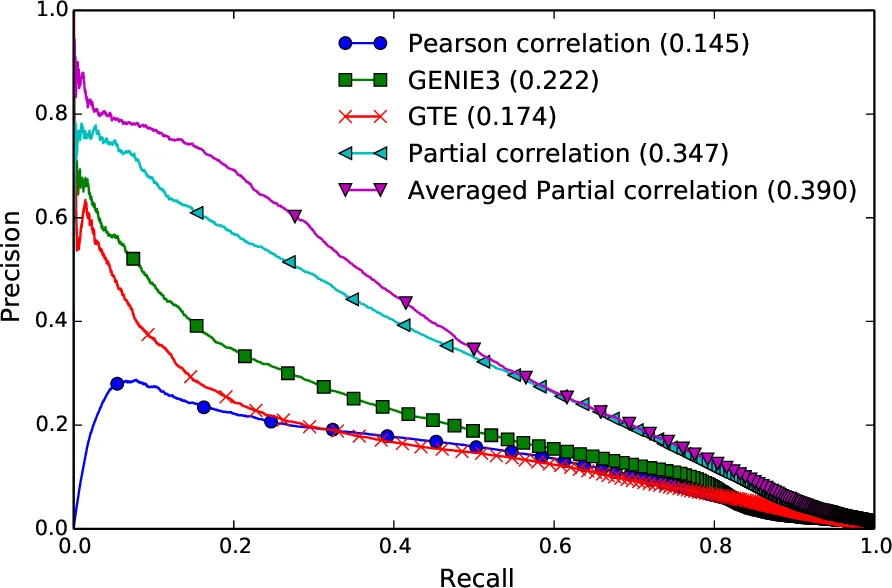
Experimental validation uses the four synthetic datasets (normal‑1 to normal‑4) from the Connectomics Challenge. Each dataset simulates a network of 1 000 neurons with roughly 15 000 directed synapses (≈1.5 % density) and provides fluorescence traces of length 179 500. For each method, all unordered neuron pairs receive a similarity score, and the authors compute ROC and precision‑recall curves against the ground‑truth adjacency matrix, reporting the area under each curve (AUR OC and AUPR C).
Results demonstrate the critical role of preprocessing. Without any filtering, partial correlation yields AUR OC≈0.77 and AUPR C≈0.07. Adding the h ∘ g ∘ f₁ pipeline raises AUR OC to ≈0.92 and AUPR C to ≈0.31. Incorporating the global regularizer w further improves to AUR OC≈0.93 and AUPR C≈0.33. Using PCA‑based approximation does not change AUR OC but modestly increases AUPR C to ≈0.35. Averaging over multiple parameter configurations pushes the scores to AUR OC≈0.94 and AUPR C≈0.40, outperforming three strong baselines: Pearson correlation (PC), Generalized Transfer Entropy (GTE), and GENIE3. The baselines achieve AUR OC in the range 0.88–0.89 and AUPR C between 0.14 and 0.22, indicating that the proposed method captures direct functional links far more reliably, especially in low‑density networks where precision‑recall is the more informative metric.
The authors conclude that a minimal pipeline—signal denoising followed by partial‑correlation analysis—provides a highly competitive, easy‑to‑implement baseline for connectome inference from calcium imaging. Its simplicity, modest computational requirements, and robustness after parameter averaging make it suitable for a wide range of datasets, including future real‑world recordings where ground‑truth connectivity is unknown. The work also suggests that more sophisticated models (e.g., incorporating temporal causality or non‑Gaussian dynamics) could be built on top of this foundation, but even in its basic form the method already achieves state‑of‑the‑art performance on the benchmark challenge.
Comments & Academic Discussion
Loading comments...
Leave a Comment