Explaining dimensionality reduction results using Shapley values
Dimensionality reduction (DR) techniques have been consistently supporting high-dimensional data analysis in various applications. Besides the patterns uncovered by these techniques, the interpretation of DR results based on each feature’s contribution to the low-dimensional representation supports new finds through exploratory analysis. Current literature approaches designed to interpret DR techniques do not explain the features’ contributions well since they focus only on the low-dimensional representation or do not consider the relationship among features. This paper presents ClusterShapley to address these problems, using Shapley values to generate explanations of dimensionality reduction techniques and interpret these algorithms using a cluster-oriented analysis. ClusterShapley explains the formation of clusters and the meaning of their relationship, which is useful for exploratory data analysis in various domains. We propose novel visualization techniques to guide the interpretation of features’ contributions on clustering formation and validate our methodology through case studies of publicly available datasets. The results demonstrate our approach’s interpretability and analysis power to generate insights about pathologies and patients in different conditions using DR results.
💡 Research Summary
The paper introduces ClusterShapley, a novel framework that leverages Shapley values to explain the results of dimensionality reduction (DR) techniques from a cluster‑oriented perspective. While DR methods such as t‑SNE, UMAP, and PCA are widely used to visualize high‑dimensional data in two dimensions, existing interpretability approaches either focus solely on the low‑dimensional scatter plot or ignore interactions among features, making it difficult to understand how individual variables contribute to the formation of visible clusters.
Methodology
ClusterShapley consists of two main stages.
- Dataset Annotation – The high‑dimensional dataset is first projected into a 2‑D space using a chosen DR algorithm. Analysts then define clusters either manually (e.g., by lasso‑selecting groups in the scatter plot) or automatically with a clustering algorithm. These 2‑D clusters are mapped back to the original feature space, producing a probability of belonging to each cluster for every data point.
- Shapley Estimation – The cluster‑membership probabilities serve as the target variable for a Shapley‑value analysis. Because exact Shapley computation requires evaluating all 2ⁿ feature subsets, the authors adopt KernelSHAP, a sampling‑based approximation that fits a linear regression on randomly permuted feature subsets to estimate each feature’s average marginal contribution.
Visualization
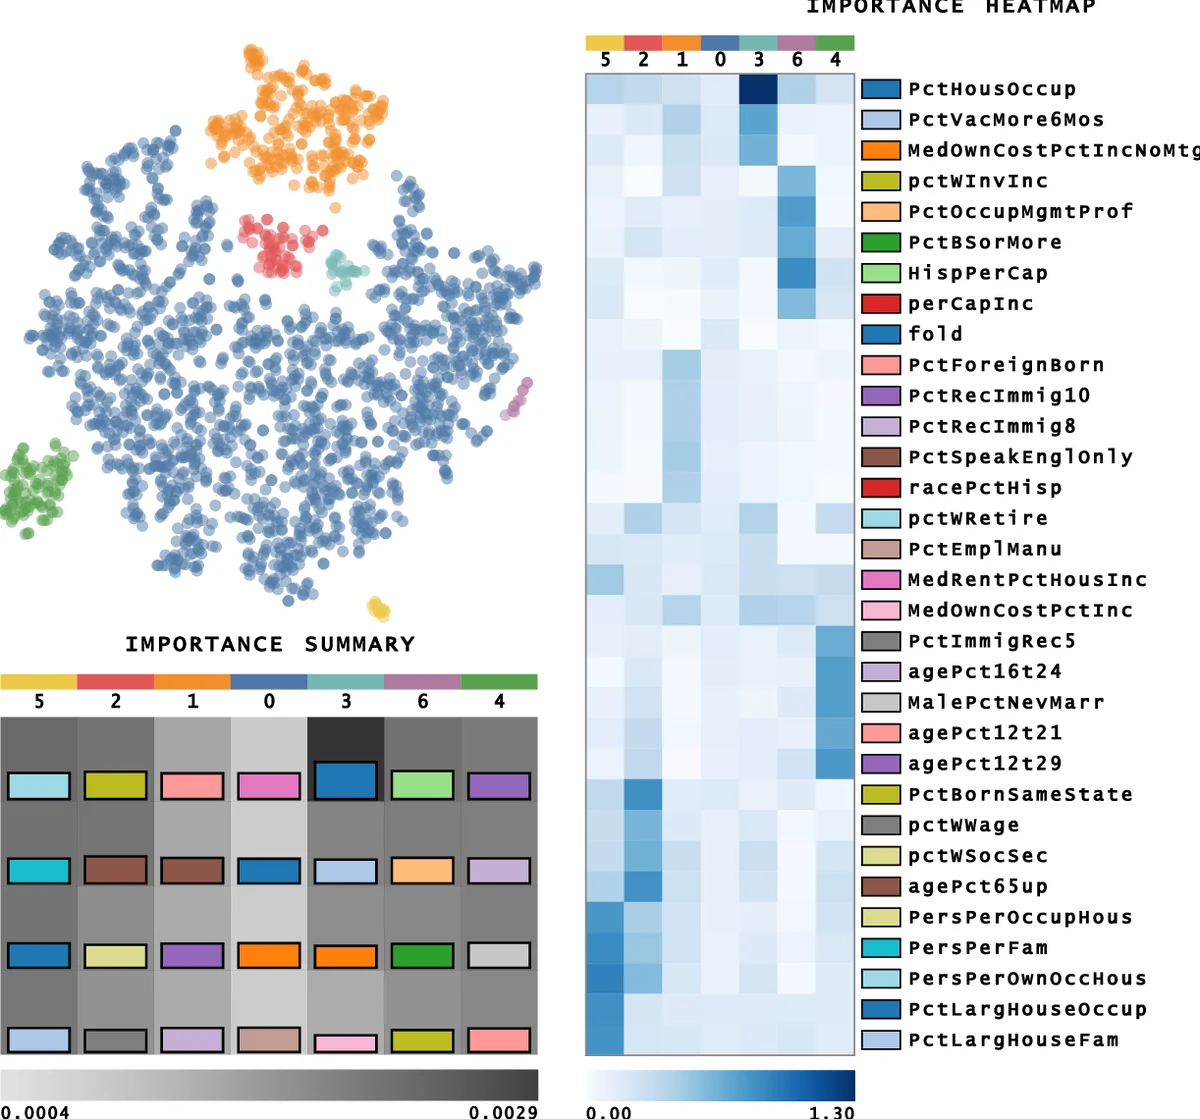
To make the resulting Shapley contributions interpretable, the authors propose two visual metaphors:
- Shapley Heatmap – Rows correspond to clusters, columns to features, and cell colors encode the magnitude (and sign) of the Shapley value. Positive values indicate a feature pushes a point toward the cluster, while negative values indicate the opposite.
- Density‑Based Feature Grouping – Using kernel density estimation, highly correlated features are aggregated into groups, reducing visual clutter and highlighting collective effects.
Case Studies
The framework is validated on two publicly available datasets:
- Single‑cell RNA‑seq data – After DR, clusters correspond to distinct cell types. The Shapley heatmap identifies a small set of genes with high positive contributions for each cell‑type cluster, matching known biological markers.
- Medical records (cardiovascular patients) – Clusters align with disease stages. Features such as systolic blood pressure, cholesterol, and age receive the highest Shapley values for the most severe cluster, offering clinicians interpretable cues for risk stratification.
Contributions
- First application of Shapley values to explain DR outcomes in a cluster‑centric manner, capturing feature interactions that traditional importance scores miss.
- Novel visualizations that translate quantitative Shapley contributions into intuitive graphics for exploratory analysis.
- Demonstrated utility on real‑world biomedical data, revealing domain‑relevant insights (gene markers, clinical risk factors).
Limitations & Future Work
The approximation quality of KernelSHAP depends on the number of sampled permutations; insufficient sampling can introduce variance. Moreover, cluster definitions rely on analyst input, which may be subjective. Future research should explore automated, data‑driven clustering pipelines, adaptive sampling strategies to stabilize Shapley estimates, and broader evaluation across diverse DR algorithms and large‑scale datasets.
In summary, ClusterShapley provides a principled, model‑agnostic way to dissect how individual and interacting features shape the low‑dimensional structures produced by DR techniques, thereby enhancing interpretability and supporting hypothesis generation in fields such as genomics and healthcare.
Comments & Academic Discussion
Loading comments...
Leave a Comment