Respondent-driven sampling bias induced by clustering and community structure in social networks
Sampling hidden populations is particularly challenging using standard sampling methods mainly because of the lack of a sampling frame. Respondent-driven sampling (RDS) is an alternative methodology that exploits the social contacts between peers to …
Authors: Luis Enrique Correa Rocha, Anna Ekeus Thorson, Renaud Lambiotte
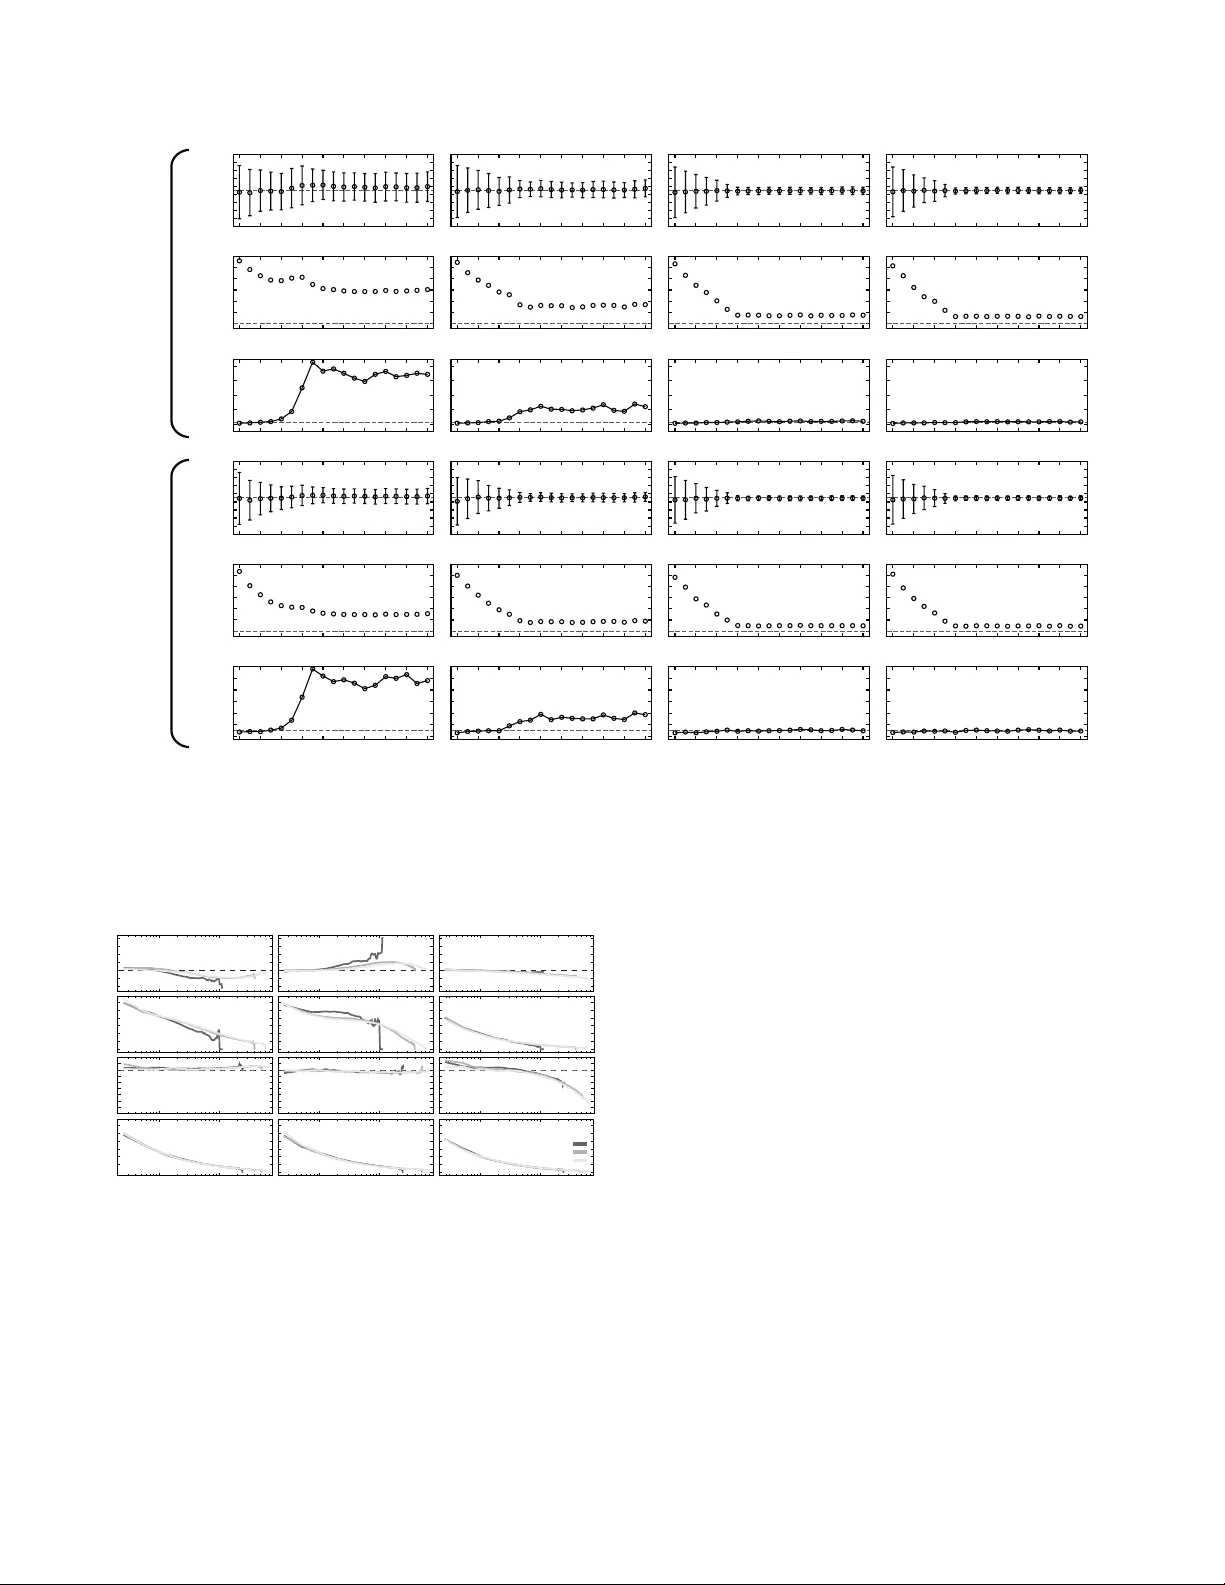
Resp ondent-driven sampling bias induced b y clustering and communit y structure in so cial net w o rks Luis E C Ro cha ∗ Depa rtment of Public Health Sciences, Ka rolinska Institutet, Stockholm, Sw eden Depa rtment of Mathematics and naXys, Universit´ e de Namur, Namur, Belgium Anna E. Tho rson Depa rtment of Public Health Sciences, Karolinsk a Institutet, Stockholm, Sw eden Renaud Lambiotte Depa rtment of Mathematics and naXys, Universit´ e de Namur, Namur, Belgium F redrik Liljeros Depa rtment of So ciology , Sto ckholm Universit y , Stockholm, Sweden (Dated: Ma rch 20, 2015) Sampling hidden populations is particularly challenging using standard sampling metho ds mainly because of the lack of a sampling frame. Respondent-driven sampling (RDS) is an alternative methodology tha t exploits the so cial contacts b et ween peers to reach and weigh t individuals in these hard-to-reac h populations. It is a snowball sampling procedure where the weigh t of the respondents is adjusted for the likelihoo d of b eing sampled due to differences in the num b er of contacts. In RDS, the structure of the so cial con tacts thus defines the sampling pro cess and affects its cov erage, for instance by constraining the sampling within a sub-region of the netw ork. In this pap er we study the bias induced by net work structures such as social triangles, communit y structure, and heterogeneities in the num ber of contacts, in the recruitment trees and in the RDS estimator. W e simulate different scenarios of netw ork structures and resp onse-rates to study the potential biases one ma y expect in real settings. W e find that the prevalence of the estimated v ariable is asso ciated with the size of the netw ork community to whic h the individual belongs. F urthermore, we observe that low-degree no des may be under-sampled in certain situations if the sample and the netw ork are of similar size. Finally , we also sho w that low response-rates lead to reasonably accurate av erage estimates of the prevalence but generate relatively large biases. I. Introduction In order to estimate the prev alence of diseases, traits or b eha viors in particular so cial groups or ev en in the en tire so ciet y , researchers typically rely on samples of the target p opulation. A carefully selected sample may generate satis- factory low standard errors with a b on us of optimizing re- searc h resources and time. A common challenge is to obtain a significan t and un biased sample of the target p opulation. This is particularly difficult if this p opulation of interest is someho w segregated, stigmatized, or in some other wa y dif- ficult to reac h suc h that a sampling frame cannot be w ell de- fined. These so-called hidden (or hard-to-reac h) populations ma y b e for example man-who-hav e-sex-with-man (MSM), sex-w orkers, injecting drug users, criminals, homeless, or mi- norit y groups 1 . In 1997, Hec k athorn in tro duced a new methodology to sample hidden p opulations named resp onden t-driv en sam- pling (RDS) 2 . RDS exploits the underlying so cial netw ork structure in order to reach the target p opulation through the participan ts’ o wn p eers. The metho d consists in a v ariation of the snowball sampling where the statistical estimators ha ve weigh ts to comp ensate the non-random nature of the recruiting pro cess, i.e. that individuals with man y p oten tial recruiters hav e a higher chance to b e sampled. In RDS, re- ∗ Electronic address: luis.ro c ha@ki.se searc hers select seeds to start the recruitment. A seed p erson then invites a num b er of other individuals to participate in the survey by passing a coup on to them. Those successfully recruited resp ond a surv ey and get new coupons to invite a num b er of other individuals within their own so cial net- w ork, and the pro cess is rep eated until enough participants are recruited. Successful recruitment and participation in the surv ey are b oth financially comp ensated. A fundamen- tal assumption is that eac h participant kno ws the n umber of his or her own acquaintances in the target p opulation, or in the netw ork jargon, his or her own degree. This information is used as weigh ts to estimate the prev alence of the v ariable of in terest in the study p opulation. The p erhaps most p opular RDS statistical estimator is due to V olz and Hec k athorn, who devised a Marko v pro cess whose equilibrium distribution is the same as the distribu- tion of the target p opulation 3 . This estimator is derived after a series of assumptions regarding b oth the underlying net work structure and the recruitment pro cess p er se . Al- though the assumptions are generally reasonable, sometimes they are relativ ely strict for realistic settings, as for example, the uniformly random selection of p eers, p ersisten t success- ful recruitment, and sampling with replacemen t 4 . These and other assumptions hav e b een scrutinized in previous theo- retical studies and the estimator has p erformed satisfactory in different scenarios using b oth synthetic 5–7 and real net- w orks 8,9 . A num b er of real life studies hav e also concluded 2 NO CLUSTERING COMMUNITY STRUCTURE TRIANGLES a) b) c) Figure 1: Netw orks with and without structure. The panel shows a schematic netw ork a) completely random, i.e. without triangles and community structure, b) with 5 triangles and without community structure, and c) with 4 net wo rk communities and 1 triangle (in the bottom-right communit y). that RDS is an effective sampling metho d for v arious cate- gories of hidden p opulations (See for example Refs. 5,10–13 ). So cial netw orks are how ever highly heterogeneous in the sense that the structure of connections cannot b e represen ted b y characteristic v alues. This is the case of the num b er of con tacts p er individual or of the level of clustering b et ween them 14,15 . Since the RDS dynamics is constrained by the net work structure, one may expect that different patterns of connectivit y affect the recruitment c hains. F or example, the net work structure ma y be suc h that a recruitment tree gro ws only in one part of the net work 16–18 . In realistic settings using sampling without replacement, even if all individuals are willing to participate, trees may simply die out b ecause a netw ork has been locally exhausted and bridging no des blo c k further propagation of coup ons to other parts of the net work 19 . Such situation is not unlikely in highly clustered sub-p opulations where coup ons ma y simply mo ve around the same group of p eople. Previous theoretical studies ha ve addressed some of these netw ork constrains b y studying the RDS p erformance on either synthetic structures 6,7 or sam- ples of real net works 8,9 . Each approach to mo del so cial net- w orks has its own adv antages and limitations. On one hand, simple synthetic structures and sampling pro cesses are un- realistic but allows some mathematical treatability and th us in tuitive understanding. On the other hand, samples of real net works may suffer biases themselves due to their o wn sam- pling and th us p oten tial incompleteness of data 20,21 . Net work clustering is particularly imp ortan t in the con- text of so cial netw orks and should b e carefully assessed. It ma y ha v e differen t meanings but here w e asso ciate clustering to so cial triangles, i.e. the fact that common contacts of a p erson are also in con tact themselv es. Netw ork comm unities are also a form of clustering in which groups of individuals are more connected b etw een themselves than with individ- uals in other groups. As already mentioned, clustering in all its forms is not uniform across a netw ork. In practice, it means that one may find hidden sub-p opulations within the study p opulation. Examples include so cial groups with particular features (e.g. wealth, foreigners, ethnic minori- ties) embedded in the target p opulation 19 , transsexuals in p opulations of MSM, or geographically sparse p opulations 17 . While these sub-p opulations may p oten tially b e remov ed by defining a more strict sampling frame, so cial groups (or com- m unities) are inheren t of so cial and other human contact net works 15,22 . Note that net work clustering is not the same as homophily , that is the tendency of similar individuals to asso ciate, but one ma y enhance the other. F or exam- ple, individuals may share so cial contacts b ecause they live geographically close, share workplaces, or are structured in organizations (potentially leading to net work clustering) but ma y b e completely different in other asp ects (lo w homophily in w ealth, health status, gender, infection status, and so on). In this pap er, we use computational algorithms to gener- ate synthetic netw orks with v arious levels of clustering and with netw ork communities of v arious sizes, aiming to re- pro duce structures observed in real so cial net works. Using realistic parameters, w e simulate a RDS process using these net works and quan tify the p erformance of the RDS estima- tor in differen t scenarios of the prev alence of an arbitrary v ariable of in terest. The paper is organized suc h that w e first analyze how triangles and communit y structure affect ho w the RDS spread in the netw ork when it comes to size of transmission trees and generation of recruitment. Then we in vestigate how clustering affects the v alidity and reliability of the RDSII estimator as a function of different willingness to participate (resp onse-rates) in the p opulation. W e also test the effect of clustering for scenarios where the v ariable under study is correlated with the degree of the no des and the size of the netw ork communit y . Thereafter, we study the consequences of the biased selection of seeds, the bias induced by net work structure in samples of real so cial net- w orks, and the effect of restarting the seeds during the sam- pling exp erimen t. I I. Materials and Metho ds W e describ e in this section the mo dels used to generate the syn thetic netw orks with different num b er of triangles and v arying levels of communit y structure, the empirical net- w orks, the mo del to simulate the RDS dynamics, the pro- to cols to artificially distribute the infections in the target p opulation, and the estimator and other statistics used for the analysis. A. Study netw orks A so cial net work is defined b y a set of nodes representing the p opulation and a set of links represen ting the so cial con- tacts, as for example acquain tances or friendship, b et ween t wo individuals. The net work structure can be c haracter- 3 ized by different netw ork quantities 14,22 . The most funda- men tal quantit y is the degree k that represents the num b er of links of a no de or equiv alently the num b er of contacts of an individual. The assortativit y of a netw ork measures the tendency of no des with similar degree to b e connected. The n umber of triangles and the clustering coefficient are used to measure the lo cal clustering in the netw ork. A triangle corresp onds to the situation where tw o contacts of a no de are also in contact themselves, and the clustering co efficient is a normalized count of the num b er of triangles. A netw ork comm unity , on the other hand, is a group of no des that are more connected b etw een themselves than with no des of other groups. A fundamental prop erty of the net work communit y structure is that only a few no des link (or bridge) differen t comm unities, these no des are also known as bottlenecks b e- cause they constrain the diffusion, or the sampling pro cess, in the net work. If there are only a few bridging no des, one sa ys that the communit y structure is strong, whereas many bridging no des w eaken the comm unity structure reducing the b ottlenec ks b et ween groups. 1. Synthetic Netw orks W e use computational algorithms able to generate syn- thetic netw orks with tunable num b er of triangles (Fig. 1b) or of comm unity structure (Fig. 1c). These algorithms are not exp ected to repro duce a particular so cial netw ork but to generate v arious structures observ ed in social netw orks more realistically than previously studied structures 6 . Our reference random net work is obtained b y simply connecting pairs of no des for a given degree sequence, a procedure that results on a negligible n umber of triangles and no net work comm unity structure (Fig. 1a). This mo del is also know as the configuration mo del 14 . The first algorithm, due to Serrano and Bogu˜ na 24 , gen- erates net works with a v arying num b er of triangles and as- sortativit y . In this algorithm, an a priori degree sequence is chosen following a given distribution P ( k ) of no de degree k . W e choose a p o w er-law degree distribution with a small exp onen tial cutoff, i.e. P ( k ) ∝ k − 2 . 5 exp( − 0 . 0001 k ). If no or very small costs are asso ciated with keeping links alive, scale-free distributions are reasonable mo dels for empirical distribution, otherwise w e usually observe broad scale distri- butions not necessarily p o wer-la w-lik e. Generally sp eaking, this degree distribution is thus not exp ected to b e the most appropriate distribution of contacts in real p opulations but it captures the righ t-skew ed degree heterogeneity typically observ ed in social groups 8,14,15 . This heterogeneity means that the ma jorit y of no des has only a few contacts whereas a small num b er of them has sev eral con tacts. W e fix the minim um p ossible degree to x min = 3 in order to obtain an a verage degree h k i ∼ 7. F urthermore, an a priori clustering co efficien t is chosen such that a given num b er of triangles is defined for each degree class k . The algorithm evolv es b y randomly selecting three different no des and forming a triangle b et ween them, resp ecting the distribution of trian- gles p er degree class. As so on as no new triangles can b e formed, the remaining links are uniformly connected (i.e. the configuration mo del) such that no links are left unconnected. Self-links are forbidden. A parameter β con trols the as sor- tativit y (assortativity increases with decreasing β ) and the parameters c 0 and α control the exp ected clustering co effi- cien t (clustering increases with increasing c 0 and decreases with increasing α ). In this pap er, we use c 0 = 0 . 5, α = 0 . 3 and β = 1 . 0 (for the configuration with many triangles) and c 0 = 0 . 5, α = 1 . 0 and β = 1 . 0 (for the configuration with few triangles). The second algorithm, dev eloped b y Lancichinetti and F ortunato 25 , is used to create net works with communit y structure. Here one starts by choosing the distribution of degrees and the distribution of comm unity sizes. In both cases, we use p o wer-la w distributions to capture the hetero- geneit y in the degree and in the communit y size as observed in some real so cial netw orks 14,15 . Other choices of proba- bilit y distribution may b e more suitable for sp ecific p opu- lations but here again we wan t to study the heterogeneity in the communit y sizes. The degree distribution has the same parameters as used in the first algorithm, the p o wer- la w distribution of communit y sizes has exp onen t − 1 and comm unity sizes are limited b etw een 10 and 1000 no des. These v alues are chosen to guaran tee that a sufficient n um- b er of communities are large in size and at the same time, enough small-sized comm unities are represen ted. F or exam- ple, higher v alues of the exp onen t would result in relativ ely more small-sized comm unities. These v alues are also con- strained by the num b er of links and the level of o verlapping of comm unities (see below), and are c hosen to generate a net work with a single connected comp onent. The num b er of o verlapping no des and the num b er of communities that eac h no de b elongs to are inputs of the algorithm. Ov erlap- ping means that a num b er of no des b elong to more than one communit y (these are the bridging no des) while the rest of the no des only b elong to single communities. One may further select a mixing parameter µ to add random links b et w een the bridge nodes and randomly chosen communi- ties (to weak en the comm unity structure). Therefore, small o verlapping and small mixing generate stronger communit y structures. W e set µ = 0, and select 100 or 1000 ov erlapping no des in 5 communities resp ectiv ely for strong and strong- mo derate communit y structures. F or mo derate-weak and w eak comm unity structures, w e set respectively µ = 0 . 3, and 100 and 1000 ov erlapping no des (in 5 communities as w ell). F or each algorithm, to obtain the statistics, w e generate 10 versions of the netw ork with the same set of parameters and with 10000 nodes each, which is also the size of the target or study p opulation. 2. Empirical Netw orks W e also study RDS using real-life netw orks. W e p er- form simulations on 5 samples of empirical con tact net- w orks represen ting different forms of h uman social rela- tions. Three data sets corresp ond to email communication, t wo b etw een mem b ers of tw o distinct universities in Europ e (EMA1 28 , EMA2 29 ) and one b et w een employ ees of a com- pan y (ENR) 30 . In thes e datasets, no des corresp ond to p eo- ple and so cial ties are formed b etw een those who hav e sent or received at least one email during a giv en time in ter- v al. One data set corresponds to friendship ties b et ween 4 US high-sc ho ol students (ADH) 31 . The last data set cor- resp onds to online communication b et w een mem b ers of an online dating site (POK) 32 . Similarly to the email net works, if tw o mem b ers hav e exc hanged a message through the on- line communit y , a link is made b et ween the respective no des. Although some of these data sets do not corresp ond to so- cial netw orks in which RDS would take place, they serve as realistic settings capturing the netw ork structure of ac- tual social relations. W e ha ve selected data sets with div erse sample sizes and netw ork structure in order to cov er v arious con texts and configurations (T able 1). EMA1 ADH EMA2 POK ENR N 1,133 2,539 3,186 28,295 36,692 E 5,451 10,455 31,856 115,335 183,831 cc 0.22 0.15 0.26 0.05 0.50 C 57 200 71 2,615 2,441 C S 2 1 1 1 1 C L 151 222 1,205 2,621 1,481 T able 1: Summary statistics of the empirical netw orks used in this study . Numb er of nodes ( N ); number of links ( E ); clustering co effi- cient cc ; number of communities C ; size of the smallest community C S and size of the largest communit y C L , according to the MapEquation algorithm 34 . B. RDS mo del W e sim ulate the sampling by using a sto c hastic process re- pro ducing sev eral features of a realistic RDS dynamics. Our mo del further adds a contin uous-time framework and the resp onse-rate can b e controlled. W e use similar parameters as t ypically used in the literature 8,23 . W e start by uniformly selecting (unless otherwise stated) 10 random no des as seeds for the recruitment. After a time t , sampled from an exp onen tial distribution, each seed c ho oses uniformly three of its contacts and pass one coup on to each of them. The exp onen tial distribution is c hosen b ecause in our mo del we assume that the recruitment follo ws a Poisson pro cess. W e select the av erage waiting time to b e 5, mean- ing that a no de w aits on a verage 5 time steps (e.g. 5 days) b efore inviting its contacts. Therefore, after waiting t time steps, and with probabilit y p , that represents the probabilit y of participation (or resp onse-rate, i.e. one minus the prob- abilit y of not returning a coup on), each of these contacts recruits three of their o wn contacts that hav e not partic- ipated y et (sampling without replacement). If a node ac- cepts to invite its own contacts (i.e. accepts to participate), w e add this no de in the sample. The pro cess contin ues un- til all p ossibilities of new recruitments are exhausted or, at maxim um, when a sp ecific sample size is reached. Note that this contin uous-time m odel is equiv alent to a discrete-time mo del in which randomly chosen no des up date their status sequen tially . W e assume that if a node refuses to participate once, it b ecomes av ailable for recruitment b y other no des as if it was nev er invited. W e rep eat the simulation of the RDS dynamics 50 times for each synthetic net work and 500 times for eac h empirical netw ork. C. Prevalence of the study va riable In RDS studies, one is in terested in quan tifying the prev a- lence of some v ariable A in the target p opulation. This v ari- able may represent, for instance, b eing tested p ositive for a giv en disease, b eing male or female, the ethnicit y , or ha ving a particular physical trait. In this paper, to simplify the notation, we sa y that an individual and its resp ectiv e no de is infected with A or not infected with A . W e use different proto cols to infect a fraction of 25% of the netw ork no des with the quan tit y A . The remaining no des are thus assumed to b e non-infected. The reference case (RI) corresp onds to uniformly selecting the no des within the target p opulation, i.e. the infection A is uniformly distributed in the net work. The preferential case (PI) corresp onds to selecting no des in decreasing order of degree, i.e. w e start at no des with the highest degree and infect them with A un til 25% of the no des b ecome infected. T o add some noise (case PRI), we select 20% of the infected nodes, cure them, and redistribute these infections uniformly in the netw ork such that the total n umber of infected no des remains fixed. The other tw o cases consist on infecting no des according to the communit y structure. In the first case (SI), we ini- tially infect no des in the smallest communities until 25% of the no des b ecome infected. In the second case (BI), we in- fect nodes in the largest comm unities until the same fraction of 25% of no des get infected. T o reduce homophily , we add noise by selecting 40% of the infected no des, curing them, and redistributing these infections uniformly in the netw ork while k eeping the total num ber of infected no des fixed (these configurations are named SRI for small and BRI for large comm unities). D. Statistics T o analyze the recruitment trees, we measure the total n umber of participan ts Ω (i.e. the sample-size), and the size S i and the num b er of generations (or w av es) W i of eac h recruitmen t tree, starting from a seed no de i . The prop ortion of individuals in the p opulation with a certain feature A ( ˆ P A ) is estimated by using the RDSI I es- timator 3 : ˆ P A = P i ∈ A ∩ N k − 1 i P i ∈ N k − 1 i (1) where k i is the rep orted degree of an individual i in the so cial netw ork. W e thus define: θ = m X j =1 ˆ P j A m (2) as the av erage estimate of the prev alence of A for m sim- ulations with the same set of parameters, with standard de- viation giv en by σ . Complemen tary , we define the av erage 5 0 2 4 6 8 10 0.1 0.2 0.3 0.4 0.5 0.6 0.7 0.8 0.9 1 p 0 0.1 0.2 0.3 0 500 1000 1500 2000 0 0.1 0.2 0.3 0 500 1000 1500 2000 0 0.1 0.2 0.3 0.4 0 10 20 30 40 50 0 0.1 0.2 0.3 0.4 0 10 20 30 40 50 0.1 0.2 0.3 0.4 0.5 0.6 0.7 0.8 0.9 1 p 0 500 1000 1500 2000 0 500 1000 1500 2000 0 10 20 30 40 50 0 10 20 30 40 50 0.1 0.2 0.3 0.4 0.5 0.6 0.7 0.8 0.9 1 p 0 500 1000 1500 2000 0 500 1000 1500 2000 0 10 20 30 40 50 0 10 20 30 40 50 0.1 0.2 0.3 0.4 0.5 0.6 0.7 0.8 0.9 1 p 0 500 1000 1500 2000 0 500 1000 1500 2000 0 10 20 30 40 50 0 10 20 30 40 50 0.1 0.2 0.3 0.4 0.5 0.6 0.7 0.8 0.9 1 p 0 500 1000 1500 2000 0 500 1000 1500 2000 0 10 20 30 40 50 0 10 20 30 40 50 Ω ( x1000 ) F(S) F(S) F(W) F(W) Many triangles No communities No triangles No communities Few triangles Strong communities Few triangles W eak communities Many triangles Strong communities S S W W S S W W S S W W S W W S S W W a) f) b) g) c) h) d) i) e) j) k) p) l) q) m) r) n) s) o) t) u) v) w) x) y) Figure 2: Statistics of recruitment trees. The panel shows a,f,k,p,u) the total number of recruited subjects Ω for different resp onse-rates p (dotted lines correspond to zero, bars on p oints correspond to the standard error), the distribution of size of recruitment trees S p er seed for response-rates b,g,l,q,v) p = 0 . 7 and c,h,m,r,w) p = 1 . 0 (histogram bin size is 100), and the distribution of numb er of waves W p er seed for resp onse-rates d,i,n,s,x) p = 0 . 7 and e,j,o,t,y) p = 1 . 0 (histogram bin size is 5). The underlying structures are random netw orks with different number of triangles and different levels of community structure (See Section I I.A). bias δ , i.e. the difference b et ween the estimate of the prev a- lence of A and the true prev alence of A , for m simulations, as: δ = m X j =1 | ˆ P j A − P A | m (3) In the results, we show the relative bias in resp ect to the true v alue of the prev alence, i.e. we show ∆ = δ / 0 . 25. The design effect 27 D .E . is defined as: D .E . = V ar ( ˆ P A ) RDS V ar ( ˆ P A ) SRS (4) where V ar ( ˆ P A ) RDS is the v ariance of the estimator ˆ P A using RDS, and V ar ( ˆ P A ) SRS is the v ariance of the same estimator ˆ P A using simple uniform sampling (SRS), i.e. the same num b er of no des (as in the RDS sample) is uniformly selected in the study p opulation. The design effect thus measures the n umber of the sample cases necessary to obtain the same statistics as if a simple random sample was used. In our study , m = 500 (50 RDS simulations for eac h of the 10 generated netw ork with fixed parameters, and 500 RDS sim ulations for each of the empirical netw orks). I I I. Results W e first discuss the statistics of recruitmen t trees for syn- thetic net w orks with v arious lev els of clustering and com- m unity structure. W e then analyze the p erformance of the RDSI I estimator for different net w ork structures and for dif- feren t scenarios of prev alence of the infection A . This analy- sis is follow ed by results on the conv ergence of the estimator for increasing sample size on netw orks with strong commu- nit y structure. Afterw ards, we study the RDS p erformance considering the same scenarios of prev alence of the infection using real so cial netw orks and conclude the results section sho wing the increased bias as a consequence of running a single recruitmen t tree p er time. A. Recruitment trees W e first lo ok at some statistics of the recruitment trees in the case that the entire target p opulation can p oten tially b e recruited, i.e. the recruitment only stops if no new sub ject is recruited or if the netw ork is exhausted (every one is re- cruited). Since the p opulation is fixed to 10000 individuals, this limiting case provides us the maximum p ossible cov er- age of the sampling for a given configuration of the RDS. In the reference case (Fig. 2a-e), only the degree distribution is fixed and the no des are uniformly connected (configuration mo del, see Section I I.A). In this case, if every recruited indi- vidual resp onds to the survey , i.e. p = 1 . 0 (see Section I I.B), nearly all the p opulation is recruited. The recruitmen t dy- namics how ever is not robust to v ariations in the resp onse- rate, for example, in our sim ulations, for p = 0 . 7, only ab out 80% of the p opulation is recruited, and this p ercen tage falls to negligible v alues if p < 0 . 4 38,39 . Successful recruitment in fact o ccurs only if p & 0 . 35 in the absence of any (or negligi- ble) triangles and communit y structure. W e observe a broad distribution in the size of the recruitment trees (Fig. 2b,c). There is a relatively high chance for the recruitment trees 6 -0.2 0 0.2 0.4 0.6 0 20 40 60 80 100 0 1 2 3 -0.2 0 0.2 0.4 0.6 0 20 40 60 80 100 0 4 8 12 16 20 0.1 0.2 0.3 0.4 0.5 0.6 0.7 0.8 0.9 1 p 0.1 0.2 0.3 0.4 0.5 0.6 0.7 0.8 0.9 1 p 0.1 0.2 0.3 0.4 0.5 0.6 0.7 0.8 0.9 1 p 0.1 0.2 0.3 0.4 0.5 0.6 0.7 0.8 0.9 1 p No triangles Max. 10000 participants θ Δ(%) D.E. θ Δ(%) D.E. a) g) b) h) c) i) d) j) e) k) f) l) m) s) n) t) o) u) p) v) q) w) r) x) Many triangles Max. 10000 participants No triangles Max. 500 participants Many triangles Max. 500 participants Uniform Infection Preferential Infection Figure 3: RDS estimates fo r netw orks with triangles. The panel shows a,d,g,j,m,p,s,v) the RDS estimato r θ (Eq. 2) and the resp ective standa rd devi- ation σ , b,e,h,k,n,q,t,w) the average bias ∆ (Eq. 3), and c,f,i,l,o,r,u,x) the design effect D .E . (Eq. 4) in respect to the resp onse-rate p . In the 1st and 3rd columns, the underlying netw orks have no triangles and recruitment is limited resp ectively to 10000 and to 500 participants. In the 2nd and 4th columns, the netw orks have a large numb er of triangles and recruitment is limited resp ectively to 10000 and to 500 participants (See Section I I.A). In all cases, 25% of the p opulation is infected with A , either follo wing the protocol RI, i.e. infections are uniformly spread (top 3 ro ws), o r protocol PRI, i.e. infections occur preferentially in high degree no des (b ottom 3 ro ws) (See Section II.C). Dotted horizontal lines a re ey e-guides. to break do wn quic kly and th us to contain only a few in- dividuals. This typically happ ens when a recruitment tree reac hes a high-degree node. High-degree nodes are easily reac hable because they hav e man y connections. Once the first recruitment tree passes through one of these high-degree no des, they b ecome unav ailable. Consequently , the recruit- men t trees arriving afterwards simply die out as soon as they reac h these no des. At the same time, a few recruit- men t chains p ersist long enough and generate large trees, p oten tially sampling large parts of the netw ork from a sin- gle initial seed. As exp ected, there is a characteristic p eak in the n umber of wa v es (Fig. 2d,e). The increasing lev el of clustering has some effect in the statistics of the recruitment trees. In particular, in the ab- sence of comm unities, a large num b er of triangles improv e re- cruitmen t for intermediate v alues of resp onse-rates (Fig. 2f- j). T riangles create redundan t paths eliminating bottlenecks in the netw ork, as for example, b ottlenecks due to high de- gree no des. High degree no des mak e a large n umber of con- tacts and th us connect differen t parts of the net work. As men tioned b efore, as so on as these no des are recruited, the recruitmen t c hain ma y not b e able to expand b ey ond them. On the other hand, if the net work has weak (Fig. 2k) or strong (Fig. 2p,u) communit y structure, the n umber of trian- gles b ecomes irrelev ant, and the level of comm unity structure defines the sample size. In case of strong communit y struc- ture (with lo w or large n umber of triangles), a maxim um of ∼ 85% of the p opulation may b e recruited (Fig. 2p,u). Bottlenec ks in this case corresp ond to no des bridging com- m unities. These b ottlenec ks cannot b e remo ved by adding triangles, that only pro duce lo cal net work redundancy , but b y connecting more nodes betw een different comm unities, i.e. weak en the communit y structure. Moreo ver, strong com- m unities imply that response-rates should be higher (in com- parison to the absence of or to weak er comm unities) for the recruitmen t chains to take off and gather sufficient partici- pan ts. If resp onse-rates are b ello w p ∼ 0 . 45, recruitment is insufficien t. This is a fundamen tal issue in realistic settings, meaning that highly clustered (or in other words, highly segregated and marginalized) p opulations need a bit higher comp ensation in order to achiev e the same sampling size as one w ould obtain if studying less segregated groups. W e see that irrespective of the n umber of triangles or level of comm unity structure, lo w er resp onse-rates cause a rela- tiv ely larger num b er of small recruitmen t trees together with a few wa ves (Fig. 2b,d,g,i,l,n,q,s,v,x). This is not only un- desirable b ecause the final sample remains small but also b ecause a few wa ves is not sufficient for the sto c hastic pro- 7 -0.2 0 0.2 0.4 0.6 0 20 40 60 80 100 120 0 3 6 9 12 -0.2 0 0.2 0.4 0.6 0 20 40 60 80 100 120 0 1 2 3 0.1 0.2 0.3 0.4 0.5 0.6 0.7 0.8 0.9 1 0.1 0.2 0.3 0.4 0.5 0.6 0.7 0.8 0.9 1 p p θ Δ(%) D.E. θ Δ(%) D.E. a) g) b) h) c) i) d) j) e) k) f) l) Max. 500 participants Max. 10000 participants Preferential Infection (PI) Preferential Infection (PRI) Figure 4: RDS estimates fo r netw orks with w eak community structure. The panel shows a,d,g,j) the RDS estimator θ (Eq. 2) and the resp ective standard deviation σ , b,e,h,k) the average bias ∆ (Eq. 3), and c,f,i,l) the design effect D.E . (Eq. 4). The underlying netw orks have a few numb er of triangles and weak community structure (See Section I I.A), and re- cruitment is limited resp ectively to 500 (1st column) and to 10000 (2nd column) participants. In both cases, 25% of the p opulation is infected with A preferentially to wa rds high degree no des following either p roto col PI (top 3 rows) or protocol PIR (b ottom 3 rows) (See Section I I.C). cess to forget the initial conditions and thus reach the sta- tionary state, the condition in which the estimator is ex- p ected to b e unbiased. In case of strong comm unity struc- ture (Fig. 2s,t,x,y), we note a broader v ariance in the num- b er of w av es suggesting that each seed samples the netw ork non-homogeneously . This ma y b e related to the fact that the communities hav e different sizes (or n umber of no des) and thus the b ottlenec ks b et ween communities are reached at differen t times by different recruitmen t chains. B. RDS estimates and structure-induced bias T o study the impact of the netw ork structure and resp onse-rates in the RDS estimator, w e measure four statis- tics: (i) the av erage RDSI I estimator θ (Eq. 2) and its re- sp ectiv e (ii) standard deviation σ , (iii) the a verage bias ∆ (see Eq. 3), and (iv) the design effect D .E . (Eq. 4) (See Section I I.D). Figures 3a-f,m-r show the reference case, i.e. the configuration mo del where the only structure is in the degree sequence and the rest is random (See Section I I.A). In this reference case, if there is no restriction to the sam- ple size in resp ect to the size of the target p opulation (i.e. up to 10000 individuals may b e sampled, but actual sample size depends on the resp onse-rate), the estimator θ performs w ell, although with substantial standard deviation σ and bi- ases ∆ for p < 0 . 4 ev en if the quantit y A is uniformly spread in the netw ork (Fig. 3a-c). This is a result of the insufficient sample size for lo w resp onse-rates. Individuals with a large num b er of contacts are b eliev ed to b e more central in a netw ork 14 . These individuals may b e for example more likely to get an infection or propagate a piece of information. W e thus test an hypothetical scenario where A is concentrated in high-degree no des (See proto- col PRI in Section I I.C). Note that this assumption ma y b e how ev er completely irrelev ant in some con texts, but it is useful to understand the mechanisms of sampling. In this case, the accuracy of the estimator θ is p o or for p > 0 . 3, i.e. A is under-estimated for b oth situations, with and with- out many triangles, and precision is worse for response-rates p < 0 . 35 (respectively Fig. 3j-l and Fig. 3d-f ). As b efore, the p oor accuracy is a result of the RDS not recruiting suf- ficien t participants. The under-estimation of the prev alence ho wev er suggests that low-degree no des are not b eing suffi- cien tly sampled as the sample size gets close to the net work size. A substantial bias, given by ∆, is also observed. The design effect v aries b et w een 1 and 2, with some exceptions for p ∼ 0 . 4 in case of many triangles. If the num b er of par- ticipan ts is limited to only 500 individuals, i.e. 5% of the total p opulation (a small fraction of the target p opulation, as usually recommended to guaran tee un biased estimates 7 ), the p erformance of the estimator θ and the av erage bias ∆ impro ves substantially . Ho wev er, A remains slightly under- estimated and the standard deviation σ increases in the case of many triangles irresp ectiv e of the resp onse-rates (Fig. 3v- x). The cost of this improv ement ho wev er is a muc h higher design effect (Fig. 3x). Figure 4a-f sho ws that in netw orks with w eak comm unity structure, if A is concentrated at the high-degree no des, the estimates remain goo d for p & 0 . 2 if the maximum num- b er of participants is low (up to 500) compared to the total size of the target p opulation. In the limiting case where all individuals can p oten tially participate (up to 10000), A is sligh tly o verestimated and substantially underestimated resp ectiv ely for small and large resp onse-rates, b eing accu- rate only for mo derate v alues, i.e. p ∼ 0 . 4 (Fig. 4g-l). The results suggest that for larger resp onse-rates, there is a sig- nifican t under-represen tation of lo w-degree nodes in the final sample. This happ ens b ecause low-degree no des b ecome in- creasingly more difficult to sample as the sample size gets close to the netw ork size (causing finite-size effects). Biases are also larger if the communit y structure is stronger because the recruitment chains die out b efore exploring some of the comm unities. Altogether, these results are in accordance with previous recommendations that the sample size should b e muc h smaller than the size of the target p opulation 7 in order to ac hieve go o d estimates using the RDSI I estimator. Some caution how ever should b e p oin ted out since it is not straigh tforward to kno w in adv ance the size of the target p opulation and thus to estimate the optimal sample size in resp ect to the target p opulation. If to o many sub jects are recruited, relatively to the size of the target p opulation, sat- uration o ccurs and the netw ork structure induces biases in the estimator due to finite-size effects. 8 Infection Small Communities (SI) Infection Small Communities (SRI) -0.2 0 0.2 0.4 0.6 0 20 40 60 80 100 120 0 10 20 30 40 -0.2 0 0.2 0.4 0.6 0 20 40 60 80 100 120 0 3 6 9 12 0.1 0.2 0.3 0.4 0.5 0.6 0.7 0.8 0.9 1 p 0.1 0.2 0.3 0.4 0.5 0.6 0.7 0.8 0.9 1 p 0.1 0.2 0.3 0.4 0.5 0.6 0.7 0.8 0.9 1 p 0.1 0.2 0.3 0.4 0.5 0.6 0.7 0.8 0.9 1 p Strong Communities Strong-Moderate Weak Communities Moderate-Weak θ Δ(%) D.E. θ Δ(%) D.E. a) g) b) h) c) i) d) j) e) k) f) l) m) s) n) t) o) u) p) v) q) w) r) x) Figure 5: Prevalence of A in the smallest communities. The panel shows a,d,g,j,m,p,s,v) the RDS estimator θ (Eq. 2) and the respective standard deviation σ , b,e,h,k,n,q,t,w) the average bias ∆ (Eq. 3), and c,f,i,l,o,r,u,x) the design effect D .E . (Eq. 2). The underlying contact netw o rks have var- ious levels of community structure (See Section II.A), and recruitment is limited to 500 participants. In all cases, 25% of the p opulation is infected with a quantity A , following either protocol SI (top 3 rows) or protocol SRI (b ottom 3 rows) (See Section I I.C). W e no w sim ulate scenarios where the v ariable A is concen- trated in sp ecific comm unities, irresp ective of the degree of the no des. This is a reasonable assumption considering that an infection (or other particular quantities) may affect only the population of some geographical region, or for example, a particular group of injecting drug users among MSM may b e sharing contaminated paraphernalia. By using the kno w structure of each net work, w e select 25% of the no des asso- ciated to the smallest communities and infect them with the quan tity A (See Section II.C). In this setting, the prev alence is underestimate and the estimator has relativ ely large devia- tions (Fig. 5a,g) for strong and strong-mo derate communit y structure. Estimators improv e for weak er communit y struc- ture (Fig. 5m,s). Even for weak communit y structure, the minim um av erage bias is ab out 15% (Fig. 5t), being at least 45% in case of strong communities (Fig. 5b) for p = 1 . 0. F or low er resp onse-rates, the bias gets substantially larger, as in the previous experiments. The design effect is also significan tly affected for an y lev el of comm unit y structure (Fig. 5c,i,o,u). This means that for strong communities, for example, in order to hav e the same statistics as if a standard simple random sample was p erformed, the RDS needs up to 40 times the same sample size. F urthermore, if w e redis- tribute the infection of 40% randomly chosen infected no des to decrease homophily , the ov erall quality of the statistics impro ves but still with significant bias, and larger standard deviation and des ign effect for stronger comm unity structure (Fig. 5d-f,j-l,p-r,v-x). On the other hand, we can assume that A is unlik e to o ccur in small communities b ecause, for example, no des as- so ciated to these communities are simply less lik ely to get an infection due to isolation. So cial con trol is also often higher in small groups. It may therefore b e easier to b ehav e in certain wa ys in larger groups. P eople who wan t to or who ha ve particular b eha viors or traits may thus decide to mo ve to larger groups. T o simulate this h yp othetical scenario, w e infect 25% of the no des in the largest comm unities (See Section I I.C). Figure 6a shows that A is ov erestimated for p > 0 . 3 for strong communit y structure. These estimates impro ve for weak er communities, also resulting on smaller standard deviations (Fig. 6g,m,s) for larger resp onse-rates. The standard deviation is generally slightly larger in this case in comparison to the case where A is concen trated in the small comm unities. The design effect is very high for strong communit y structure (Fig. 6c,i), even if homophily is reduced (Fig. 6f,l). W e p erform the same analysis using netw orks with the same configuration studied until now but with higher clus- tering co efficient (b etw een 0.5 and 0.6) and the results re- main quantitativ ely the same (apart for a few fluctuations). 9 Infection Large Communities (BI) Infection Large Communities (BRI) -0.2 0 0.2 0.4 0.6 0 20 40 60 80 100 120 0 20 40 60 80 -0.2 0 0.2 0.4 0.6 0 20 40 60 80 100 120 0 4 8 12 16 20 24 0.1 0.2 0.3 0.4 0.5 0.6 0.7 0.8 0.9 1 p 0.1 0.2 0.3 0.4 0.5 0.6 0.7 0.8 0.9 1 p 0.1 0.2 0.3 0.4 0.5 0.6 0.7 0.8 0.9 1 p 0.1 0.2 0.3 0.4 0.5 0.6 0.7 0.8 0.9 1 p Strong Communities Strong-Moderate Weak Communities Moderate-Weak θ Δ(%) D.E. θ Δ(%) D.E. a) g) b) h) c) i) d) j) e) k) f) l) m) s) n) t) o) u) p) v) q) w) r) x) Figure 6: Prevalence of A in the largest communities. The panel shows a,d,g,j,m,p,s,v) the RDS estimator θ (Eq. 2) and the resp ective standard de- viation σ , b,e,h,k,n,q,t,w) the average bias ∆ (Eq. 3), and c,f,i,l,o,r,u,x) the design effect D .E . (Eq. 2). The underlying contact netw o rks have various levels of community structure (See Section I I.A), and recruitment is limited to 500 participants. In all cases, 25% of the p opulation is infected with A , following either protocol BI (top 3 rows) or p roto col BRI (bottom 3 rows) (See Section I I.C). 0.2 0.3 0.4 0.18 0.20 0.22 0.24 0.26 0 0.05 0.10 0.15 0 0.05 0.10 0.15 100 1000 Sample Size 100 1000 Sample Size 100 1000 Sample Size Θ Θ σ σ p=0.4 p=0.5 p=0.6 Small Communities Large Communities High Degree a) e) b) f) c) g) d) h) i) j) k) l) Figure 7: Estimates of p revalence and sample size. The panel shows the estimator θ and the resp ective standard deviation σ for net wo rks with a,b,e,f,i,j) strong and c,d,g,h,k,l) weak community structure. In the 1st column, A is concentrated in the small communities (SRI protocol), in the 2nd column, A is concentrated in the large communities (BRI protocol), and in the 3rd column, A is concentrated in the high degree nodes (PRI protocol). This finding reinforces the previous observ ation that trian- gles hav e a relatively small impact in RDS if communities are presen t in the netw ork. Altogether, these results sho w the k ey difference b et ween clustering and homophily that was men tioned in the Introduction. In b oth scenarios, the net- w ork communit y structure and the n umber of triangles are the same, and homophily is high. In the later case (Fig. 6) homophily o ccurs inside the largest communities whereas in the first case (Fig. 5) it happ ens in the smallest communities. The structure-induced biases ho w ever remain relatively high ev en if the homophily is reduced by redistributing a fraction of the infections. C. Convergence and sample size In the previous section, w e hav e studied the bias induced b y the netw ork structure and the resp onse-rates. If we fix the resp onse-rate, each realization of the sim ulation generates a differen t sample size due to the sto c hastic nature of the pro- cess. In this section, therefore, w e fix the resp onse-rate and analyze the effect of the sample size on the estimator. Since recruitmen t may stop at different times on eac h simulation, here we estimate the mean and standard deviation for sam- ple size S using only simulations in which the recruitment reac hes this size S . This means that the estimates for large sample sizes hav e less data p oints (to calculate the mean) than those for small sample sizes. Previous studies rep ort that in real settings, response-rates ma y v ary b etw een 0 . 3 (for female sex-work ers) and 0 . 7 (for MSM), with mean and 10 Infection Small Communities (SRI) Infection Large Communities (BRI) -0.2 0 0.2 0.4 0.6 0 30 60 90 120 150 180 0 5 10 15 20 25 30 -0.2 0 0.2 0.4 0.6 0 20 40 60 80 100 0 3 6 9 12 15 0.1 0.2 0.3 0.4 0.5 0.6 0.7 0.8 0.9 1 0.1 0.2 0.3 0.4 0.5 0.6 0.7 0.8 0.9 1 θ Δ(%) D.E. θ Δ(%) D.E. p p Strong Communities Weak Communities a) g) b) h) c) i) d) j) e) k) f) l) Figure 8: RDS estimates with seeds selected inside small communities. The panel shows the RDS estimato r θ (Eq. 2) and the resp ective stan- dard deviation σ , the average bias ∆ (Eq. 3), and the design effect D .E . (Eq. 4). In all cases, 25% of the p opulation is infected with A in a-c,g-i) the smallest communities and in d-f,j-l) the largest communities (See Section I I.C). a-f ) netw orks with strong communities and g-l) netw orks with weak communities. median at ab out 0 . 5 23 . W e thus study 3 scenarios for the resp onse-rates: p = 0 . 4 , 0 . 5 , 0 . 6. Figure 7 shows that for strong communit y structure, θ is slightly ov erestimated for sample sizes smaller than 100 and underestimated for larger sample sizes if A is concentrated in the smallest communi- ties (Fig. 7a,b). On the other hand, the prev alence of A is o verestimated for sample sizes larger than 100 if A is concen- trated in the largest communities (Fig. 7e,f ). In b oth cases, the mismatch is maximized when the sample size is b et ween ab out 10% and 30% (i.e. 100 and 1500 participants resp ec- tiv ely) of the study p opulation. If A is concentrated in the high degree nodes, θ is underestimated for increasing sample size (Fig. 7i,j) but not as muc h as for the previous cases. On the other hand, if the comm unity structure is w eak, the esti- mator p erforms well (with sligh t ov er- and under-estimation of the prev alence for small (Fig. 7c,d) and large (Fig. 7g,h) comm unities, except in the case of A b eing concentrated in high degree no de (Fig. 7k,l). In this case, the estimates are only go od in the range of sample sizes betw een 100 and 1000 no des. Infection Small Communities (SRI) Infection Large Communities (BRI) -0.2 0 0.2 0.4 0.6 0 20 40 60 80 100 0 1 2 3 -0.2 0 0.2 0.4 0.6 0 20 40 60 80 100 120 0 5 10 15 20 25 30 0.1 0.2 0.3 0.4 0.5 0.6 0.7 0.8 0.9 1 0.1 0.2 0.3 0.4 0.5 0.6 0.7 0.8 0.9 1 θ Δ(%) D.E. θ Δ(%) D.E. p p Strong Communities Weak Communities a) g) b) h) c) i) d) j) e) k) f) l) Figure 9: RDS estimates with seeds selected inside large communities. The panel shows the RDS estimato r θ (Eq. 2) and the resp ective stan- dard deviation σ , the average bias ∆ (Eq. 3), and the design effect D .E . (Eq. 4). In all cases, 25% of the p opulation is infected with A in a-c,g-i) the smallest communities and in d-f,j-l) the largest communities (See Section I I.C). a-f ) netw orks with strong communities and g-l) netw orks with weak communities. D. Seed-induced bias W e hav e assumed so far that seeds are uniformly chosen within the target population. While this is a reasonable standard assumption in theoretical studies, it is hardly met in real contexts b ecause the inherent fact that the study p opulation is hard-to-reach and seed selection is non triv- ial 40 . A biased selection of seeds can increase the bias in the RDS estimators as shown in Figs. 8 and 9. If seeds are selected only betw een sub jects asso ciated to small com- m unities (here defined as comm unities with less than 200 mem b ers), recruitmen t chains are generally unable to reach b ey ond those communities and thus the prev alence is o ver- estimated when the infection is concentrated in the smaller comm unities (Fig. 8a-c). On the other hand, the prev a- lence is underestimated if the infection is concentrated in the larger comm unities (Fig. 8d-f ). The mismatch in the estima- tors are particularly significant if the communit y structure is stronger, how ev er, the prev alence is also strongly biased for low resp onse-rates (and weakly biased for high resp onse- rates) even if the communit y structure is weak (Fig. 8g-l). This is in con trast to the our previous findings when seeds are uniformly sampled (Fig. 5 and 6). If one selects the seeds in the largest communities (here 11 0 0.1 0.2 0.3 EMA1 EMA2 ADH POK ENR 0 5 10 15 20 25 0 1 2 3 4 5 6 7 8 0 0.1 0.2 0.3 EMA1 EMA2 ADH POK ENR p=0.4 p=0.5 p=0.6 0 5 10 15 20 25 0 1 2 3 4 5 6 7 8 0 0.1 0.2 0.3 EMA1 EMA2 ADH POK ENR 0 5 10 15 20 25 0 1 2 3 4 5 6 7 8 θ Δ(%) D.E. Large Communities Small Communities High Degree EMA1 EMA2 ADH POK ENR EMA1 EMA2 ADH POK ENR EMA1 EMA2 ADH POK ENR EMA1 EMA2 ADH POK ENR EMA1 EMA2 ADH POK ENR EMA1 EMA2 ADH POK ENR Figure 10: RDS estimates fo r empirical netw orks. The panel shows the RDS estimator θ (Eq. 2) and the resp ective standard deviation σ , the average bias ∆ (Eq. 3), and the design effect D .E . (Eq. 4). The contact netw orks a re gathered empirically and correspond to different t yp es of social relation and p opulation size (See Section II.A). Recruitment is limited to 500 participants and the resp onse-rate p covers realistic values. In all cases, 25% of the p opulation is infected with a quantity A , either in the largest communities (1st column), or smallest communities (2nd column), or the high degree nodes (3rd column) (See Section I I.C). defined as comm unities with more than 500 members), re- cruitmen t chains tend to stay within the largest communi- ties, whic h leads to an under-estimation of the prev alence and relatively high biases if the infection is mostly prev a- len t in the small communities (Fig. 9a-c). The prev alence is ov erestimated, how ev er, if the infection is mostly prev a- len t in the largest comm unities (Fig. 9d-f ). Results improv e for weak communit y structure, but also in this case, biases and large standard deviations are observ ed for lo w resp onse- rates (Fig. 9g-l). Note that in these exp erimen ts homophily is relativ ely weak since we use protocols SRI and BRI. E. Empirical netw orks In the previous sections, we hav e studied the impact of v arious levels of communit y structure and num b er of trian- gles in RDS estimates in contact netw orks generated using theoretical mo dels. Although the algorithms used to gen- erate the syn thetic net works include several prop erties of real-life netw orks, empirical net works, with their o wn sam- pling and scope limitations, contain correlations that ma y b e c hallenging to repro duce theoretically . In this section, w e analyze the RDS p erformance using real-life h uman con tact net works in order to b e able to extend the conclusions to real scenarios. F ollowing the same proto cols to infect preferen- tially the largest (BRI proto col) or the smallest (SRI proto- col) communities, or the high degree no des (PRI proto col), w e find that in most studied netw orks, RDS performs w ell to estimate the mean prev alence in these hypothetical scenarios (although the standard deviations are relatively large), with a small v ariation for different resp onse-rates (Fig. 10). The estimates are w orse for EMA1 and ENR datasets, resp ec- tiv ely , the smallest and the largest net works (See T able 1 in Section I I.A). W e see that the av erage bias is larger than 10% with a few exceptions. It is also typically larger for p = 0 . 4. The design effect is generally somewhere b et ween 1 and 3 (one exception for p = 0 . 4 and EMA2), a result inline to previous suggestions that a design effect of 2 may be used as a general guideline on unkno wn p opulations 6 . 12 Infection Large Communities (BRI) Infection Small Communities (SRI) -0.2 0 0.2 0.4 0.6 0 20 40 60 80 100 120 140 0 20 40 60 80 100 -0.2 0 0.2 0.4 0.6 0 20 40 60 80 100 120 140 0 30 60 90 120 150 0.1 0.2 0.3 0.4 0.5 0.6 0.7 0.8 0.9 1 p 0.1 0.2 0.3 0.4 0.5 0.6 0.7 0.8 0.9 1 p θ Δ(%) D.E. θ Δ(%) D.E. Strong Communities Weak Communities a) g) b) h) c) i) d) j) e) k) f) l) Figure 11: RDS estimates with improved seed sampling mechanism. The panel shows the RDS estimato r θ (Eq. 2) and the resp ective stan- dard deviation σ , the average bias ∆ (Eq. 3), and the design effect D .E . (Eq. 4). Recruitment is limited to 500 pa rticipants. In all cases, 25% of the population is infected with A in a-c,g-i) the la rgest communities and in d-f,j-l) the smallest communities (See Section II.C). a-f ) netw orks with strong communities and g-l) netw orks with weak communities. F. Non-simultaneous seed sampling Recruitmen t trees often break down after a few wa ves in real settings. As discussed ab o v e, this is not only a conse- quence of low resp onse-rates but also the effect of multiple recruitmen t trees, originating from differen t seeds, bump- ing each other and then dying out. A practical solution to obtain sufficien tly large sample sizes is to restart the recruit- men t with new seeds as so on as the recruitment stops. In this section we test the effect on the estimators if we start a new seed after the previous recruitmen t c hain has com- pletely stopp ed, i.e. seeds start at different p oin ts in time. W e assume that the recruitment c hain stops either natu- rally or after reaching a certain size. In particular, we test the case when the target sample size is 500 participan ts out of the population of 10000 p eople, using 10 seeds as done in the previous se ctions. Each seed is allow ed to recruit (suc- cessfully) at maximum 50 participan ts, and a new seed is only selected (uniformly among non-recruited no des) when the current recruitment stops. As usual, the same p erson ma y participate only once. Figure 11 sho ws that the av erage estimator is affected and the prev alence is under-estimated if A is concentrated in the largest communities and ov er-estimated if A is more lik ely in smaller communities. The standard deviations are relativ ely large in case of strong comm unities (Fig. 11a,d) and decreases, but still maintaining relatively large v al- ues, for weak er communities (Fig. 11g,j). The av erage bias and design effect substantially c hange in comparison to the case when seeds are selected simultaneously , particularly for strong communit y structure. The restarting of seeds intro- duces mixing, or equiv alently , random links, in the netw ork structure 36 . Moreov er, the restriction in the size of the re- cruitmen t trees p ossibly inhibits the sampling pro cess to reac h the stationary state, a factor kno wn to cause biases in the estimators 3 . The ma jor consequence of these very large biases is that one is not sure that a single RDS exp er- imen t (as is usually the case in reality) provides a reliable estimate. Selecting exactly one new seed after the curren t seed has b eing exhausted is an h yp othetical situation. This extreme case ho wev er illustrates that the non-simultaneous selecting of seeds ma y increase the biases substantially unless only a few re-starts occur. W e exp ect that more realistic sce- narios (e.g. initially selecting m ultiple seeds simultaneously and even tually selecting a few new seeds if the original re- cruitmen t trees die out) lie somewhere betw een this case and the sim ultaneous seed sampling studied in Section I I I.B. IV. Discussions Resp onden t-driv en sampling has b een prop osed as an ef- fectiv e metho dology to estimate the prev alence of v ariables of interest in hard-to-reach p opulations. The approach ex- ploits information on the so cial con tacts for b oth recruit- men t and weigh ting in order to generate accurate estimates of the prev alence. Social netw orks how ev er are not random but contain patterns of connectivity that ma y constrain the cascade of sampling. In particular, no des hav e a high het- erogeneit y in the n umber of con tacts, and netw orks typically ha ve many triangles and a comm unity structure. In this pap er, we hav e studied the bias induced by com- m unity structure and netw ork triangles in the RDS by using b oth synthetic and empirical netw ork structures with v arious lev els of clustering, size, degree heterogeneity , and so on. W e ha ve also analyzed the impact of v arious resp onse-rates in the estimators and quan tified the relative bias for combina- tions of parameters. Altogether, we hav e identified that the structure of so cial net works hav e a relev an t impact on RDS leading to p oten tial biases in the RDS estimator. The es- timator generally p erforms sufficiently well if resp onse-rates are sufficiently high, the communit y structure is weak and the prev alence of the v ariable of interest is not muc h concen- trated in some parts of the netw ork (low homophily). The high heterogeneity of the net work communities implies that sampling c hains ma y get constrained to certain parts of the net work and thus the prev alence of the infection may b e ei- ther under- or ov er-estimated dep ending on whic h part of the net work concen trates more infections. Some parts of the net work ma y only b e accessed through tigh t bottlenecks, i.e. k ey individuals that bridge the small w ell-hidden sub-groups and the rest of the p opulation. If these bridging no des are not willing to participate in the recruitmen t or once they are recruited, recruitment trees get trapp ed within a group of no des, ov ersampling them, and generating biases. The structure of empirical net works may v ary in differ- 13 en t con texts. Consequen tly , the exp ected biases ma y be also low er or higher for certain social net works. In par- ticular, biases should increase for sparser netw orks b ecause less paths are av ailable b et ween the no des. In other words, there are more bridging no des maintaining the netw ork con- nected and thus the recruitment b ecomes more sensitive to lo wer response-rates. Similarly , low er biases are exp ected in denser net w orks. The num b er of net work communities and the distribution of communit y sizes may b e also differ- en t than the ones we consider. Many small communities ha ve a significan t effect in the sampling, increasing the bi- ases, b ecause they imply on the existence of many bridging no des and higher c hances to div ert or break down the re- cruitmen t. W e hav e also assumed that those p eople who c ho ose to not participate in the first in vitation may b e in- vited again. This p ossibly in tro duces a p ositiv e correlation b et w een chance to answer the survey and the degree of the no de, i.e. a tendency to o versample high degree no des not related to clustering or communit y structure. Since this is not p ossible for resp onse-rates p 6 = 1 and we generally ob- serv e relatively similar results for decreasing p , if this effect o ccurs, it is only relev ant for lo w resp onse-rates p . This ma y ho wev er explain why w e generally observ e a transition in the a verage bias at v alues ab o ve the critical resp onse-rates (the p oin t where a significant n um b er of individuals is recruited). On the other hand, the effect of clustering and communities should be ev en higher if we assume that p eople cannot b e in- vited more than once (or equiv alently , if someone refuses to participate the first time, it may refuse the following times as well) since this is further blo cking the access to certain parts of the net work. T o understand the effect of the participation probabilit y p , w e may consider the simple case where a one single coup on is exc hanged b et ween individuals, and the sampling is done with replacement 3 . In that case, the stochastic pro cess is equiv alent to a random walk pro cess if p = 1. The probabil- it y p i of finding a coup on with p erson i is driven by the rate equation ˙ p i = X j A ij k j p j − p i (5) where A ij is the adjacency matrix of the so cial net work. In the case of undirected and unw eighted netw orks, where eac h link is recipro cated and carries the same imp ortance, the element matrix ( i, j ) of the matrix is equal to 1 if there is a link b et ween i and j and zero otherwise. The study of this stochastic pro cess has a long tradition in applied mathe- matics and statistical physics (e.g. 35,41 ). Relev ant to our re- sults, it is known that the system conv erges to equilibrium if the underlying netw ork is connected 3 . In this regime, no des w ould b e visited by coupons with a probability proportional to their degree and the whole netw ork is explored, indep en- den tly on the initial conditions. Equilibrium is reached after a characteristic time scale τ defined as 1 /λ 2 , where λ 2 is the first non-zero eigenv alue of the Laplacian matrix driving p in Eq. (5). This time scale is asso ciated to the presence of a b ot- tlenec k (the bridging nodes) betw een tw o strongly connected comm unities in the netw ork. F or times smaller than τ , the random walk has essentially explored almost uniformly one single comm unity , but has not sufficien tly explored the other one. This time scale therefore provides us with a wa y to es- timate the minimal v alue of p needed for the whole graph to b e sampled, that is 1 − p < λ 2 . The case of sampling with restart is related to the pro cess of random walk with telep ortation. In that case, the choice of the seed where to restart the pro cess is known to affect the statistical prop er- ties of the sampling of the netw ork 36 . A future theoretical exercise is to adapt those ideas to this context in order to impro ve the RDS estimators on situations where restarting is necessary . F urthermore, using non-backtrac king random w alks ma y b e a p ossible theoretical direction to mo del RDS considering sampling without replacement. Those random w alks av oid to go back from where they come from, at the previous step, and they are known to explore the netw ork faster 37 . Finally , the results of our numerical exercise suggest some general recommendations for studies in real settings: i. Ex- p erimen tal researchers should be aw are of the p otential crit- ical bridge no des in the study p opulation, which may v ary according to the characteristics of the p opulation; ii. Ex- p erimen tal researchers should aim to resp onse-rates at least ab o v e 0.4 in order to reduce the asso ciated biases and un- certain ty of the estimates. This recommended resp onse-rate ma y b e increased if more coup ons are used; iii. A ttention should b e taken on selecting the seeds as uniformly as p os- sible, particularly aiming to a void many seeds either in the small or in the large groups (t ypically the most reac hable individuals). The temptation to start all seeds within well- hidden groups ma y cause the recruitment to not mov e b e- y ond these groups; iv. Restarting the seeds (to get larger sample sizes) during the ongoing recruitment should be gen- erally a voided. A b etter strategy may b e to either start the exp erimen t with more seeds or to increase resp onse-rates to a void drop outs. Ackno wledgements LECR is a FNRS c harg´ e de recherc hes. LECR and AET thank VR for financial supp ort. Autho r Contributions LECR and FL conceived the study . LECR performed the sim ulations and analyzed the results. LECR, AET, RL, FL wrote the man uscript. Additional info rmation The authors declare that they hav e no comp eting financial in terests. Correspondence and requests for materials should b e addressed to LECR (luis.ro c ha@ki.se). References 1. S. Sudman, M. G. Sirken, C.D. Cow an Sampling rare and elusiv e p opulations Science 240 991-996 (1988) 2. D. D. Hec k athorn Respondent-Driv en Sampling: A New ap- proac h to the study of hidden p opulations So c. Prob. 44(2) 174-199 (1997) 3. E. V olz and D. D. Heck athorn Probability based estimation theory for respondent driven sampling J. Off. Statist. 24 79- 97 (2008) 14 4. S. Semaan Time-space sampling and resp onden t-driv en sam- pling with hard-to-reac h Populations Methodological Inno v a- tions Online 5(2) 60-75 (2010) 5. A. Ab dul-Quader, D. Heck athorn, C. McKnight, H. Bram- son, C. Nemeth, K. Sabin, K. Gallagher, D. Des Jarlais Ef- fectiv eness of resp ondent-driv en sampling for recruiting drug users in new york city: Findings from a pilot study . J. Urban Health 83 (3) 459-476 (2006) 6. M. J. Salganik V ariance estimation, design effects, and sam- ple size calculations for respondent-driv en sampling. J. Urban Health: Bull. N. Y ork Acad. Med. 83 (7) i98-i110 (2006) 7. K. J. Gile and M. S. Handcock Resp onden t-driven sampling: An assessment of current metho dology . Sociol. Methodol. 40 285-327 (2010) 8. X. Lu, L. Bengtsson, T. Britton, M. Camitz, B. J. Kim, A. Thorson, F. Liljeros The sensitivity of resp onden t-driv en sampling J. R. Statist. So c. A 175 191-216 (2012) 9. A. M. V erdery , T. Mouw, S. Bauldry , P . J. Mucha Netw ork structure and biased v ariance estimation in respondent driven sampling pre-print arXiv:1309.5109 (2014) 10. W. Robinson, J. Risser, S. McGoy , A. Beck er, H. Rehman, M. Jefferson, V. Griffin, M. W olverton, S. T ortu Recruit- ing injection drug users: A three-site comparison of results and exp eriences with respondent-driv en and targeted sam- pling pro cedures J. Urban Health 83 29-38 (2006) 11. C. McKnight, D. Des Jarlais, H. Bramson, L. T ow er, A. S. Ab dul-Quader, C. Nemeth, D. Heck athorn Resp ondent- driv en sampling in a study of drug users in New Y ork City: Notes from the field J. Urban Health 83 54-59 (2006) 12. D. Abramovitz, E. M. V olz, S. A. Strathdee, T. L. Patterson, A. V era, S. D. F rost, E. Pro yecto Using-resp onden t-driven sampling in a hidden population at risk of HIV infection: Who do HIV-positive recruiters recruit Sex. T ransm. Diseas. 26 (12) 750-756 (2009) 13. M. Y. Iguchi, A. J. Ob er, S. H. Berry , T. F ain, D. D. Hec k athorn, P . M. Gorbac h, R. Heimer, A. Kozlov, L. J. Ouellet, S. Shoptaw, W. S. Zule Sim ultaneous recruitment of drug users and men who hav e sex with men in the United States and Russia using resp onden t-driven sampling: Sam- pling metho ds and implications J. Urban Health 86 (1) 5-13 (2009) 14. M. Newman Netw orks: An Introduction Oxford Universit y Press 720p (2010) 15. L. F. Costa, O. N. Oliveira Jr., G. T ravieso, F. A. Ro drigues, P . R. Villas Boas, L. Antiqueira, M. P . Viana, L. E. C. Ro c ha Analyzing and modeling real-w orld phenomena with complex net works: A surv ey of applications Adv. Phys. 60(3) (2011) 16. J. L. Martin, J. Wiley , D. Osmond Social Net works and Un- observ ed Heterogeneity in Risk for AIDS Population Researc h and Policy Review 22 (1) 65-90 (2003) 17. R. D. Burt, H. Hagan, K. Sabin, H. Thiede Ev aluating resp onden t-driv en sampling in a ma jor metropolitan area: Comparing injection drug users in the 2005 Seattle area na- tional HIV b eha vioral surveillance system survey with par- ticipan ts in the RA VEN and Kiwi studies Ann Epidemiol. 20 (2) 159-67 (2010) 18. N. McCreesh, L. G. Johnston, A. Copas, P . Sonnenberg, J. Seeley , R. J. Ha yes, S. D. W. F rost, R. G. White Ev aluation of the role of lo cation and distance in recruitmen t in respondent- driv en sampling In t. J. Health Geographics 10 (56) (2011) 19. L. G. Johnston, Y.-H. Chen, A. Silv a-Santisteban, H. F. Ra ymond An empirical examination of resp onden t driven sampling design effects among HIV risk groups from studies conducted around the world AIDS Behav. 17 (6) 2202-2210 (2013) 20. S. H. Lee, P .-J. Kim, H. Jeong Statistical prop erties of sam- pled netw orks Phys. Rev. E 73 016102 (2006) 21. M. Latapy , C. Magnien Complex netw ork measuremen ts: Estimating the relev ance of observed prop erties Info com’08 Pho enix, USA (2008) 22. S. W asserman, K. F aust So cial netw ork analysis: Metho ds and applications Cambridge Univ ersity Press 857p (1994) 23. K. J. Gile, L. G. Johnston, M. J. Salganik Diagnostics for resp onden t-driv en sampling J. R. Statist. So c. A (2015) 24. M. A. Serrano, M. Bogu˜ na T uning clustering in random net- w orks with arbitrary degree distributions Ph ys. Rev. E 72 036133 (2012) 25. A. Lancichinetti, S. F ortunato Benc hmarks for testing com- m unity detection algorithms on directed and weigh ted graphs with o verlapping communities Ph ys. Rev. E 80 016118 (2009) 26. M. Malekinejad, L. G. Johnston, C. Kendall, L. Kerr, M. R. Rifkin, G. W. Rutherford Using resp onden t-driven sampling metho dology for hiv biological and b eha vioral surveillance in in ternational settings: A systematic review Aids Behav. 12 (4) S105-S130 (2008) 27. S. L. Lohr Sampling: Design and analysis Cengage Learning: Boston, MA 608p (2009) 28. R. Guimera, L. Danon, A. Diaz-Guilera, F. Giralt, A. Arenas Ph ys. Rev. E 68 065103R (2003) 29. J.-P . Eckmann, E. Moses, D. Sergi, Entrop y of dialogues cre- ates coherent structures in e-mail traffic PNAS 101 14333- 14337 (2004) 30. Enron Email Net work http://snap.stanford.edu/data/email- Enron.h tml Accessed Decem b er 2014 31. J. Mo o dy P eer influence groups: Identifying dense clusters in large netw orks So c. Net. 23 261-283 (2001) 32. P . Holme, C. R. Edling, F. Liljeros Structure and time- ev olution of an Internet dating communit y So c. Net. 26(2) 155-174 (2004) 33. S. Brin, L. Page The anatomy of a large-scale hypertextual W eb searc h engine Comp. Net. ISDN Sys. 30(1-7) 107-117 (1998) 34. M. Rosv all, C. T. Bergstrom Maps of random walks on complex netw orks rev eal communit y structure PNAS 105(4) 1118-1123 (2008) 35. J.-Ch. Delvenne, S. Y aliraki, M. Barahona Stabilit y of graph comm unities across time scales. PNAS 107: 12755-12760 (2010) 36. R. Lambiotte, M. Rosv all Ranking and clustering of no des in net works with smart teleportation. Phys. Rev. E 85: 056107 (2012) 37. N. Alon, I. Benjamini, E. Lub etzky , S. Sodin Non- bac ktracking random walks mix faster. Commun. Contemp. Math. 9: 585 (2007) 38. J. Malmros, F. Liljeros, T. Britton Resp ondent-driv en sam- pling and an unusual epidemic. Pre-prin t (2014) 39. M. E. J. Newman The spread of epidemic disease on netw orks. Ph ys. Rev. E 66: 016128 (2002) 40. J. L. Wylie, A. M. Jolly . Understanding recruitment: out- comes asso ciated with alternate methods for seed selection in resp onden t driven sampling BMC Med. Res. Metho d. 13:93 (2013) 41. J. Klafter, I. M. Sokolo v First Steps in Random W alks: F rom T o ols to Applications. Oxford Universit y Press, Oxford (2011)
Original Paper
Loading high-quality paper...
Comments & Academic Discussion
Loading comments...
Leave a Comment