Ballistocardiogram Signal Processing: A Literature Review
Time-domain algorithms are focused on detecting local maxima or local minima using a moving window, and therefore finding the interval between the dominant J-peaks of ballistocardiogram (BCG) signal. However, this approach has many limitations due to…
Authors: Ibrahim Sadek
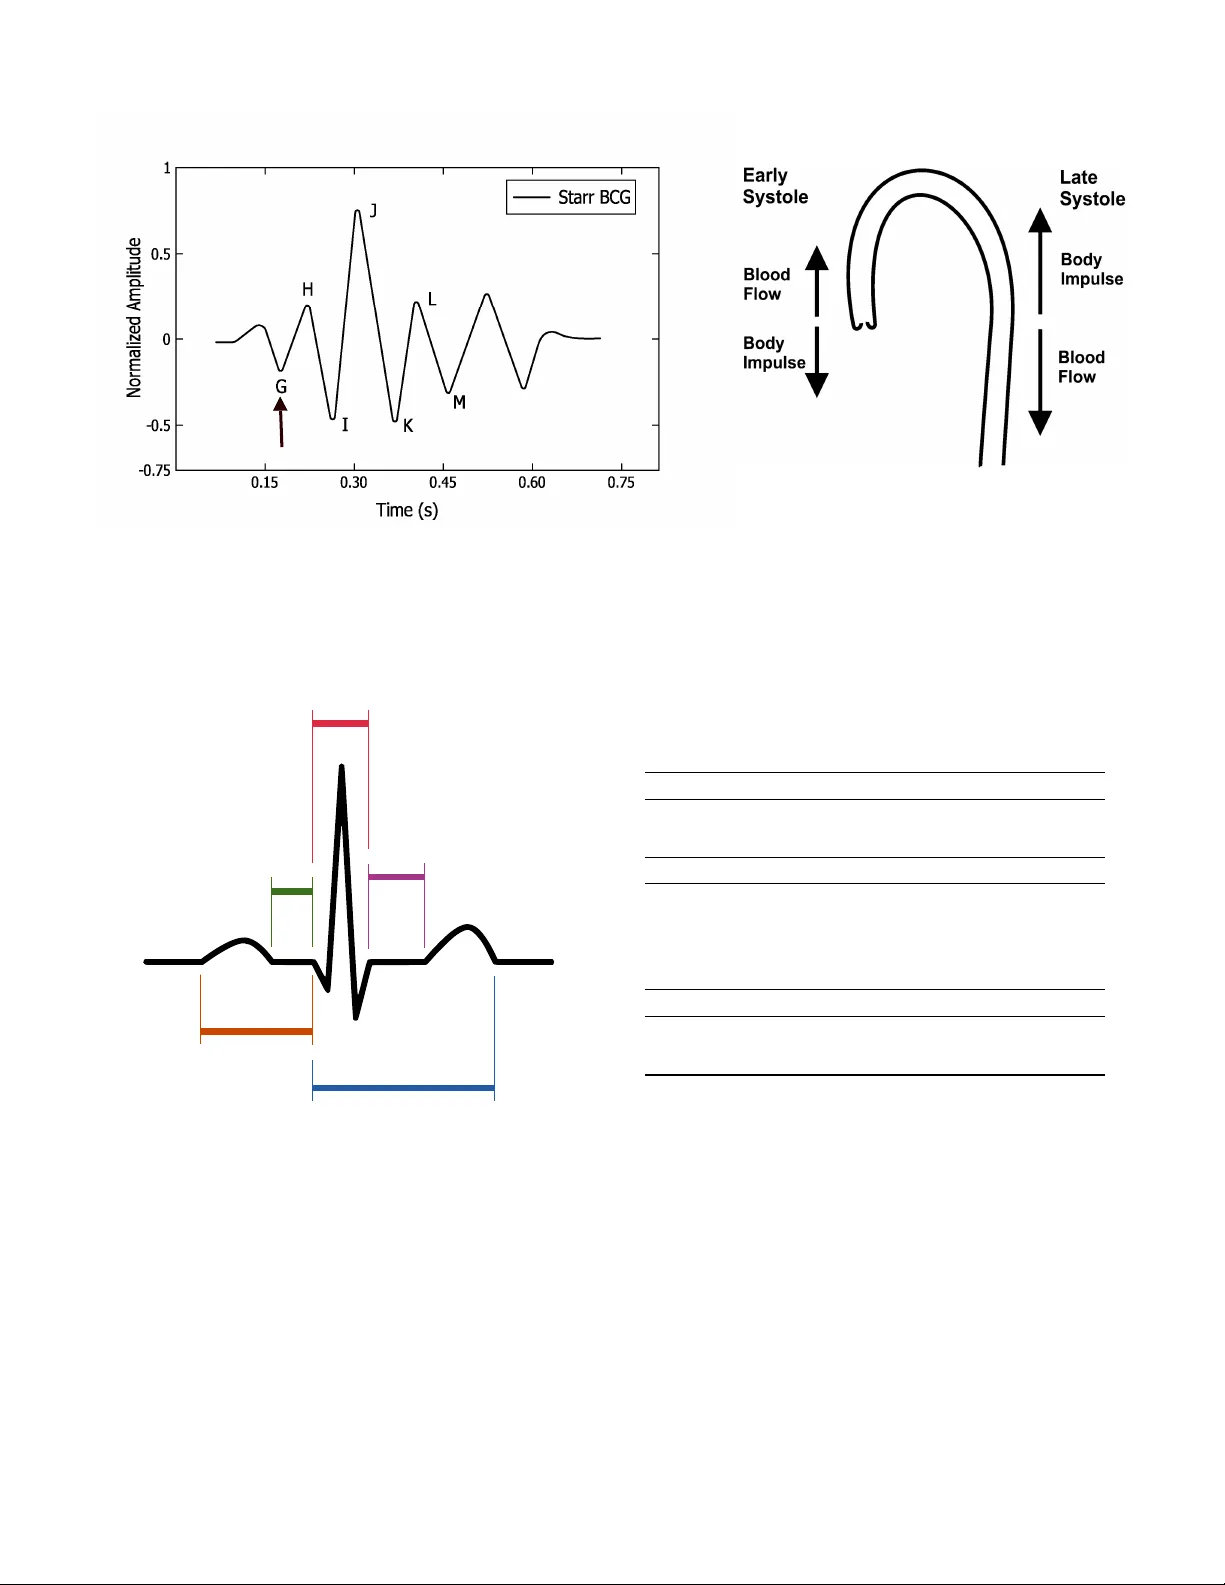
REVIEW P APER 1 Ballistocardiogram Signal Processing: A Literature Re vie w Ibrahim Sadek, Member , IEEE Abstract —There are sev eral algorithms for analyzing and interpr eting cardiorespiratory signals obtained fr om in-bed based sensors. In sum, these algorithms can be broadly grouped into three categories: time-domain algorithms, frequency-domain algorithms, and wav elet-domain algorithms. A summary of these algorithms is given belo w to highlight which category of algorithms will be used in our analysis. First, time-domain algorithms are mainly f ocused on detecting local maxima or local minima using a moving window , and ther ef ore finding the interval between the dominant J-peaks of ballistocardiogram signal. Howev er , this approach has many limitations because of the nonlinear and nonstationary beha vior of the ballistocardio- gram signal. The implication is that the ballistocardiogram signal does not display consistent J-peaks, which can usually be the case f or o ver night, in-home monitoring, particularly with frail elderly . Additionally, its accuracy will be undoubtedly affected by motion artifacts. Second, frequency-domain algorithms do not provide information about interbeat intervals. Nevertheless, they can provide information about heart rate variability . This is usually done by taking the fast Fourier transform or the in verse Fourier transform of the logarithm of the estimated spectrum, i.e., cepstrum of the signal using a sliding window . Thereafter , the dominant frequency is obtained in a particular frequency range. The limit of these algorithms is that the peak in the spectrum may get wider and multiple peaks may appear , which might cause a problem in measuring the vital signs. At last, the objective of wa velet-domain algorithms is to decompose the signal into different components, hence the component which shows an agreement with the vital signs can be selected. In other words, the selected component contains only information about the heart cycles or respiratory cycles, respectiv ely . Inter - beat intervals can be found easily by applying a simple peak detector . An empirical mode decomposition is an alter native approach to wa velet decomposition, and it is also a very suitable approach to cope with nonlinear and nonstationary signals such as cardiorespiratory signals. Apart from the above-mentioned algorithms, machine learning approaches have been implemented for measuring heartbeats. Howe ver , manual labeling of training data is a restricting property . Furthermore, the training step should be repeated whenever the data collection protocol has been changed. Index T erms —Ballistocardiogram, V ita signs, Nonintrusiv e monitoring, T echnology and services for home care. I . I N T RO D U C T I O N B ALLISTOCARDIOGRAPHY (BCG) is a noninv asive technique for creating a graphical representation of the heartbeat-induced repeated motions of the human body . These repeated motions happen due to the rapid acceleration of blood when it is ejected and mo ved in the great vessels of the body during periods of relaxation and contraction, known as diastole and systole, respecti vely . In other words, BCG can provide I. Sadek is with Image and Pervasiv e Access Laboratory (IP AL), CNRS UMI 2955, Singapore e-mail: (see ibrahim.sadek@ipal.cnrs.fr). information about the overall performance of the circulatory system; this is because BCG measures the mass mo vements, i.e., the mass of the circulating blood and the heart during the cardiac cycle [ 1 ]. During atrial systole, when the blood is ejected into the lar ge v essels, the center of mass of the body mov es to wards the head of the body . In other ways, when the blood mov es to wards the peripheral v essels and concentrates further away from the heart in the peripheral vessels, the center- of-mass moves to wards the feet (Fig. 1(b)). This shift comprises sev eral components as a result of cardiac acti vity , respiration, and body movements. This shifting of the center of mass of the body generates the BCG w av eform since the blood distribution changes during the cardiac cycle [ 5 ]. More than 100 years ago, BCG failed to prove its functionality , and it did not start to be used in routine tasks for a fe w general reasons as follows. First, there had been insuf ficient standard measurement methods, i.e., different methods had resulted in slightly different signals. Second, the exact physiologic origin of the BCG wav eform had not been well-understood. Furthermore, there had been insufficient clear guidelines for interpretation of the results, and therefore the medical community was unwilling to take risks. Third, there had been a dominant focus on some clinical diagnostic, for example, myocardial infar ction , angina pectoris , cor onary heart disease ; these applications need a high lev el of specificity and reliability that the BCG had not reached. Fourth, the emergence of ultrasound and echocardiography methods that swiftly overhauled BCG and related methods for nonin vasi ve cardiac and hemodynamic diagnostic [6]. At the present time, BCG has been given a lot of interest thanks to the information technology rev olution, including hardware technology as well as software and services. BCG sensors can be embedded in ambient en vironments without the need for medical staf f presence. Consequently , it has an outstanding impact in current e-health systems. Ultimately , BCG helps reduce checkups’ stress and the patient emotion and attention responses. Fig. 1(a) shows an example of a typical BCG signal, while Fig. 2(b) shows an example of a typical electrocardiogram signal. The BCG wav eforms may be grouped into three main groups, i.e., the pre-systolic (frequently disre garded), the systolic and the diastolic as giv en in T able I. The I and J wa ves are also quoted as ejection wa ves [ 1 ]. T o this extent, the definition, formal limitations, and nomenclature of ballistocardiography were discussed. The formal limitations were mainly due to the comple xity of the used system and misinterpretation of the obtained signals and its deformations. The field of ballistocardiography has been re vi ved as a result of the numerous technological advancements, as, for example, the advent of microprocessors and laptop computers. All in all, ballistocardiography can be very useful REVIEW P APER 2 (a) (b) Fig. 1. (a) Example of a typical BCG signal with letters used to designate the waves. The arrow indicates the position of the beginning of the electrical ventricular systole (QRS. complex of the electrocardiogram). Image adapted from [ 2 ], [ 3 ], [ 1 ], (b) Aortic arch and force vectors coming from blood ejection by the left ventricle. Image adapted from [4]. P Q R S T ST Segment PR Segment PR Interval QT Interval QRS Complex Fig. 2. Example of a typical electrocardiogram signal. in se veral applications such as monitoring of cardiac function and performance in addition to monitoring of sleep and sleep- disordered breathing [ 8 ], [ 9 ]. One of the most prominent features of ballistocardiography is the accessibility and ready- av ailability , which allows the system to be deployed in users’ homes without affecting the users’ pri v acy and daily activities. In what follo ws, we explain more in detail the various tools and algorithms e xist in the literature to analyze and interpret ballistocardiography , wherein we look at what types of sensors that can be used for signal acquisition and what types of software algorithms that can be used to extract vital information such as heartbeat, respiration, and body mo v ements. T ABLE I N O ME N C L A T U R E O F B AL L I ST O C AR D I O GR A M ( NO R M A L D I S P LA CE M E N T ) S I GN A L [ 7 ] , [ 1] . Pre-Systolic Group (See F ig. 1(a)) • F wav e: (rarely seen) headward wa ve preceding G, related to pre-systolic ev ents, not an after-vibration. • G wav e: small footward wa ve which at times precedes the H wa ve. Systolic W aves (See Fig. 1(a)) • H wav e: headward deflection that begins close to the peak of the R w av e, maximum peak synchronously or near the start of ejection. • I wav e: footward deflection that follo ws the H wav e, occurs early in systole. • J wav e: largest headward w av e that immediately follows the I w av e, occurs late in systole. • K wav e: footward wa ve follo wing J, occurs before the end of systole. Diastolic W aves (See Fig. 1(a)) • L and N wav es: two smaller headward deflections which usually follo w K. • M wav e: footward deflection between L and N. • Smaller subsequent wav es may be visible and are named in sequence. I I . P I E Z O E L E C T R I C P O LY V I N Y L I D E N E F L U O R I D E - B A S E D S E N S O R S The piezoelectric ef fect is the ability of some materials to produce an electric char ge in response to applied mechanical stress. The polyvinylidene fluoride (PVDF) is an exciting piezoelectric material and is usually de veloped as a very thin and easily bent film. If a pressure force is applied to the film, it creates a mechanical bending and a shifting of positi ve and negati ve charge centers in the film, which then results in an external electrical field. The charge generated from PVDF is equiv alent to the applied pressure. Therefore, PVDF is one of the suitable candidates for detecting the small fluctuations generated by dif ferent body parts [10]. W ang et al . [ 11 ] proposed to use a PVDF piezopolymer film sensor for unconstrained detection of respiration rhythm REVIEW P APER 3 and pulse rate. The film sensor was placed under the bed- sheet at the location of the thorax to obtain the variations of the pressure on the bed attributable to respiratory mov ement and heartbeats. The authors used the wa velet multiresolution decomposition to compute the respiration and heartbeat. The output of the respiratory inductance plethysmography (RIP) and electrocardiography (ECG) were used as a reference for respiration and heartbeat, respectively . The objectiv e of the wa velet analysis was to decompose the raw signal into low- frequency components and high-frequenc y components. Ne xt, the component presenting a good agreement with either the respiratory movement or the heartbeat was selected. Afterward, the respiratory rate was computed directly based on a time- varying adaptive threshold. On the other hand, the heartbeat component was first squared to rectify it into unipolar , and then the en velope of the rectified signal was calculated using a moving a v erage smoothing algorithm. At last, a time-varying adaptiv e threshold was also applied to the smoothed en velope to compute the heart rate. It should be noted that heart rate detection was v ery challenging because the pressure variations attributable to heartbeat on the bed was very weak, and the shape of the signal was not always uniform. Another study was proposed by W ang et al . [ 12 ] to detect respiration rhythm and pulse rate of premature infants using PVDF sensor array . The system was tested in clinical en vironments on fi ve premature infants (1 male and 4 females). The main challenge of the proposed system was frequent body movement of the infants and the weakness of the heartbeat vibration. Niizeki et al . [ 13 ] suggested using a PVDF sensor array for unconstrained monitoring of respiration and heart rate. The sensor array consisted of eight PVDF cable sensors and they were horizontally integrated with a te xtile sheet on a bed surface co vering the upper half of the body . The cardiorespi- ratory signals, i.e., BCG and respiration were obtained using infinite impulse response digital filters. After extracting the cardiorespiratory signals, an optimal sensor selection search routine was applied to select the most appropriate sensor . The selection criterion was based on the magnitude of the power spectrum density (PSD). The autocorrelation functions of the cardiac and respiratory signals were computed using a 5-second and 15-second time segments for heartbeat and respiration, respecti vely . The outputs of the autocorrelation functions were smoothed and dif ferentiated using a Savitzk y- Golay (5 adjacent points) algorithm and finally , the heart rate and respiration were computed by measuring the intervals between the peaks for the respectiv e autocorrelation functions. A fixed threshold was used to determine if the subject changes posture during the measurement, in which the output from the PVDF cables was disturbed to a large extent. A charge- coupled de vice (CCD) camera was used to record the image of the body position during posture change as a time stamp. The proposed system was tested against thirteen healthy male subjects whose ages ranged from 21 to 49 years. ECG and pneumotachometer for measuring respiratory flow were used as a reference during the study . The study consisted of two phases, i.e., short-term recording for 10 minutes and an overnight study for 2 hours. For the overnight recording, only 7 subjects were in volved. The proposed system had some limitations in particular susceptibility to motion artifacts caused by subject mov ements that might hav e led to the misidentification of the peak for autocorrelation functions. Paalasmaa and Ranta [ 14 ] applied an unsupervised learning approach on ballistocardiogram signals to compute heartbeat. The ballistocardiogram signals were collected from three subjects using a piezoelectric pressure sensor over 5 hours recording. T o start with, feature vectors were e xtracted from the signal at possible heartbeat positions, i.e., the local maxima of the signal. Then, a complete-link clustering w as applied to the feature v ectors to look for a cluster with the highest density . The positions of the feature vectors of the densest cluster were found to match real heartbeat positions in the signal. An angular dissimilarity measure was adopted since it omits the dif ferences in feature vector amplitudes. The sensor was located close to the patient’ s upper body so that it can register cardiac acti vity in a proper way . Paalasmaa et al . [ 15 ] introduced a sleep tracking web appli- cation, which was based on measurements from a piezoelectric film sensor placed under the mattress topper . The ra w data coming from the sensor was sent to a web server for analysis and e xtracting information. This information includes heart rate, respiration, sleep staging, and stress reactions. The heart rate was computed by creating a heartbeat template using complete-link clustering [ 14 ], then the heart rate intervals were detected by selecting those intervals that minimize a prede- termined residual error . The sleep staging was carried out by utilizing heart rate variation, respiration v ariation, and acti vity information. The proposed approach was v alidated against a 40-patient group at a sleep clinic. The added value of this work is the suitability of the system for long-term monitoring of sleep and the web application for sleep analysis at home. A more comprehensiv e study w as introduced by Paalasmaa et al . [ 16 ] to compute heart rate from ballistocardiogram signals acquired with piezoelectric film sensor . At first, a model for the heartbeat shape was adaptiv ely deduced from the signal using a hierarchical clustering approach. Afterward, interbeat intervals were identified by detecting positions where the heartbeat shape best matches the signal. The proposed method w as verified with ov ernight recordings from 46 subjects in dif ferent settings, i.e., sleep clinic, home, single bed, and double bed. Chen et al . [ 17 ] advised to use four piezoelectric sensors to detect heart rate and respiration. One sensor was placed under the pillo w , whereas the other three were placed under the mattress close to the back, hip, and calf level positions. The data was collected from five healthy subjects at age of twenties during a 2-hour’ s nap in a sleep lab . ECG and nasal thermistor signal were employed as heart rate and respiration references. Heart rate and respiration were computed based on the multiresolution analysis of the wa velet decomposition in which the Cohen–Daubechies–Feauv eau biorthogonal wav elet was selected as the basis function to design the decomposition and reconstruction filters. The 6 th lev el approximation wav eform was similar to the respiratory rhythm, while a combination of the 4 th and 5 th scale coef ficients were found to be suitable for heart rate detection. The authors were able to measure both vital signs from the four positions. Ho we v er , the overall optimal position was found in the back. That makes sense REVIEW P APER 4 because the more the sensor is closer to the thorax, the more accurate the recov ered signals are. A wheelchair-based system for monitoring the cardiac activity of its user was proposed by Pinheiro et al . [ 18 ]. The signals were collected from piezoelectric film sensors and micro-electromechanical systems accelerometers installed in the seat and backrest of the chair . The system also included photoplethysmography (PPG) sensors in the armrests. The data from the sensors were sent via W i-Fi to a laptop with a data acquisition board for deeper analysis. ECG recordings were used to validate the proposed system. The system was tested in different situations, namely unmoving wheelchair , tiled floor motion, and treadmill tests. In the last two situations, the ballistocardiogram signals collected from the piezoelectric sensors were completely corrupted by motion artifacts. On the other hand, the accelerometer was much more insensiti ve to wheelchair motion. The analysis was done on seven subjects using the fast Fourier transform. Subsequently , the prominent peak was selected within a specific frequency range for heart rate estimation. In a summary , getting informativ e ballistocardiogram signals from the piezoelectric sensors in a motion situation was almost impossible. Ho we v er , it w as more con venient to get informativ e signals from the accelerometers and the PPG sensors. A multichannel approach was proposed by K ortelainen et al . [ 19 ] to extract heart rate and respiration information using eight PVDF sensor channels located in the upper position of the bed. The heart rate was estimated by a veraging the signal channels in the frequency domain, in which a sliding time window was utilized to compute the cepstrum of each signal channel. Howe ver , the respiratory rate was computed from the first principal component of a principal component analysis (PCA) model applied to the low-pass filtered bed sensor signal. The assumption was that the first principal component will giv e the signal with the maximum v ariance, and as a result shall improv e the sensitivity for the extraction of the respiration. T wenty-eight patients were recruited for the study and they were suspected to hav e diverse kinds of sleep problems. Frequency domain averaging was better than simple av eraging ov er all the sensor channels. The extracted information, i.e., heart rate, respiration, and mo vement might have been used for further sleep analysis. The same pressure bed sensor assembly with eight PVDF sensors was applied for sleep apnea detection in [ 20 ]. The respiratory signal was computed by two methods. The first method was to apply a Hilbert transform to the bed sensor signal and then smooth the signal with a low pass filter . The second method was similar to K ortelainen et al . [ 19 ] by adopting the PCA approach. At last, the amplitude baseline of the respiratory signal was estimated as the mean value of the preceding 100 seconds. An apnea event was detected if the ratio with the baseline was less than a selected percentage threshold value for a period of at least 10 seconds. The authors applied their methodology to twenty-fiv e patients out of twenty-eight patients recruited in [ 19 ]. The system sho wed a good agreement with the reference polysomnography . Ho wev er , the authors used the simplified reduced respiratory amplitude index (RRAI) instead of the standard apnea-hypopnea index (AHI). In another study , Brüser et al . [ 21 ] have implemented three different methods using the same sensor set to measure the heart rate in a nonintrusi ve way . Initially , the heart rate was computed using a sliding windo w cepstrum analysis [ 19 ]. Secondly , the heart rate was computed using a Bayesian fusion approach, in which three estimators were calculated from each sensor channel such as adapti ve-windo w autocorrelation, adaptive-windo w average magnitude difference function, and maximum amplitude pairs. For each channel, these three estimator outputs were then combined using a Bayesian fusion method to obtain an o verall estimate. In other words, Bayesian fusion approach was applied to 24 estimates. At last, the heart was estimated based on the aforementioned approach. Howe ver , for each channel separately . In general, the multichannel based approaches improv ed the rob ustness of heartbeat interval estimation over a single sensor . More specifically , Bayesian-based method slightly outperformed the cepstrum-based method. Martin-Y ebra et al . [ 22 ] extracted heart rate variability indices from ballistocardiogram signals and then ev aluated their correlation with electrocardiogram-derived ones. The ballistocardiogram signals were acquired by a piezoelectric 3D-force plate in supine and standing positions, in a group of 18 healthy subjects (11 females). For each position, the data collection was performed during 5 minutes. Furthermore, subjects were asked to stay quiet to a v oid any motion artif acts. The ballistocardiogram wa v es, i.e., (H, I, J, K) were detected by synchronizing ballistocardiogram signals with ECG signals. Although the proposed approach pro vided a good match with the reference ECG, it is very dif ficult to generalize this approach for real-life deployment as the data collection was conducted for a v ery short time and the detection part was achiev ed by adapting information from the ECG signals. Katz et al . [ 23 ] measured cardiac interbeat intervals using a contact-free piezoelectric sensor placed beneath the mattress under the tested subjects. The data was collected from 25 home sleep recordings of 14 healthy subjects in a two-in- bed setting. The authors applied three algorithms to the collected ballistocardiogram signals as follows. First, interbeat intervals were found by decomposing the signal into multiple components using an empirical mode decomposition filter and then locating the candidate peaks within a localized search area. Second, after locating potential interbeat intervals, a binomial logistic regression model was applied to classify each interbeat interval into one out of three groups based on morphological properties of the ballistocardiogram signal. Finally , an additional algorithm was implemented to get discrete interbeat interval distribution maps during the night recording, considering interbeat interv al data from ov erlapping 15 minutes windows. The preceding three algorithms demonstrated the effecti veness of the proposed system for heart rate variability analysis. Sela et al . [ 24 ] used the same piezoelectric sensor to detect left ventricular ejection for 10 subjects (6 males and 4 females), where the lo wer body of each subject was enclosed in a ne gati ve pressure chamber . The negati ve pressure chamber regulates and controls the blood pressure of the participants. This study demonstrated the ability of the system to identify internal bleeding condition among patients at risk, namely individuals after an accident or surgical operation. REVIEW P APER 5 Alv arado-Serrano et al . [ 25 ] measured beat-to-beat heart rate from subjects sitting in a common office chair . The authors used a piezoelectric sensor fixed to the bottom side of the seat to collect ballistocardiogram signals from seven subjects (5 males and 2 females). Continuous wav elet transform with splines was implemented to detect beat-to-beat intervals in which an optimal scale was selected to reduce noise and mechanical interferences. Thenceforth, learning and decision phases where applied to the selected scale to detect potential J-peaks. In the learning phase, the first four heartbeats in the ballistocardiogram signal were found to define initial thresholds, search windows, and interv al limits. The learned parameters were then utilized to determine the next heartbeat and were readopted after each heartbeat detected to adhere to the heart rate and signal-amplitude changes. A similar study was proposed by Liu et al. [ 26 ]. Howe ver , two PVDF film sensors were installed in the seat cushion and foot insole. Choe and Cho [ 27 ] used a piezoelectric sensor installed between a bed-frame and a mattress for unconstrained mon- itoring of heart rate. The data was collected from 7 male subjects sleeping in a supine sleeping position where the sensor was placed under the subject’ s back. In total, they collected ballistocardiogram signals for about 5 hours from all subjects, in which subjects were not moving during data acquisition. The data was first smoothed using a moving mean absolute deviation, then the J-peaks were detected within a specific search region using an adaptive thresholding technique. The authors achie ved satisfactory results with the reference ECG. Howe ver , this method may not be applicable in real-life applications because the data was not collected in a typical sleep sitting and the motion artifacts were not considered as well. T able II summarizes the unconstrained monitoring of vital signs using the PVDF-based sensors. I I I . E L E C T RO M E C H A N I C A L F I L M - B A S E D S E N S O R S The electromechanical film (EMFi) material is a plastic film that can transform mechanical energy into an electrical signal and the other way around. Basically , it is a flexible and thin bi-axially oriented polypropylene film covered with electrically conducti ve layers, which are enduringly polarized. EMFi has a static charge reaching hundreds of V olts. When a pressure is applied to the film, a charge is created on its electrically conducti ve surf aces and this char ge can be measured as a current or voltage signal, usually with a char ge amplifier . As a result, the EMFi serves as a sensitiv e motion sensor [ 28 ]. Alametsä et al . [ 28 ] suggested to use EMFi sensors for obtaining ballistocardiogram signals from certain places of the body . The authors installed EMFi sensors in a chair and in smaller pieces in a fe w positions on the body (arm, leg, and chest). The ballistocardiogram signals were collected from a few people and the duration of the recordings was relativ ely short. This study demonstrated the potential of the EMFi material in monitoring the changes in cardiac function. In another study , K oi vistoinen et al . [ 29 ] ev aluated the ability of the EMFi sensors for measuring ballistocardiogram signals. The authors installed two EMFi sensors in the seat and backrest of a normal chair , and the data was collected from two young subjects (1 male and 1 female) for 5 minutes. After visual inspection v ersus the reference ECG, it w as found that the acquired waveforms closely simulate those reported in the literature. Equi v alent results were also reported by Junnila et al . [ 30 ], [ 31 ], which presented the suitability of the EMFi sensors for extracting ballistocardiogram signals. A smart mattress was dev eloped by Koi vistoinen et al [ 32 ] to detect interbeat intervals in a nonintrusi ve way from six male subjects. The mattress consisted of 160 EMFi electrodes distributed throughout the mattress that enabled signal acquisitions from multiple locations. T wo methods were implemented to detect interbeat interv als, i.e., a pulse method and an adaptive window cepstrum method. In the former , signals from all channel were high pass filtered and then squared. After that, these squared values were averaged between all channels and low-pass filtered the result. At last, the beginning of each heart rate was tracked in the generate pulse train signal. In the latter , the windo w length of the cepstrum was selected using the pulse method as the first estimator of the heart beats. Then, signals from all channels were av eraged in the frequency domain. An interpolation was used to detect more accurate location for the selected cepstrum maximum v alue. Moreover , the motion artif acts were eliminated based on the signal variance using a sliding time window . Although the cepstrum-based method pro vided better results than the pulse method, its computational ef ficiency w as not as good as the adaptiv e window method. Aubert et al . [ 33 ] adopted a single EMFi sensor to provide heart rate, breathing, and an activity inde x representing body mov ements. The recommended system was v alidated utilizing data collected from 160 subjects (58 males and 102 females) for a total of 740 hours. Part of the data was collected in a sleep laboratory from patients (i.e., sleep apnea, insomnia, and other sleep disorders) who underwent a full polysomnography and the other part was collected at home from healthy subjects. Body mov ements were first isolated from the sensor data based on the signal amplitudes and energy , and their time deri v ati ves. Thereafter , heart rate was measured using a sliding window autocorrelation method, in which the optimal window length had to span 3 to 5 consecutiv e beats. The respiratory rate was estimated based on the local peaks, troughs, and zero-crossings, constrained to rules ensuring ph ysiological v alidity in terms of duration and amplitude. Across the 60 subjects, the vital signs were computed o ver epochs of 30 seconds and the av erage v alues were computed and compared to the reference ECG and thorax belt, respecti v ely . The recommended system achie ved satisfying results compared to the reference de vices. Kärki and Lekkala [ 34 ] used EMFi and PVDF sensors in the measurements of heart rate and respiration. The objecti ve of the study was to determine if there were dif ferences between the results of both sensors. ECG was used as a reference for heart rate and a thermistor for respiration rate. Heart rate and respiration were measured using po wer spectral density (PSD). The two sensors were embedded inside a textile pocket and the pocket itself was integrated into clothing. They were positioned underneath a commercial heart rate belt on the left side of the sternum. Preliminary results sho wed that both sensors provided reliable results in the measurements of heart and respiration REVIEW P APER 6 T ABLE II S U MM A RY O F UN C O NS T R A IN E D M O NI T OR I N G O F V I TAL S I G NS U S I N G P V D F - B A SE D S E NS O R S . WT : W AVE L E T TR A N SF O R M , N/A : N OT A V A I L AB L E , P . Infants : P R E MAT UR E I N FAN T S , M : M A LE , F : F E M A LE , HR : H E ART R A T E , HRV : H E A RT R ATE V A RI A B I LI T Y , RR : R E SP I R A T O RY RAT E , A CF : AU TO C OR R E L A T I O N FU N C TI O N , Min : M I N U TE S , Hrs : H O U R S , Sec : S E C ON D S , CLC : C OM P L ET E - L IN K AG E C L US T E R IN G , TM : T E MP L A T E M ATC H I N G , FREQ : F R E QU E N CY , CEP : C E P S TR UM , PCA : P R IN C I P A L CO M P O NE N T A NA L Y S I S , MAP : M A X I MU M A M PL I T U DE PA IR S , AMDF : A DA P T IV E - W IN D OW A V ER AG E M AG N I TU D E D IFF E R E NC E F U NC T I O N , ECG Sync : E L E CT R OC A R DI O G R AM S Y N CH R ON I Z A T I O N , EMD : E M P IR I C A L M O D E D EC O M PO S I T IO N , TH : T HR E S H OL D , CWT : C O N TI N U OU S W A V E L ET T R A NS F O R M , Lab : L A B OR ATO RY . Method Subjects (M, F) Deployment Duration Outcome [11] WT N/A Lab N/A HR, RR [12] WT 5 P . Infants (2 M and 3 F) Hospital 10 Min HR, RR [13] A CF 13 M Home 10 Min, 2 Hrs HR, RR [14] CLC 3 N/A Lab 330 Min HR [15] CLC, TM 40 N/A Sleep clinic Overnight HR, RR [16] CLC, TM 60 N/A Sleep clinic, home Overnight HR [17] WT 5 N/A Lab 2 Hrs HR, RR [18] FREQ 21 N/A Wheelchair 5 Min HR [19] CEP , PCA 6 N/A, 15 M, 13 F Hospital Overnight HR, RR [20] PCA 15 M, 13 F Hospital Overnight Apneas [21] A CF , MAP , AMDF 15 M, 13 F Hospital Overnight HR [22] ECG Sync 17 M, 11 F Lab 5 Min HR V [23] EMD 14 N/A Home Ov ernight HR [24] N/A 6 M, 4 F Lab 84 Min L VET [25] CWT 5M, 2 F Chair 100 Sec HR [26] Adaptiv e TH 7 M Lab 45 Min HR [27] CWT 6 N/A Lab 67 Min HR REVIEW P APER 7 rates. Ho we ver , the PSD was not rob ust enough because the peak in the spectrum might get wider and multiple peaks might ha ve appeared. Another study was proposed by Kärki and Lekkala [ 35 ] to determine heart rate with EMFi and PVDF materials. The EMFi and PVDF sensors were grouped together to a form a single structure. The data was collected from 10 subjects (5 males and 5 females) ov er 60 seconds recording (sitting and supine positions), where the sensor structure was placed under the legs of a chair and bed. These preliminary results demonstrated that the heart rate can be measured at home just by sitting on a chair or lying in a bed. Pinheiro et al . [ 36 ] introduced a lo w-cost system to measure blood pressure v ariability and heart rate v ariability . A single EMFi sensor was installed in the seat of a normal office chair to measure ballistocardiogram signals while a finger PPG was used to estimate arterial oxygen saturation (SpO2). For validation, ECG was acquired using three chest leads. Using LabVIEW , heart rate and heart rate variability were determined by an adapti ve peak detection algorithm. The pulse arri v al time was estimated as the time dif ference between ECG and PPG maximum peaks, and when considering BCG-PPG relation, the I-valley (Fig. 1(a)) was the reference. The designed system was appraised using data collected from five healthy volunteers ov er 10 minutes recording. The preliminary study demonstrated that heart rate v ariability can be measured using the correlation between BCG and PPG. The PSD w as e xploited to measure the heart rate. In another study , Pinheiro et al . [ 37 ] collected ballistocardiogram signals by placing an EMFi sensor in the backrest of a wheelchair’ s, beneath the lining. T wo modulation- based schemes were carried out for heart estimation, i.e., a sliding power window and an all-peak detector . The objectiv e was to find all local maxima and local minima, then a spline interpolation and a mo ving po wer windo w were employed to compute a modulating signal. At last, a fast Fourier transform was applied to the output of each method in order to measure the a v erage heart rate from the signal’ s fundamental frequency . This system was e v aluated using data gathered from six normal subjects (4 males and 2 females) during 125 seconds. Brüser et al. [ 38 ] proposed an unsupervised approach to determine inter-beat intervals using an EMFi sensor . The sensor was fixed underside of a thin foam overlay which was thus located on top of the mattress of a typical bed. The system was ev aluated on over -night recordings from 33 indi viduals (14 males and 19 females). Three estimators were implemented, namely autocorrelation function, av erage magnitude difference function, Maximum amplitude pairs in order to compute the local interval length using a sliding time windo w . Ideally , this window contained two ev ents of interest. The values of the local interv al length were constrained by two thresholds, i.e., T min and T max . The body movements were detected based on the maximum amplitude range of each time-window . The information from the three estimators was then applied to a probabilistic Bayesian method to estimate the inter-beat intervals in a continuous manner . Although the proposed method achie ved v ery satisfactory results, the main limitation existed in the implicit hypothesis that tw o successive heart beats in the BCG ha ve an unknown but similar morphology . This assumption may not alw ays hold true. In the same way , Zink et al . [ 39 ] used an EMFi sensor to detect heartbeat c ycle length in patients suf fered from atrial fibrillation and sinus rhythm. The sensor was placed under the bed-sheet and data was collected from 22 patients (15 M, 7 F) during and after cardiov ersion. Cardiov ersion is a medical procedure that returns a normal heart rhythm in people with certain types of abnormal heartbeats, namely arrhythmias. In another study , Zink et al . [ 40 ] employed the EMFi sensor to measure heartbeat in patients suffered from sleep-disordered breathing. T wenty-one patients (19 males, 2 females) were recruited for the study and underwent a standard full-night polysomnography . A quality-index was proposed based on the three estimators previously discussed in [ 38 ] that allo wed to identify segments with artifacts and to automatically exclude them from the analysis. The proposed system provided good correlation of beat-to-beat cycle length detection with simultaneously recorded ECG. Pino et al . [ 41 ] used two EMFi sensors installed in the seat and backrest of a normal chair in order to measure heart rate. Ballistocardiogram data were collected from 54 individuals, whereas 19 of them were measured in a laboratory (1 minute) and the rest in a hospital waiting room (2 minutes). Firstly , empirical mode decomposition and wavelet analysis were (Deabuchie 6) implemented to reconstruct ballistocardiogram signal. Secondly , the J-peaks of the ballistocardiogram signal was detected using a length transform analysis. The body mov ements were eliminated using a moving time window . Then, for each time-window two thresholds were computed, i.e., T1 = ( max + min ) / 2 and T2 = mean + 1 . 1 ∗ std , if T1 was greater than T2 , the current window was marked as a body mov ement. The w av elet analysis w as preferred to reconstruct the signal as it produced a higher effecti ve measurement time. A similar approach was also proposed by Pino et al . [ 42 ]. Howe ver , they increased the size of the dataset to 114 people. Of those, 21 were gathered in a school (2 minutes), 42 in homes (2 minutes), and 51 in a hospital waiting area. It is difficult to assess the robustness of this system because the data was collected in a very short time and in a controlled en vironment as well. In a recent study , Alametsä and V iik [ 43 ] presented the stability of ballistocardiogram signal during 12 years’ time, on which the data was gathered from a single person in a sitting position using EMFi sensors. Several other signals were recorded as well such as ECG, ankle pulse signal, and the carotid pulse signal from the neck near the carotid artery . All measurements lasted about 2 to 3 minutes with a sampling frequency of 500 Hz. In a conclusion, ballistocardiogram research may be recommended for examining long-term changes in heart operation and to re veal v ariations in it. T able III summarizes the unconstrained monitoring of vital signs using the EMFi-based sensors. I V . P N E U M A T I C - B A S E D S E N S O R S The idea of the pneumatic system is to deploy a thin air- sealed cushion between the bed and mattress. Thereafter , when a person rests in the bed, the forces originated because of the heartbeat, respiration, snoring and body mov ements af fects REVIEW P APER 8 T ABLE III S U MM A RY O F UN C O NS T R A IN E D M ON I T OR I N G OF V I TAL S I G NS U S I NG E M F I - B AS E D S EN S O R S . WT : W A V EL E T T R AN S F OR M , N/A : N OT A V A I L A BL E , M : M A L E , F : F EM A L E , HR : H E A RT R A T E , RR : R E S PI R A TO RY R A T E , ACF : AU T O CO R R E LATI O N F U NC T I O N , Min : M I N UT E S , Hrs : H O U R S , Sec : S E C ON D S , CEP : C E P ST RU M , MAP : M A X IM U M A M P L IT U D E PA IR S , AMDF : A DA P T I VE - W I ND OW A V E RA GE M AG N I T UD E D I FFE R E N CE F U NC T I O N , EMD : E M PI R I C AL M O D E D E CO M P O SI T I O N , TH : T H R ES H O L D , LT : L I N E AR T R A NS F O R M , Lab : L A B OR ATO RY . Method Subjects (M, F) Deployment Duration Outcome [32] V isually 1 M, 1 F Lab 5 Min BCG [32] CEP 6 M Lab Ov ernight HR [33] Adaptiv e TH, ACF 58 M, 102 F sleep Lab, Home Overnight HR, RR [34] PSD N/A Lab 60 Sec HR, RR [35] PSD 5 M, 5 F Lab 30 Sec HR, RR [36] PSD 5 N/A Lab 10 Min HR, BP [37] PSD 4 M, 2 F Lab 125 Sec HR [38] A CF , MAP , AMDF 14 M, 19 F Clinic Overnight HR [39] A CF , MAP , AMDF 15 M, 7 F Hospital N/A HR V [40] A CF , MAP , AMDF 19 M, 2 F Hospital Overnight HR [41] EMD, W A, L T 54 N/A Lab, Hospital 1 Min, 2 Min HR [42] EMD, W A, L T 114 N/A Home, Hospital 2 Min, 2 Min HR REVIEW P APER 9 the air in the cushion through the mattress. This slight human mov ement causes a pressure and therefore variations in pressure are measured by a supersensiti ve pressure sensor [44], [45]. W atanabe et al . [ 46 ] used the aforementioned pneumatic system to measure heartbeat, respiration, snoring, and body mov ements in a nonin vasi ve manner . The three bio-signals, namely heartbeat, respiration, and snoring were detected using a band-pass filter with different cutof f frequencies. Following, windowed Fast Fourier transform algorithm was applied to measure heart rate and respiration. Howe ver , the relati ve magnitude of snoring was calculated by the standard deviation of the filtered snoring signal and the relati ve magnitude of body mov ements w as calculated as the standard deviation of the en velope of the sensor output signal. The authors validated the proposed system using data collected from 15 subjects (12 males and 3 females) over 15 nights. Preliminary results sho wed good agreement against reference de vices, namely ECG, belt-type respirometer , and a snoring detection microphone. The body mov ements were identified and recorded by a CCD camera. In another study , Kurihara and W atanabe [ 47 ] acquired data from 10 subjects (20 seconds each) to measure heart rate and respiration. In this study , a condenser microphone was used as a reference for heart rate, respiration and signal-to-noise ratio. V alidation results demonstrated that the pneumatic system was more susceptible to en vironmental noise, for example, opening and closing the door than the reference condenser microphone. Chee et al . [ 48 ], [ 49 ] recommended to use a balancing tube between two air cells to improve the effecti veness of posture changes during data collection. Balancing tube with a high air resistance aimed at equalizing the pressure of each air cell within a certain time constant. More precisely , it performed the role of a high-pass filter to eliminate body motion. The air -mattress system consisted of 19 air cells, in which measurements can be performed between any pair of cells. Ho we ver , the authors collected data from the two cells situated on the backside of the chest and abdominal region. Signal was collected from a single subject laying on the air mattress where ECG and nasal airflow signal were collected simultaneously . Although the balancing tube helped eliminate body motion, it affected the sensitivity of the measurement. Heart rate was measured by finding the maximum peak of the BCG signal between the two R-R peaks of the ECG signal. On the other hand, the respiratory rate was measured by windowed fast Fourier transform, i.e., short-time Fourier transform (STFT). Preliminary results showed good match against reference devices. Ne v ertheless, the proposed system might not be a preferred choice for lar ge-scale deployment due to its complexity . In another study , Shin et al . [ 50 ] applied the same air mattress for uncontaminated measurement of heart rate and respiration. In which, a total of 13 healthy male subjects were in v olved in the validation study , i.e., four hours study . The authors measured the heart rate from the R-peaks of the ECG, while the respiratory rate was measured manually . In addition, the authors asked three subjects to simulate sleep apnea (breath-holding) fi ve times each for 10 to 15 seconds. Thereafter , the apneas were detected based on the v ariance of the respiratory signal with a moving windo w technique. T able IV summarizes the unconstrained monitoring of vital signs using the pneumatic-based sensors. V . S T R A I N G AU G E S - B A S E D S E N S O R S Brink et al . [ 51 ] implemented four force sensors under bed- frames to unobtrusi vely record heartbeat, respiration activity , and body mov ements. Each force sensor consisted of a reflex light barrier sandwiched between two aluminum plates. When a force is applied to the sensor, the two aluminum plates are squeezed together slightly and the distance between them decreases. The reflex light barrier senses the distance between the two plates and con verts it into a v oltage signal, which is analogous to the ballistic forces of the heart. This voltage signal is then pre-amplified and passed through a low-pass filter to eliminate ripple and noise. In this preliminary study , heartbeat and respiration were detected by finding local minima or maxima in the signal within a sliding windo w . T o ev aluate the robustness of the force sensors, the signals were acquired from four subjects (2 males and 2 females) and in different conditions, i.e., three types of single beds, three types of frames, two types of mattresses. In total, se venty-two conditions were ev aluated. In each condition, subjects were asked to sleep in a relaxed supine position on the bed. The signals were collected during 5-minute recording from the four force sensors. Additionally , ECG signals were also collected as a reference. Preliminary results showed that the proposed system can be an acceptable tool for computerized and unattended sleep-data collection ov er a lengthy period. Inan et al . [ 52 ] collected ballistocardiogram signals using strain gauges within a modified commercial scale. The signals were collected from twenty-one subjects (11 males and 10 females), on which participants were asked to stand as quiet as possible on the scale for 45 seconds while BCG and ECG were concurrently recorded. In this study , the measured ballistocardiogram signals from all subjects closely resemble those reported in the literature. Besides, the system was able to provide beat-to-beat cardiac output monitoring. Additionally , ballistocardiogram measurements were found to be repeatable ov er 50 recordings collected from the same subject over a three- week period. The proposed solution was more susceptible to motion artifacts because the signals were acquired in a standing position. Hence, it might not be suitable for older adults who cannot stand as tranquil on the scale. In order to eliminate floor vibrations, Inan et al . [ 53 ] proposed a seismic sensor , i.e., geophone, located in proximity to the modified scale that served as the noise reference. An adapti ve algorithm was then implemented to filter the output of this sensor and cancel the vibrations from the measured ballistocardiogram signal. Signals were collected from a healthy volunteer while another person stomped around the scale, hence producing increased floor vibrations. Furthermore, signals were also collected from another volunteer standing inside a parked bus while the engine was functioning. This research established that ballisto- cardiogram recording is feasible in almost all en vironments, including ambulances and other transport vehicles, as long as the vibrations are not so significant to rail the electronics or lead to a distorted version of the ballistocardiogram force to be coupled to the scale. REVIEW P APER 10 T ABLE IV S U MM A RY O F U N C ON S T RA I N E D M O NI T O RI N G O F V I T A L S I G NS U S I NG P N E U MAT IC - BA S E D S E NS O R S . N/A : N O T A V A IL A B L E , M : M A L E , F : F E M A LE , HR : H E A RT R A T E , RR : R E S P IR A TO RY R A T E , Min : M I N U TE S , Hrs : H O UR S , Sec : S E C ON D S , STFT : S H O RT - TI M E F O U R IE R T R AN S F O RM , Lab : L A B O RATO RY . Method Subjects (M, F) Deployment Duration Outcome [46] STFT 12 M, 3 F Lab Ov ernight HR, RR, SI [47] STFT 10 N/A Lab 20 Sec HR, RR [48], [49] ECG Sync, STFT 1 N/A Lab N/A HR, RR [50] ECG Sync, STFT 13 M Lab 4 Hrs HR, RR REVIEW P APER 11 In the same way , Inan et al . [ 54 ] ev aluated the elec- tromyogram signal collected from the feet of the subject during ballistocardiogram recording as a noise reference for standing ballistocardiogram measurements. As the lo wer -body electromyogram signal can be collected directly from the footpad of the modified scale, the proposed system is self- contained and can automatically eliminate motion artifacts. In another study , W iard et al. [ 55 ] used a motion sensor instead of electromyogram sensors to record body motions and to serve as a noise reference. The added value of the motion sensor was to provide a minimum delay between the motion-related noise in the measured signal and the noise detected by the motion sensor . This minimum delay provided the time resolution needed to flag single heartbeat e vents, hence maximizing the refinement of the approach. Brüser et al . [ 56 ] introduced an unsupervised learning approach to measuring heartbeat in a noninv asive manner . Ballistocardiogram signals were recorded by strain gauges in a Wheatstone bridge configuration attached to the slat under the mattress of a hospital bed. A high-pass filter was applied to the raw data in order to remove low-frequenc y respiratory components. Next, a set of features, representing the fundamental morphology of the heartbeat, were extracted from a 30-second time segment. Afterward, the principal component analysis was applied in order to reduce the dimensionality of the feature vectors. Additionally , a k-means clustering algorithm was adopted to identify clusters of feature vectors. This training step resulted in a list of estimated heartbeat locations. The parameters obtained during the training step were thus manip- ulated to locate heartbeats in the remaining ballistocardiogram signal by merging the results of three independent indicator functions, i.e., cross-correlation, Euclidean distance, and heart valv e signal. Finally , the estimated heartbeat locations were exploited to provide an improv ed list of beat-to-beat periods. Signals were captured from sixteen healthy subjects (9 males and 7 females) during thirty minutes switching their positions ev ery 7.5 minutes (left lateral, supine, right lateral, prone). This method produced good agreement with the reference ECG. Ho wever , the primary limitation was the training step as it had to be repeated whene v er subjects enter the bed or adjust their posture with re gard to the ballistocardiogram sensor . Nukaya et al . [ 57 ] pro vided a contact-free method for unob- trusi ve measuring of heartbeat, respiration, body mo v ement, and position change. The authors collected the pressure data using four piezoceramics transducers set beneath bed supports. The proposed system was able to detect previous bio-signals without the need for a preamplifier , accordingly without any v oltage source. This is because the sensing de vices were distortion sensors that operate without an electrical power supply , i.e., they produce v oltage according to the time derivati ve of the distortion. V ehkaoja et al . [ 58 ] introduced dynamic pressure sensors for detecting heartbeat intervals of an individual sleeping on a bed. The pressure sensors were composed of EMFi material and located under the bed supports. In this study , indi vidual heartbeats were not observed. Howe ver , the intervals in which the correlation between two successive signals segment maximized. Ballistocardiogram signals were collected from nine subjects (5 males, 4 females) during 1-hour recording. The beat-to-beat intervals provided by this approach can be adopted in determining frequency domain heart rate variability that is most frequently used in the assessment of sleep quality . Lee [ 59 ] et al . proposed to use load cells, installed under bed supports, to measure heart rate and respiration for infants. Four infants (5 to 42 months) were in volv ed in the study and a total of 13 experiments were carried out between 10 to 178.8 minutes. Initially , heart rate and respiratory components were extracted using band-pass filters of various cutof f frequencies. For the heart rate component, a first-order dif ferentiation filter was applied, thus a nonlinear transformation, i.e., a Shannon entropy was applied to the dif ferentiated signal to obtain only positi ve peaks. Additionally , a moving a verage filter was emplo yed to flatten out the spikes and noise b ursts. At last, heart rate was measured by finding local peaks in an optimum signal. For the respiration component, as the band-pass filtered signal contained residual baseline drift, a detrending algorithm based on empirical mode decomposition was adopted to get rid of such unwanted trend. Similar to heart rate, local peaks were detected in the detrended signal and therefore the respiratory rate was measured. A signal quality index was developed to choose the optimum signal out of the four load cells’ signals. The quality processing procedure was dev eloped based on calculating a threshold value computed from an autocorrelation function and a po wer spectral density function. The proposed system achiev ed acceptable results compared to the reference ECG and respiratory belt. T able V summarizes the unconstrained monitoring of vital signs using the strain gauges-based sensors. V I . H Y D R AU L I C - B A S E D S E N S O R S The concept of the hydraulic sensor is to measure the change in pressure applied to a liquid-filled tube. For e xample, Heise et al . [ 60 ] designed a hydraulic based-sensor for unrestrained monitoring of heart rate and respiration. Preliminary data were collected from two indi viduals (1 male and 1 female). Participants were instructed to lie on a bed for approximately 10 minutes. During the 10 minutes, they were asked to lie on the back, on the right side, on the back again, on the left side, and on the back once more (2 minutes each position). In this preliminary research, heartbeat signal was e xtracted by detecting the difference between the most negativ e and the most positi v e points within a moving windo w . After that, a low-pass filtered w as applied to reduce the effect of noise and smooth the signal. A fix ed threshold was emplo yed to detect a body motion. Finally , the heart rate was measured by adopting the autocorrelation function. Ho wever , the respiratory rate was measured by low-pass filtering the signal and then subtracting the DC bias. Afterward, the zero-crossings were counted to provide the breaths per minute. Preliminary results approv ed that the hydroponic sensor w as effecti ve at extracting heart rate and respiration ag ainst the reference devices, namely a piezoresistiv e device worn on the subject’ s finger and respiration band wrapped around the subject’ s torso. In a different study , Heise et al . [ 61 ] have v alidated the sensor using data collected from fi ve subjects (3 males and 2 females) REVIEW P APER 12 T ABLE V S U MM A RY O F U N C ON S T RA I N E D M O NI T O RI N G O F V I T A L S I G NS U S I NG P N E U MAT IC - BA S E D S E NS O R S . N/A : N O T A V A IL A B L E , M : M A L E , F : F E M A LE , HR : H E A RT R A T E , RR : R E S P IR A TO RY R A T E , Min : M I N U TE S , Hrs : H O UR S , Sec : S E C ON D S , SWM/M : S L ID I N G W I N DO W M I NI M U M / M A X I MU M , ECG Sync : E L E CT RO C A R DI O G R AM S Y N CH RO N I Z A T I O N , PCA : P R I NC I PAL C O M PO N E N T A N ALY SI S , CCF : C RO S S - CO R R EL ATI O N F U NC T I O N , ED : E U C LI D E AN D I S T A NC E , HVS : H E A RT V A LV E S I G NA L , ACF : AU T O CO R R E LAT IO N F U N C TI O N , SE : S H A N NO N E N TR OP Y , EMD : E M P IR I C A L M O D E D E C OM P O S IT I O N , Lab : L A B OR ATO RY . Method Subjects (M, F) Deployment Duration Outcome [51] SWM/M 2 M, 2 F Lab 5 Min HR, RR [52] ECG Sync 11 M, 10 F Lab 45 Sec HR [56] PCA, K-means CCF , ED, HVS 9 M, 7 F Lab 30 Min HR [58] A CF 5 M, 4 F Lab 1 Hrs HR [59] SE, EMD, SWM/M Infants (3 M, 1 F) Home 10 - 178.8 Min HR, RR REVIEW P APER 13 and have confirmed stability of the signal processing algorithms using real and synthesized signals. Rosales et al . [ 62 ] deployed four hydraulic transducers under the bed mattress, covering the upper part of the body in order to measure heart rate in a nonrestricti ve w ay . Each transducer was connected to a pressure sensor to record the pressure forces applied to it. In this preliminary study , heartbeats were computed using a clustering-based approach as follows. Every fiv e seconds, body motions were eliminated based on the variance of the transducers’ signal. F ollo wing body motions remov al, the transducer’ s signal w as band-pass filtered to remov e respiratory components and filtered once more using an average filter to smooth the signal prior to feature extraction. Afterward, three features were extracted from e very 5-second time window based on the IJK points of the ballistocardiogram signal. In addition, the e xtracted features were classified into two groups using k-means clustering algorithm. The first group, i.e., the smallest cluster was assigned to the heartbeat class. Then, the second group, i.e., the largest cluster was assigned to the non-heartbeat group. In conclusion, the heartbeats’ (J- peaks) locations were compared to a reference signal obtained from a piezoresisti ve de vice worn on the subject’ s finger . Data were acquired from four subjects (2 males and 2 females) during 6 minutes (supine position). Although such clustering- based approach might hav e provided good results it might only be applicable to specific situations. Furthermore, to think the presented method to be applied in practical applications, manually labeling (training) data is, howe v er , a restricting property . A similar study was proposed by Su et al . [ 63 ]. Nonetheless, the heart rate was measured using the Hilbert transform and the fast Fourier transform (30-second windo w). In this study , ballistocardiogram signals were acquired from fiv e subjects (3 males and 2 females) during 2.5 minutes in a supine position. This approach provided a lower error rate compared with the windowed peak to peak de viation (WPPD) method introduced by Heise et al . [ 60 ]. Although results were consistent with the reference device, ballistocardiogram signals were assumed relati vely stationary . This assumption is not always true because typically heartbeats are not uniform in time [64]. In another study , L ydon et al . [ 65 ] proposed a new algorithm to detect heart rate using the four hydraulic transducers. As a first step, a band-pass filter was implemented to remove the respiration component as well as high-frequency noise. Next, the data from the four transducers were separated into 0.3-second (30 samples) segments and the short-time energy profiles were computed for each segment. As a result, four hear rate values were generated for each transducer by locating the local peaks. Moreo ver , a single heart rate value w as selected based on the DC lev el of each transducer’ s signal. T ypically , a higher DC lev el in the obtained transducer’ s signal means that the transducer makes better contact with the body and therefore gi v es a more stable ballistocardiogram signal. Hence, the transducer with the highest DC le vel was chosen for heart rate measurement. Finally , outliers were eliminated by following whether the estimated heart rate value was more than 15 beats per minute from the moving a verage heart rate v alue. V alidation data were collected from two groups, i.e, three subjects (2 males and 1 female) during 10 minutes recording and four older adults (4 males) in a typical home environment. This approach provided slightly better results compared to the clustering-based approach provided by Rosales et al . [62]. In order to address the uncertainty inherent in a ballistocar - diogram signal, for instance, misalignment between training data and ground truth, improper collection of the heartbeat by some transducers, Jiao et al . [ 66 ] applied the Extended Function of Multiple Instances (eFUMI) algorithm to ballistocardiogram signals generated by the four hydraulic transducers. The objectiv e of the eFUMI was to learn a personalized concept of heartbeat for a subject in addition to se veral non-heartbeat background concepts. Follo wing the learning step, heartbeat detection and heart rate estimation can be applied to test data. The limitation of this algorithm is the need for suf ficient training data, which might not be al ways a v ailable. Rosales et al . [ 67 ] applied the clustering-based approach [ 62 ] and the Hilbert transform approach [ 63 ] to ballistocardiogram signal collected from four male senior residents. The signals were collected from residents over a two to four months period under in-home li ving conditions. Howe ver , the analysis was done only ov er fi ve minutes of initial recordings. The Hilbert transform approach was able to produce more stable heart rate estimates compared to the clustering-based approach. The latter approach was more susceptible to motion artifacts. T able VI summarizes the unconstrained monitoring of vital signs using the hydraulic-based sensors. V I I . F I B E R O P T I C - B A S E D S E N S O R S In existing literature, unobtrusiv e vital signs monitoring is achiev ed either by microbend fiber-optic sensors (MFOS) or fiber Bragg grating sensors (FBGS). The principle of the MFOS is that if an optical fiber is bent, insignificant amounts of light are lost through the fiber walls. This reduces the amount of receiv ed light and is a function of bend pressure [ 68 ], [ 69 ], [ 70 ], [ 71 ]. The FBG is an optical fiber that serves as a filter for a specific wavelength of light. The principle of the FBGS is to detect the reflected Bragg wav elength shift o wing to changes in temperature, strain, or pressure [ 72 ], [ 73 ]. Fiber Bragg gratings are commonly used optical fiber sensors for measuring temperature and/or mechanical strain. Though, the excessi ve cost of the interrogation systems is the most significant obstacle for their lar ge commercial application [ 74 ]. Chen et al . [ 75 ], [ 76 ] described the ef fecti veness of the MFOS for nonintrusiv e monitoring of heart rate and breathing rate. For heart rate, ballistocardiogram signals were g athered from se veral subjects in sitting position and breathing normally . Preliminary results ha ve proved that the ballistocardiogram wa veforms closely simulated those reported in the existing literature. For breathing rate, nine v olunteers were in volved in the study in which respiratory signals were collected during sleep. The system has shown a good match with the reference respiratory device. Deepu et al . [ 77 ] introduced a smart cushion integrated with MFOS for real-time heart rate monitoring. The cushion can be placed on the seat or back of a chair for data collection. In this study , fiv e subjects were in volv ed, and signals were collected during 5-minutes. Sev eral steps were applied REVIEW P APER 14 T ABLE VI S U MM A RY O F U N CO N S T RA I N ED M O N I TO R I NG O F V I TAL S I G NS U S I NG H Y D R AUL I C - BA S ED S E N SO R S . N/A : N OT A V A I L AB L E , M : M A LE , F : F E M AL E , HR : H E ART R ATE , RR : R E S PI R A TO RY R A T E , Min : M I N UT E S , Hrs : H O UR S , Sec : S E C ON D S , WPPD : W I N D OW ED P E A K T O P E AK D E V I A T I O N , CA : C L U ST E R IN G A P PR OAC H : HT : H I L BE RT T R A NS F O RM , STE : S H O RT - TI M E E N E R GY , eFUMI : E X T EN D E D F U N CT I O N O F M U L T I PL E I N STA N CE S , Lab : L A BO R A T ORY . Method Subjects (M, F) Deployment Duration Outcome [60] WPPD 1 M, 1 F Lab 10 Min HR, RR [61] WPPD 3 M, 2 F Lab 10 Min HR, RR [62] CA 2 M, 2 F Lab 6 Min HR [63] HT 3 M, 2 F Lab 2.5 Min HR [65] STE 2 M, 1F 4M Lab Home 10 Min Overnight HR HR [66] eFUMI 4 N/A Lab 10 Min HR [67] CA, HT 4 M Home Ov ernight HR REVIEW P APER 15 to the cushion’ s signals in order to unobtrusiv ely measure the heart rate. Initially , low and high-frequency noises were suppressed using a band-pass finite impulse response (FIR) filter . Next, a cubing operation was applied to the filtered signal to enhance the amplitude swing while keeping the signal sign intact. Afterward, momentary upswing or do wnswing was remov ed by applying a moving a v erage filter . Furthermore, the resultant signal was smoothed by utilizing the absolute value and averaging over a predefined time windo w . At last, the J-peaks were recognized by using a cone detection and comparing to an adaptive threshold. The proposed system achiev ed satisfactory results compared to the reference pulse oximetry de vice. Chen et al . [ 78 ] studied the possibility of measuring blood pressure using ballistocardiography and photoplethysmography (PPG). The concept w as to calculate the time delay between the peaks of the ballistocardiography and the corresponding PPG peaks. Ballistocardiogram signals were collected from five healthy subjects in a sitting position using a cushion integrated with MFOS, whereas PPG signals were collected from a finger pulse oximeter . Preliminary results have sho wn that blood pressure might be measured using optical de vices. Ho we v er , the proposed approach was very challenging because it required a calibration procedure for each subject prior to measurement. Lau et al . [ 79 ] ev aluated the effecti veness of the MFOS for respiratory monitoring and respiratory gating in the magnetic resonance imaging (MRI) en vironment. Respiratory gating is the process of reducing cardiorespiratory artifacts by syn- chronizing magnetic resonance data acquisition to the cardiac or respiratory cycles. Unlike electrical sensors, fiber-optic sensors are immune to electromagnetic and radio-frequency interference. T wenty healthy subjects (10 males and 10 females) were in volved in the study and they underwent T2-weighted half-Fourier single-shot turbo spin-echo MRI of the li ver with synchronous breathing rate monitoring on a 1.5 T esla magnetic resonance scanner . The breathing rate was detected by applying a band-pass filter and hence detecting local peaks in the time domain. This study presented that the MFOS were able to detect comparable breathing rate to the reference respiratory bellows and produce li v er MRI images of good diagnostic quality compared to the na vigator -acquired scans. Chen et al . [ 80 ] reported related results using data collected from elev en healthy subjects (6 males and 5 females) during MRI. A similar study was provided by Dziuda et al . [ 81 ]. Howe ver , authors used FBG sensors rather than MFOS. Three healthy volunteers (2 males and 1 female) were included in the study and physiological data were collected during 95 minutes. Both heart rate and breathing rate were measured by finding local maxima after applying band-pass filters of different cutoff frequencies to the sensor data. Similar to the MFOS, the FBG sensor did not introduce any artifacts into MRI images. Furthermore, the system achieved comparable results to the reference de vices, i.e., carbon electrodes and pneumatic bellows, respecti vely . Dziuda et al . [ 82 ], [ 83 ], [ 84 ], [ 85 ] reported similar results using data collected during MRI e xamination. Zhu et al . [ 86 ] demonstrated the effecti veness of the MFOS for unobtrusiv e measurement of heart rate in a headrest position. Three healthy indi viduals were enrolled in the study in which an optical sensor mat was placed on the headrest of a massage chair . The participants were instructed to complete predefined series of tasks, i.e., rest, cognitiv e test battery , and relaxing massage session. In this preliminary study , the analysis was done only during rest periods for a total of six minutes. A band-pass filter was applied to the sensor data to remov e low-frequenc y respiratory signals. Afterward, heart rate was computed using short-time Fourier transform. The proposed system achieved a relativ ely good agreement against the reference ECG. Chen et al . [ 87 ] reported the results of using the MFOS in a clinical trial for unobtrusi ve monitoring of heart rate and respiration during sleep. During the study , data were collected from twenty-two subjects using the optical fiber sensor and also from the standard polysomnography as a reference. In the be ginning, lar ge body movements were eliminated using a moving time window . In which, a segment was identified as a body mo vement if the difference between the maximum and the minimum in the moving window was larger than a fixed threshold. Next, respiratory and heartbeat components were separated from the sensor’ s signals using band-pass filters of different cutoff frequencies. In the former , the signals were smoothed using a moving-a verage filter and hence the baseline was obtained by another moving-av erage filter of a lar ger window size. After subtracting the signals and the baseline, they were further smoothed using Sa vitzky–Golay method. Finally , local peaks were detected, and breathing rate was computed. In the latter , all local peaks of the heartbeat signals were detected, and heart rate was computed accordingly . Consequently , incorrect heart rate values were eliminated by applying a histogram-based method, in which the group with the highest occurrence was selected and reported as final heart rate results. Results were promising. Ho wever , the proposed approach was prone to motion artifacts. Zhu et al . [ 88 ] proposed to measure heart rate using ballistocardiogram signals collected from FBG sensor mat. The sensor mat consisted of three FBG sensor arrays or channels and each array contained six sensors. The arrays were located under the pillow , upper chest, and lower chest. In this study , ten subjects were enrolled, and signals were collected during 20 minutes such as 10 minutes of supine posture and 10 minutes of side ways posture. ECG signals were collected along with the fiber-optic signals as a reference. The signal from each sensor array was transformed from time domain into cepstrum domain. After that, the signal from the six sensors of the same arrays was fused by employing cepstrum. Finally , the heart rate was measured from the fused signal by recognizing peaks in the cepstrum. This study demonstrated that the heart rate can be measured from distinct locations. Howe ver , the best results were achie ved from sensor arrays at chest position. In another study , Zhu et al . [ 89 ] used the same system to compute breathing rate and the system was tested against twelve subjects. Fajkus et al . [ 90 ] introduced to measure heart rate and respi- ration using FBG sensors encapsulated inside a polydimethyl- siloxane polymer (PDMS). The FBG sensors were embedded within a thoracic elastic strap to record cardiorespiratory signals. In this preliminary analysis, the authors collected data from 10 individuals (6 males and 4 females) during few minutes. REVIEW P APER 16 Heart rate and breathing rate were detected by adopting two methods, i.e., identifying the periodic cycles in the time domain and applying the FFT to obtain the dominant frequency . The proposed system achie ved comparable results to the reference ECG. Ho we ver , it w as susceptible to large body mo vements. In another study , Fajkus et al . [ 91 ] assessed the ef fectiveness of using FBG sensor encapsulated inside a PDMS and FBG sensor glued on a plexiglass pad for heart and respiratory rate monitoring. In this preliminary study , the authors collected data from 10 subjects (7 males and 3 females) and result sho wn that the FBG sensor encapsulated into PDMS was more accurate than FBG sensor encapsulated in ple xiglass pad. Chethana et al . [ 92 ] reported the use of FBG sensor for monitoring cardiac and breathing acti vities. Cardiorespiratory signals were collected from four subjects (2 males and 2 females) for 60 seconds, on which the FBG sensor was placed on the pulmonic area on the chest of the subjects. Results hav e been ev aluated against an electronic stethoscope which recognizes and records sound pulses generated from the cardiac activity . Nedoma et al . [ 93 ] e v aluated the ef fecti veness of the FBG sensor against fiber interferometric sensor for heart rate measurement. The former measured the heart rate through ballistocardiography , while the latter measured the heart rate through Phonocardiography . Cardiac signals were obtained from six individuals (3 males and 3 females) using the two sensors for 60 minutes. Primary results hav e sho wn that the fiber interferometric sensor was more accurate than the FBG sensor . T able VII summarizes the unconstrained monitoring of vital signs using the fiber optic-based sensors. V I I I . C O N C L U S I O N This Paper provided the definition and the nomenclature of ballistocardiography . In addition, it discussed in detail the dif ferent modalities reported in e xisting literature for unobtrusiv e monitoring of vital signs, namely heart rate, breathing rate, and body movements. These modalities include piezoelectric polyvinylidene fluoride sensors, electromechanical film sensors, pneumatic sensors, load cells, hydraulic sensors, and fiber-optic sensors. In general, the output of these sensors is a composite signal that is composed of cardiac activities, respiratory acti vities, and body movements. Hence, these three signals should be separated from each other so that vital signs can be measured. The separation process is usually performed by applying a band-pass filter of specific cutoff frequencies according to the signal of interest. In other cases, the separation process can be performed by adopting a decomposition algorithm such as empirical mode decomposition algorithm and wa v elet multiresolution analysis. It should be noted that, vital activities cannot be detected during body movements and hence the y should be eliminated prior to the measurement process. F ollo wing the separation process, i.e., obtaining cardiac signals and respiratory signals, se veral algorithms can then be implemented for vitals measurements. As discussed in previous sections, these algorithms include b ut not limited to simple peak detector , autocorrelation function, fast F ourier transform, cepstrum analysis, wa velet multiresolution analysis, empirical mode decomposition, power spectrum analysis, and clustering- based approaches. The clustering-based approaches are not very ef fecti ve because the training step should be repeated whenever the data collection protocol has been changed. Moreover , the ballistocardiogram morphology varies between and within subjects, and the shape of the signal is highly dependent on subject’ s postures, i.e., sleeping or sitting. Furthermore, the raw signal is noisy and nonstationary due to body movement, induced respiratory ef forts, and the characteristics of the sensing system itself. R E F E R E N C E S [1] E. Pinheiro, O. Postolache, and P . Girão, “Theory and developments in an unobtrusiv e cardiov ascular system representation: ballistocardiography , ” The open biomedical engineering journal , vol. 4, p. 201, 2010. [2] I. Starr, A. Rawson, H. Schroeder, and N. Joseph, “Studies on the estima- tion of cardiac output in man, and of abnormalities in cardiac function, from the heart9s recoil and the blood9s impacts; the ballistocardiogram, ” American Journal of Physiology–Le gacy Content , vol. 127, no. 1, pp. 1–28, 1939. [3] I. Starr and H. A. Schroeder, “Ballistocardiogram. ii. normal standards, abnormalities commonly found in diseases of the heart and circulation, and their significance, ” Journal of Clinical Investigation , vol. 19, no. 3, p. 437, 1940. [4] A. Eblen-Zajjur, “ A simple ballistocardiographic system for a medical cardiovascular physiology course, ” Advances in Physiology Education , v ol. 27, no. 4, pp. 224–229, 2003. [Online]. A vailable: http://advan.physiology .org/content/27/4/224 [5] E. V ogt, D. MacQuarrie, and J. P . Neary , “Using ballistocardiography to measure cardiac performance: a brief review of its history and future significance, ” Clinical Physiology and Functional Imaging , vol. 32, no. 6, pp. 415–420, 2012. [Online]. A v ailable: http://dx.doi.org/10.1111/j.1475- 097X.2012.01150.x [6] L. Giovangrandi, O. T . Inan, R. M. W iard, M. Etemadi, and G. T . A. K ov acs, “Ballistocardiography – a method worth revisiting, ” in 2011 Annual International Conference of the IEEE Engineering in Medicine and Biology Society , Aug 2011, pp. 4279–4282. [7] W . R. Scarborough, S. A. T albot, J. R. Braunstein, M. B. Rappaport, W . Dock, W . Hamilton, J. E. Smith, J. L. Nickerson, and I. Starr, “Pro- posals for ballistocardiographic nomenclature and con ventions: revised and extended, ” Circulation , vol. 14, no. 3, pp. 435–450, 1956. [8] M. Di Rienzo, E. V aini, and P . Lombardi, “ An algorithm for the beat- to-beat assessment of cardiac mechanics during sleep on earth and in microgravity from the seismocardiogram, ” Scientific Reports , vol. 7, no. 1, p. 15634, 2017. [9] O. T . Inan, M. Baran Pouyan, A. Q. Jav aid, S. Dowling, M. Etemadi, A. Dorier, J. A. Heller, A. O. Bicen, S. Roy , T . De Marco, and L. Klein, “Novel wearable seismocardiography and machine learning algorithms can assess clinical status of heart failure patients, ” Cir culation: Heart F ailur e , vol. 11, no. 1, 2018. [Online]. A vailable: http://circheartfailure.ahajournals.org/content/11/1/e004313 [10] Y . Xin, C. Guo, X. Qi, H. Tian, X. Li, Q. Dai, S. W ang, and C. W ang, “W earable and unconstrained systems based on pvdf sensors in physiological signals monitoring: A brief re view , ” F err oelectrics , vol. 500, no. 1, pp. 291–300, 2016. [11] F . W ang, M. T anaka, and S. Chonan, “De velopment of a pvdf piezopolymer sensor for unconstrained in-sleep cardiorespiratory monitoring, ” J ournal of Intelligent Material Systems and Structures , vol. 14, no. 3, pp. 185–190, 2003. [Online]. A vailable: https://doi.org/10.1177/1045389X03014003006 [12] F . W ang, Y . Zou, M. T anaka, T . Matsuda, and S. Chonan, “Unconstrained cardiorespiratory monitor for premature infants, ” International Journal of Applied Electroma gnetics and Mechanics , vol. 25, no. 1-4, pp. 469–475, 2007. [13] K. Niizeki, I. Nishidate, K. Uchida, and M. Kuwahara, “Unconstrained cardiorespiratory and body movement monitoring system for home care, ” Medical and Biological Engineering and Computing , vol. 43, no. 6, pp. 716–724, Nov 2005. [Online]. A vailable: https://doi.org/10.1007/BF02430948 [14] J. Paalasmaa and M. Ranta, “Detecting heartbeats in the ballistocardio- gram with clustering, ” in Pr oceedings of the ICML/UAI/COL T 2008 W orkshop on Machine Learning for Health-Care Applications, Helsinki, F inland , vol. 9, 2008. REVIEW P APER 17 T ABLE VII S U MM A RY O F U N CO N S T RA I N ED M O N I TO R I NG O F V I TAL S I G NS U S I NG H Y D R AUL I C - BA S ED S E N SO R S . N/A : N OT A V A I L AB L E , M : M A LE , F : F E M AL E , HR : H E ART R ATE , RR : R E S PI R A TO RY R A T E , Min : M I N UT E S , Hrs : H O UR S , Sec : S E C ON D S , BP : B L O O D P R E S SU R E , PPG Sync : P H OT OP L E TH Y S M OG R A P HY S Y N CH R ON I Z A T I O N : STFT : S H O RT - TI M E F O U RI E R T R A N SF O R M , CEPS : C E P ST R UM , Lab : L A B OR ATO RY . Method Subjects (M, F) Deployment Duration Outcome [75] [76] V isually V isually N/A 9 N/A Lab Lab N/A N/A HR RR [77] Peak Detector 5 N/A Lab 5 Min HR [78] PPG Sync 5 N/A Lab N/A BR [79] [80] Peak Detector Peak Detector 10 M, 10 F 6 M, 5 F MRI MRI N/A N/A RR HR, RR [81] [82] [83] [84] Peak Detector Peak Detector Peak Detector Peak Detector 2 M, 1 F 8 M, 4 F 1 M 6 M, 2 F MRI MRI MRI MRI 95 Min 60 Min 19 Min 82 Min HR, RR HR, RR HR HR [86] STFT 3 N/A Lab 6 Min HR [87] Peak Detector 22 N/A Hospital Ov ernight HR, RR [88], [89] CEPS 10 N/A Lab 20 Min HR, RR [90] Peak Detector , FFT 6 M, 4 F Lab N/A HR, RR [92] V isually 2 M, 2 F Hospital 1 Min HR, RR [93] Peak Detector 3 M, 3 F Lab 60 Min HR, RR REVIEW P APER 18 [15] J. Paalasmaa, M. W aris, H. T oivonen, L. Leppäkorpi, and M. Partinen, “Unobtrusiv e online monitoring of sleep at home, ” in 2012 Annual International Conference of the IEEE Engineering in Medicine and Biology Society , Aug 2012, pp. 3784–3788. [16] J. Paalasmaa, H. T oiv onen, and M. P artinen, “ Adaptive heartbeat modeling for beat-to-beat heart rate measurement in ballistocardiograms, ” IEEE Journal of Biomedical and Health Informatics , vol. 19, no. 6, pp. 1945– 1952, Nov 2015. [17] W . Chen, X. Zhu, and T . Nemoto, A New Sensory Device and Optimal P osition for Monitoring HR/RR during Sleep . Berlin, Heidelberg: Springer Berlin Heidelberg, 2009, pp. 126–129. [Online]. A vailable: https://doi.org/10.1007/978-3-642-03885-3_36 [18] E. Pinheiro, O. Postolache, and P . Girão, “Study on ballistocardiogram acquisition in a moving wheelchair with embedded sensors, ” Metr ology and Measurement Systems , vol. 19, no. 4, pp. 739–750, 2012. [19] J. M. Kortelainen, M. van Gils, and J. Pärkkä, “Multichannel bed pressure sensor for sleep monitoring, ” in 2012 Computing in Cardiolo gy , Sept 2012, pp. 313–316. [20] G. Guerrero, J. M. Kortelainen, E. Palacios, A. M. Bianchi, G. T achino, M. T enhunen, M. O. Méndez, and M. v an Gils, “Detection of sleep- disordered breating with pressure bed sensor, ” in 2013 35th Annual International Conference of the IEEE Engineering in Medicine and Biology Society (EMBC) , July 2013, pp. 1342–1345. [21] C. Brüser, J. M. K ortelainen, S. W inter , M. T enhunen, J. Pärkkä, and S. Leonhardt, “Improvement of force-sensor -based heart rate estimation using multichannel data fusion, ” IEEE Journal of Biomedical and Health Informatics , vol. 19, no. 1, pp. 227–235, Jan 2015. [22] A. Martín-Y ebra, F . Landreani, C. Casellato, E. Pav an, C. Frigo, P . F . Migeotte, and E. G. Caiani, “Studying heart rate variability from ballistocardiography acquired by force platform: Comparison with con ventional ecg, ” in 2015 Computing in Cardiolo gy Conference (CinC) , Sept 2015, pp. 929–932. [23] Y . Katz, R. Karasik, and Z. Shinar, “Contact-free piezo electric sensor used for real-time analysis of inter beat interval series, ” in 2016 Computing in Cardiology Conference (CinC) , Sept 2016, pp. 769–772. [24] I. Sela, Z. Shinar, and K. T av akolian, “Measuring left ventricular ejection time using under-the-mattress sensor, ” in 2016 Computing in Cardiology Confer ence (CinC) , Sept 2016, pp. 665–668. [25] C. Alvarado-Serrano, P . S. Luna-Lozano, and R. Pallàs- Areny , “ An algorithm for beat-to-beat heart rate detection from the bcg based on the continuous spline wav elet transform, ” Biomedical Signal Pr ocessing and Contr ol , vol. 27, no. Supplement C, pp. 96 – 102, 2016. [Online]. A vailable: http://www .sciencedirect.com/science/article/pii/S1746809416300143 [26] M. Liu, F . Jiang, H. Jiang, S. Y e, and H. Chen, “Low-po wer , nonin v asiv e measurement system for wearable ballistocardiography in sitting and standing positions, ” Computers in Industry , vol. 91, no. Supplement C, pp. 24 – 32, 2017. [Online]. A v ailable: http://www .sciencedirect.com/science/article/pii/S0166361516303074 [27] S.-T . Choe and W .-D. Cho, “Simplified real-time heartbeat detection in ballistocardiography using a dispersion-maximum method, ” Biomedical Resear ch , vol. 28, no. 9, 2017. [28] J. Alametsä, A. Värri, M. Koi vuluoma, and L. Barna, “The potential of emfi sensors in heart activity monitoring, ” in 2nd OpenECG W orkshop Inte gration of the ECG into the EHR and Interoper ability of ECG Device Systems, Berlin, Germany , 2004. [29] T . Koi vistoinen, S. Junnila, A. V arri, and T . K oobi, “ A new method for measuring the ballistocardiogram using emfi sensors in a normal chair , ” in The 26th Annual International Confer ence of the IEEE Engineering in Medicine and Biology Society , vol. 1, Sept 2004, pp. 2026–2029. [30] S. Junnila, A. Akhbardeh, A. V arri, and T . Koi vistoinen, “ An emfi- film sensor based ballistocardiographic chair: performance and cycle extraction method, ” in IEEE W orkshop on Signal Pr ocessing Systems Design and Implementation, 2005. , Nov 2005, pp. 373–377. [31] S. Junnila, A. Akhbardeh, L. C. Barna, I. Defee, and A. V arri, “ A wireless ballistocardiographic chair, ” in 2006 International Conference of the IEEE Engineering in Medicine and Biology Society , Aug 2006, pp. 5932–5935. [32] J. M. Kortelainen and J. V irkkala, “Fft averaging of multichannel bcg signals from bed mattress sensor to improve estimation of heart beat interval, ” in 2007 29th Annual International Confer ence of the IEEE Engineering in Medicine and Biology Society , Aug 2007, pp. 6685–6688. [33] X. L. Aubert and A. Brauers, “Estimation of vital signs in bed from a single unobtrusi ve mechanical sensor: Algorithms and real-life ev aluation, ” in 2008 30th Annual International Confer ence of the IEEE Engineering in Medicine and Biology Society , Aug 2008, pp. 4744–4747. [34] S. Karki and J. Lekkala, “Film-type transducer materials pvdf and emfi in the measurement of heart and respiration rates, ” in 2008 30th Annual International Conference of the IEEE Engineering in Medicine and Biology Society , Aug 2008, pp. 530–533. [35] S. Kärki and J. Lekkala, “ A new method to measure heart rate with emfi and pvdf materials, ” J ournal of Medical Engineering & T echnology , vol. 33, no. 7, pp. 551–558, 2009. [Online]. A vailable: http://dx.doi.org/10.1080/03091900903067424 [36] E. Pinheiro, O. Postolache, and P . Girão, “Blood pressure and heart rate variabilities estimation using ballistocardiography , ” in Pr oceedings of the 7th Conf. on. T elecom , 2009, pp. 125–128. [37] E. C. Pinheiro, O. A. Postolache, and P . S. Girão, “Online heart rate estimation in unstable ballistocardiographic records, ” in 2010 Annual International Conference of the IEEE Engineering in Medicine and Biology , Aug 2010, pp. 939–942. [38] C. Brüser , S. W inter , and S. Leonhardt, “Robust inter-beat interval estimation in cardiac vibration signals, ” Physiological Measur ement , vol. 34, no. 2, p. 123, 2013. [Online]. A vailable: http://stacks.iop.org/0967- 3334/34/i=2/a=123 [39] M. D. Zink, C. Brüser , P . W innersbach, A. Napp, S. Leonhardt, N. Marx, P . Schauerte, and K. Mischke, “Heartbeat cycle length detection by a ballistocardiographic sensor in atrial fibrillation and sinus rhythm, ” BioMed resear ch international , vol. 2015, 2015. [40] M. D. Zink, C. Brüser, B.-O. Stüben, A. Napp, R. Stöhr, S. Leonhardt, N. Marx, K. Mischke, J. B. Schulz, and J. Schiefer , “Unobtrusive nocturnal heartbeat monitoring by a ballistocardiographic sensor in patients with sleep disordered breathing, ” Scientific Reports , vol. 7, no. 1, p. 13175, 2017. [41] E. J. Pino, J. A. P . Chávez, and P . Aque veque, “Noninv asi ve ambulatory measurement system of cardiac activity , ” in 2015 37th Annual Interna- tional Conference of the IEEE Engineering in Medicine and Biolo gy Society (EMBC) , Aug 2015, pp. 7622–7625. [42] E. J. Pino, C. Larsen, J. Chav ez, and P . Aquev eque, “Non-inv asi ve bcg monitoring for non-traditional settings, ” in 2016 38th Annual International Conference of the IEEE Engineering in Medicine and Biology Society (EMBC) , Aug 2016, pp. 4776–4779. [43] J. Alametsä and J. V iik, T welve Y ears F ollow-up of Ballistocardio graphy . Singapore: Springer Singapore, 2018, pp. 1117–1120. [Online]. A vailable: https://doi.org/10.1007/978-981-10-5122-7_279 [44] P . Chow , G. Nagendra, J. Abisheg anaden, and Y . T . W ang, “Respiratory monitoring using an air-mattress system, ” Physiological Measur ement , vol. 21, no. 3, p. 345, 2000. [Online]. A v ailable: http://stacks.iop.org/0967-3334/21/i=3/a=301 [45] T . W atanabe and K. W atanabe, “Noncontact method for sleep stage estimation, ” IEEE Tr ansactions on Biomedical Engineering , vol. 51, no. 10, pp. 1735–1748, Oct 2004. [46] K. W atanabe, T . W atanabe, H. W atanabe, H. Ando, T . Ishikawa, and K. Kobayashi, “Nonin vasiv e measurement of heartbeat, respiration, snoring and body movements of a subject in bed via a pneumatic method, ” IEEE T ransactions on Biomedical Engineering , vol. 52, no. 12, pp. 2100– 2107, Dec 2005. [47] Y . Kurihara and K. W atanabe, “Dev elopment of unconstrained heartbeat and respiration measurement system with pneumatic flow , ” IEEE T ransactions on Biomedical Circuits and Systems , vol. 6, no. 6, pp. 596–604, Dec 2012. [48] Y . Chee, J. Han, J. Y oun, and K. Park, “ Air mattress sensor system with balancing tube for unconstrained measurement of respiration and heart beat movements, ” Physiological Measurement , v ol. 26, no. 4, p. 413, 2005. [Online]. A vailable: http://stacks.iop.org/0967-3334/26/i=4/a=007 [49] J. Shin, Y . Chee, and K. Park, “Long-term sleep monitoring system and long-term sleep parameters using unconstrained method, ” in Intl. Special T opic Conf. on Info. T ech. in BME, Ioannina-Epirus, Greece , 2006. [50] J. H. Shin, Y . J. Chee, D. U. Jeong, and K. S. Park, “Nonconstrained sleep monitoring system and algorithms using air-mattress with balancing tube method, ” IEEE T ransactions on Information T echnology in Biomedicine , vol. 14, no. 1, pp. 147–156, Jan 2010. [51] M. Brink, C. H. Müller, and C. Schierz, “Contact-free measurement of heart rate, respiration rate, and body movements during sleep, ” Behavior Resear ch Methods , v ol. 38, no. 3, pp. 511–521, Aug 2006. [Online]. A vailable: https://doi.org/10.3758/BF03192806 [52] O. T . Inan, M. Etemadi, R. M. W iard, L. Giov angrandi, and G. T . A. K ov acs, “Robust ballistocardiogram acquisition for home monitoring, ” Physiological Measurement , vol. 30, no. 2, p. 169, 2009. [Online]. A vailable: http://stacks.iop.org/0967-3334/30/i=2/a=005 [53] O. T . Inan, M. Etemadi, B. W idro w , and G. T . A. Ko v acs, “ Adapti ve cancellation of floor vibrations in standing ballistocardiogram measure- REVIEW P APER 19 ments using a seismic sensor as a noise reference, ” IEEE Tr ansactions on Biomedical Engineering , vol. 57, no. 3, pp. 722–727, March 2010. [54] O. T . Inan, G. T . A. Ko v acs, and L. Giovangrandi, “Evaluating the lower- body electromyogram signal acquired from the feet as a noise reference for standing ballistocardiogram measurements, ” IEEE T ransactions on Information T echnology in Biomedicine , vol. 14, no. 5, pp. 1188–1196, Sept 2010. [55] R. M. W iard, O. T . Inan, B. Argyres, M. Etemadi, G. T . A. K ovacs, and L. Giovangrandi, “ Automatic detection of motion artifacts in the ballistocardiogram measured on a modified bathroom scale, ” Medical & Biological Engineering & Computing , vol. 49, no. 2, pp. 213–220, Feb 2011. [Online]. A vailable: https://doi.org/10.1007/s11517-010-0722-y [56] C. Bruser, K. Stadlthanner , S. de W aele, and S. Leonhardt, “ Adaptive beat- to-beat heart rate estimation in ballistocardiograms, ” IEEE T ransactions on Information T echnology in Biomedicine , vol. 15, no. 5, pp. 778–786, Sept 2011. [57] S. Nukaya, T . Shino, Y . Kurihara, K. W atanabe, and H. T anaka, “Nonin v asiv e bed sensing of human biosignals via piezoceramic de vices sandwiched between the floor and bed, ” IEEE Sensors Journal , vol. 12, no. 3, pp. 431–438, March 2012. [58] A. V ehkaoja, S. Rajala, P . Kumpulainen, and J. Lekkala, “Correlation approach for the detection of the heartbeat intervals using force sensors placed under the bed posts, ” Journal of Medical Engineering & T echnology , vol. 37, no. 5, pp. 327–333, 2013. [Online]. A vailable: http://dx.doi.org/10.3109/03091902.2013.807523 [59] W . K. Lee, H. Y oon, C. Han, K. M. Joo, and K. S. Park, “Physiological signal monitoring bed for infants based on load-cell sensors, ” Sensors , vol. 16, no. 3, p. 409, 2016. [60] D. Heise and M. Skubic, “Monitoring pulse and respiration with a non- in v asiv e hydraulic bed sensor, ” in 2010 Annual International Conference of the IEEE Engineering in Medicine and Biology , Aug 2010, pp. 2119– 2123. [61] D. Heise, L. Rosales, M. Skubic, and M. J. Dev aney , “Refinement and ev aluation of a hydraulic bed sensor, ” in 2011 Annual International Confer ence of the IEEE Engineering in Medicine and Biology Society , Aug 2011, pp. 4356–4360. [62] L. Rosales, M. Skubic, D. Heise, M. J. Devane y , and M. Schaumb urg, “Heartbeat detection from a hydraulic bed sensor using a clustering approach, ” in 2012 Annual International Conference of the IEEE Engineering in Medicine and Biology Society , Aug 2012, pp. 2383– 2387. [63] B. Y . Su, K. C. Ho, M. Skubic, and L. Rosales, “Pulse rate estimation using hydraulic bed sensor, ” in 2012 Annual International Confer ence of the IEEE Engineering in Medicine and Biology Society , Aug 2012, pp. 2587–2590. [64] D. Heise, L. Rosales, M. Sheahen, B. Y . Su, and M. Skubic, “Non- in v asiv e measurement of heartbeat with a hydraulic bed sensor progress, challenges, and opportunities, ” in 2013 IEEE International Instrumenta- tion and Measurement T echnology Conference (I2MTC) , May 2013, pp. 397–402. [65] K. L ydon, B. Y . Su, L. Rosales, M. Enayati, K. C. Ho, M. Rantz, and M. Skubic, “Robust heartbeat detection from in-home ballistocardiogram signals of older adults using a bed sensor , ” in 2015 37th Annual International Conference of the IEEE Engineering in Medicine and Biology Society (EMBC) , Aug 2015, pp. 7175–7179. [66] C. Jiao, P . L yons, A. Zare, L. Rosales, and M. Skubic, “Heart beat characterization from ballistocardiogram signals using extended functions of multiple instances, ” in 2016 38th Annual International Conference of the IEEE Engineering in Medicine and Biology Society (EMBC) , Aug 2016, pp. 756–760. [67] L. Rosales, B. Y . Su, M. Skubic, and K. Ho, “Heart rate monitoring using hydraulic bed sensor ballistocardiogram1, ” Journal of Ambient Intelligence and Smart Envir onments , v ol. 9, no. 2, pp. 193–207, 2017. [68] N. Lagakos, J. H. Cole, and J. A. Bucaro, “Microbend fiber-optic sensor , ” Appl. Opt. , vol. 26, no. 11, pp. 2171–2180, Jun 1987. [Online]. A vailable: http://ao.osa.org/abstract.cfm?URI=ao-26-11-2171 [69] J. W . Berthold, “Historical re view of microbend fiber-optic sensors, ” Journal of Lightwave T echnology , vol. 13, no. 7, pp. 1193–1199, Jul 1995. [70] F . Luo, J. Liu, N. Ma, and T . Morse, “ A fiber optic microbend sensor for distributed sensing application in the structural strain monitoring, ” Sensors and Actuators A: Physical , vol. 75, no. 1, pp. 41 – 44, 1999. [Online]. A vailable: http://www .sciencedirect.com/science/article/pii/S0924424799000436 [71] H. feng Hu, S. jia Sun, R. qing Lv , and Y . Zhao, “Design and experiment of an optical fiber micro bend sensor for respiration monitoring, ” Sensors and Actuator s A: Physical , v ol. 251, no. Supplement C, pp. 126 – 133, 2016. [Online]. A vailable: http://www .sciencedirect.com/science/article/pii/S0924424716306720 [72] A. A. Moghadas and M. Shadaram, “Fiber bragg grating sensor for fault detection in radial and netw ork transmission lines, ” Sensors , vol. 10, no. 10, pp. 9407–9423, 2010. [Online]. A v ailable: http://www .mdpi.com/1424-8220/10/10/9407 [73] S. Poeggel, D. T osi, D. Duraibab u, G. Leen, D. McGrath, and E. Lewis, “Optical fibre pressure sensors in medical applications, ” Sensors , vol. 15, no. 7, pp. 17 115–17 148, 2015. [Online]. A vailable: http://www .mdpi.com/1424-8220/15/7/17115 [74] C. A. Díaz, C. Leitão, C. A. Marques, M. F . Domingues, N. Alberto, M. J. Pontes, A. Frizera, M. Ribeiro, P . S. André, and P . F . Antunes, “Low- cost interrogation technique for dynamic measurements with fbg-based devices, ” Sensors , v ol. 17, no. 10, p. 2414, 2017. [75] Z. Chen, J. T . T eo, and X. Y ang, “In-bed fibre optic breathing and movement sensor for non-intrusi ve monitoring, ” in Proc.SPIE , vol. 7173, 2009, pp. 7173 – 7173 – 6. [Online]. A vailable: http://dx.doi.org/10.1117/12.807924 [76] Z. Chen, J. T . T eo, S. H. Ng, and X. Y ang, “Portable fiber optic ballistocardiogram sensor for home use, ” in Proc.SPIE , vol. 8218, 2012, pp. 8218 – 8218 – 7. [Online]. A vailable: http://dx.doi.org/10.1117/12.909768 [77] C. J. Deepu, Z. Chen, J. T . T eo, S. H. Ng, X. Y ang, and Y . Lian, “ A smart cushion for real-time heart rate monitoring, ” in 2012 IEEE Biomedical Cir cuits and Systems Conference (BioCAS) , Nov 2012, pp. 53–56. [78] Z. Chen, X. Y ang, J. T . T eo, and S. H. Ng, “Nonin v asi ve monitoring of blood pressure using optical ballistocardiography and photoplethysmo- graph approaches, ” in 2013 35th Annual International Confer ence of the IEEE Engineering in Medicine and Biology Society (EMBC) , July 2013, pp. 2425–2428. [79] D. Lau, Z. Chen, J. T . T eo, S. H. Ng, H. Rumpel, Y . Lian, H. Y ang, and P . L. Kei, “Intensity-modulated microbend fiber optic sensor for respiratory monitoring and gating during mri, ” IEEE T ransactions on Biomedical Engineering , vol. 60, no. 9, pp. 2655–2662, Sept 2013. [80] Z. Chen, D. Lau, J. T . T eo, S. H. Ng, X. Y ang, and P . L. Kei, “Simultaneous measurement of breathing rate and heart rate using a microbend multimode fiber optic sensor, ” J ournal of Biomedical Optics , vol. 19, pp. 19 – 19 – 11, 2014. [Online]. A vailable: http://dx.doi.org/10.1117/1.JBO.19.5.057001 [81] Ł. Dziuda, M. Krej, and F . W . Skibniewski, “Fiber bragg grating strain sensor incorporated to monitor patient vital signs during mri, ” IEEE Sensors Journal , vol. 13, no. 12, pp. 4986–4991, Dec 2013. [82] Ł. Dziuda, F . W . Skibniewski, M. Krej, and P . M. Baran, “Fiber bragg grating-based sensor for monitoring respiration and heart activity during magnetic resonance imaging examinations, ” Journal of Biomedical Optics , vol. 18, pp. 18 – 18 – 15, 2013. [Online]. A vailable: http://dx.doi.org/10.1117/1.JBO.18.5.057006 [83] Ł. Dziuda and F . W . Skibniewski, “ A new approach to ballistocardiographic measurements using fibre bragg grating- based sensors, ” Biocybernetics and Biomedical Engineering , vol. 34, no. 2, pp. 101 – 116, 2014. [Online]. A vailable: http://www .sciencedirect.com/science/article/pii/S0208521614000187 [84] M. Krej, Ł. Dziuda, and F . W . Skibniewski, “ A method of detecting heartbeat locations in the ballistocardiographic signal from the fiber-optic vital signs sensor , ” IEEE Journal of Biomedical and Health Informatics , vol. 19, no. 4, pp. 1443–1450, July 2015. [85] Ł. Dziuda, “Fiber-optic sensors for monitoring patient physiological parameters: a revie w of applicable technologies and relevance to use during magnetic resonance imaging procedures, ” J ournal of Biomedical Optics , vol. 20, pp. 20 – 20 – 23, 2015. [Online]. A vailable: http://dx.doi.org/10.1117/1.JBO.20.1.010901 [86] Y . Zhu, H. Zhang, M. Jayachandran, A. K. Ng, J. Biswas, and Z. Chen, “Ballistocardiography with fiber optic sensor in headrest position: A feasibility study and a new processing algorithm, ” in 2013 35th Annual International Conference of the IEEE Engineering in Medicine and Biology Society (EMBC) , July 2013, pp. 5203–5206. [87] Z. Chen, J. T . T eo, S. H. Ng, X. Y ang, B. Zhou, Y . Zhang, H. P . Loo, H. Zhang, and M. Thong, “Monitoring respiration and cardiac activity during sleep using microbend fiber sensor: A clinical study and ne w algorithm, ” in 2014 36th Annual International Confer ence of the IEEE Engineering in Medicine and Biology Society , Aug 2014, pp. 5377–5380. [88] Y . Zhu, V . F . S. Fook, E. H. Jianzhong, J. Maniyeri, C. Guan, H. Zhang, E. P . Jiliang, and J. Biswas, “Heart rate estimation from fbg sensors using cepstrum analysis and sensor fusion, ” in 2014 36th Annual International Confer ence of the IEEE Engineering in Medicine and Biology Society , Aug 2014, pp. 5365–5368. REVIEW P APER 20 [89] Y . Zhu, J. Maniyeri, V . F . S. Fook, and H. Zhang, “Estimating respiratory rate from fbg optical sensors by using signal quality measurement, ” in 2015 37th Annual International Conference of the IEEE Engineering in Medicine and Biology Society (EMBC) , Aug 2015, pp. 853–856. [90] M. Fajkus, J. Nedoma, R. Martinek, V . V asinek, H. Nazeran, and P . Siska, “ A non-inv asive multichannel hybrid fiber-optic sensor system for vital sign monitoring, ” Sensors , vol. 17, no. 1, p. 111, 2017. [91] M. Fajkus, J. Nedoma, R. Martinek, and W . W alendziuk, “Comparison of the fbg sensor encapsulated into pdms and fbg sensor glued on the plexiglass pad for respiratory and heart rate monitoring, ” in Photonics Applications in Astr onomy, Communications, Industry , and High Energy Physics Experiments 2017 , vol. 10445. International Society for Optics and Photonics, 2017, p. 104450B. [92] K. Chethana, A. Guru Prasad, S. Omkar, and S. Asokan, “Fiber bragg grating sensor based device for simultaneous measurement of respiratory and cardiac activities, ” Journal of biophotonics , vol. 10, no. 2, pp. 278– 285, 2017. [93] J. Nedoma, M. Fajkus, R. Martinek, S. Kepak, J. Cubik, S. Zabka, and V . V asinek, “Comparison of bcg, pcg and ecg signals in application of heart rate monitoring of the human body , ” in T elecommunications and Signal Pr ocessing (TSP), 2017 40th International Conference on . IEEE, 2017, pp. 420–424.
Original Paper
Loading high-quality paper...
Comments & Academic Discussion
Loading comments...
Leave a Comment