Extracting dispersion curves from ambient noise correlations using deep learning
We present a machine-learning approach to classifying the phases of surface wave dispersion curves. Standard FTAN analysis of surfaces observed on an array of receivers is converted to an image, of which, each pixel is classified as fundamental mode, first overtone, or noise. We use a convolutional neural network (U-net) architecture with a supervised learning objective and incorporate transfer learning. The training is initially performed with synthetic data to learn coarse structure, followed by fine-tuning of the network using approximately 10% of the real data based on human classification. The results show that the machine classification is nearly identical to the human picked phases. Expanding the method to process multiple images at once did not improve the performance. The developed technique will faciliate automated processing of large dispersion curve datasets.
💡 Research Summary
The paper presents a deep‑learning workflow for automatically extracting surface‑wave dispersion curves from ambient‑noise cross‑correlations. Traditional dispersion analysis relies on Frequency‑Time Analysis (FTAN) to produce a two‑dimensional representation of amplitude as a function of period (or frequency) and group velocity. Human experts then manually pick the fundamental mode and the first overtone, discarding noisy points. This manual step becomes a bottleneck when dealing with dense seismic arrays, such as the 5,340‑station temporary network deployed in Long Beach, California.
To automate this step, the authors convert each FTAN map into a 64 × 64 greyscale image, where pixel intensity encodes amplitude. Each pixel is labeled as one of three classes: “noise”, “fundamental mode”, or “first overtone”. The labeling is performed by experts for a subset of the data (1,000 images for training, 4,340 images reserved for testing). Because labeling thousands of images is labor‑intensive, the authors generate a large synthetic dataset (100,000 images) by perturbing a 1‑D layered velocity model (±10 % in velocities and layer thicknesses), solving the eigen‑problem for surface‑wave dispersion, and adding random frequency/velocity shifts (±2.5 %) and amplitude noise. This synthetic set captures the essential geometric patterns of dispersion curves while providing virtually unlimited training material.
The core model is a U‑Net convolutional neural network, originally designed for biomedical image segmentation. The network takes a single‑channel 64 × 64 image and outputs a three‑channel probability map of the same spatial dimensions. Training proceeds in two stages. First, the network is trained on the synthetic data using the Adam optimizer, mini‑batches of size 32, and early stopping based on a held‑out 10 % validation set. After convergence, the best synthetic‑trained model is fine‑tuned on the real Long Beach data (900 training images, 100 validation images). This transfer‑learning approach allows the model to learn coarse, physics‑driven features from the synthetic data and then adapt to subtle, dataset‑specific characteristics with only a modest amount of human‑labeled real data.
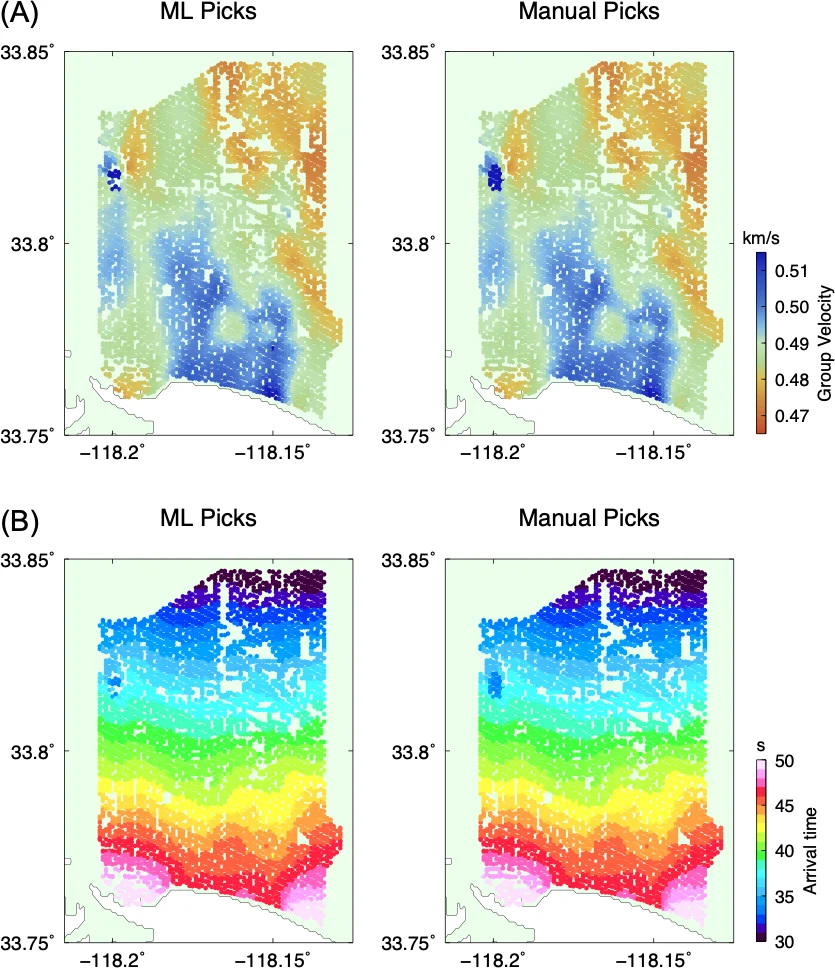
Performance is evaluated at the pixel level using precision and recall for each class. The “noise” class achieves >99 % precision and recall, reflecting its dominance in the training set. The fundamental mode reaches a median precision of 99 % and recall of 95 %; the first overtone attains 98 % precision and 94 % recall. These figures are essentially indistinguishable from expert labeling, demonstrating that the model can reliably separate true dispersion branches from spurious energy.
The authors also explored two extensions. First, they concatenated images from K nearest‑neighbor stations (K = 2 … 8) to form a 3‑D input (64 × 64 × K) in the hope that spatial redundancy would improve noise discrimination. Systematic experiments showed no statistically significant gain, suggesting that a single‑station image already contains sufficient information for accurate picking. Second, they tried a sequential classification approach using bidirectional Gated Recurrent Units (GRU) on raw (period, velocity, amplitude) tuples sorted by amplitude. This method performed markedly worse than the image‑based CNN, underscoring the advantage of exploiting the spatial coherence of FTAN images.
In the discussion, the authors emphasize that the hybrid synthetic‑plus‑real training pipeline dramatically reduces the amount of manual labeling required—only 1,000 real images (≈2 % of the total dataset) were needed to achieve near‑human performance. They estimate an 80 % reduction in human labor for processing the full 5,340‑pair dataset. The approach is scalable: additional synthetic data can be generated for other regions, and the same transfer‑learning strategy can be applied to different seismic tasks (e.g., body‑wave picking, phase association).
Limitations include the fixed image resolution (64 × 64), which introduces discretization error that the authors mitigate by post‑processing picks back onto the original FTAN map. Higher‑resolution inputs (e.g., 128 × 128) could improve accuracy but would increase computational cost. Moreover, the method was tested on a single geographic area with relatively homogeneous geology; broader validation across diverse tectonic settings remains future work.
Overall, the study demonstrates that deep convolutional networks, when combined with a well‑designed simulation‑to‑real transfer learning scheme, can automate a traditionally manual and time‑consuming step in surface‑wave tomography. The resulting workflow promises to accelerate ambient‑noise seismology, enable rapid processing of massive array datasets, and open the door to fully automated, near‑real‑time dispersion analysis.
Comments & Academic Discussion
Loading comments...
Leave a Comment