A Survey on the Visual Perceptions of Gaussian Noise Filtering on Photography
💡 Research Summary
This paper investigates the visual perception of Gaussian noise filtering in low‑light photography by comparing five commonly used denoising methods: a 3 × 3 mean (box) filter, a non‑local means filter, a bilateral filter, and Adobe Lightroom’s proprietary denoise tool applied at 50 % and 100 % strength. Unlike many prior studies that rely on simulated noise, the authors captured real noisy images using a Canon 6D Mark I with ISO settings ranging from 200–600 (low‑noise reference) to 20 000–25 600 (high‑noise target). Both the reference and noisy shots were converted to grayscale JPEGs to eliminate color variables, then processed with the five filters.
Quantitative performance was assessed using four standard image‑quality metrics: Mean Squared Error (MSE), Peak Signal‑to‑Noise Ratio (PSNR), coefficient of determination (R²), and Structural Similarity Index (SSIM). Results showed that the bilateral filter achieved the highest PSNR (≈ 29.5 dB) and lowest MSE, but suffered noticeable blurring, reflected in a modest SSIM. The non‑local means filter offered a good balance of PSNR (≈ 27.8 dB) and SSIM (≈ 0.78) with longer computation time. The simple 3 × 3 mean filter performed worst on PSNR and MSE yet retained relatively higher SSIM, indicating preserved structural content despite higher error. Lightroom’s 50 % setting produced intermediate scores, while the 100 % setting achieved the highest PSNR (≈ 31.2 dB) but the lowest SSIM (≈ 0.73), suggesting aggressive smoothing that destroys fine details.
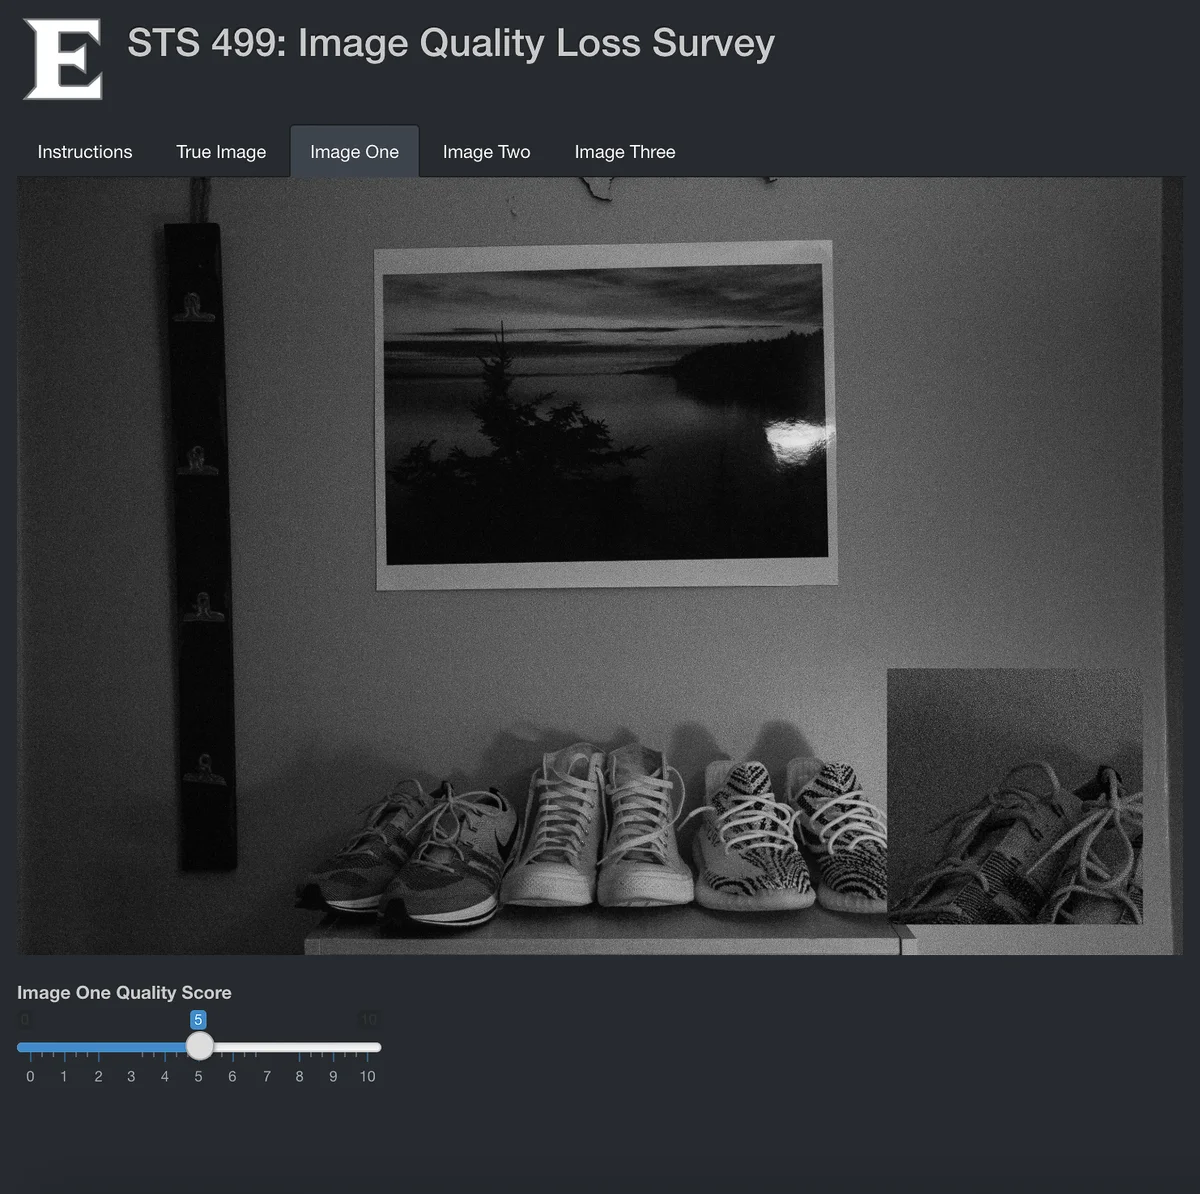
To capture human judgments, an R Shiny survey was deployed to 73 undergraduate students (math/statistics majors) at Elon University. Participants first viewed a true‑state reference image, then a noisy image, and finally a filtered image, rating each filtered result on a 1‑10 Likert scale. The survey was split into a training phase (to calibrate expectations) and an evaluation phase (randomly presenting one of the five filtered images). Average subjective scores were: non‑local means ≈ 6.8, bilateral ≈ 5.9, mean filter ≈ 5.2, Lightroom 50 % ≈ 5.5, Lightroom 100 % ≈ 3.2. A one‑way ANOVA confirmed significant differences among filters (p ≈ 0.018), and post‑hoc Tukey tests highlighted the particularly low rating for Lightroom 100 % compared with the other methods. An ANCOVA that included training‑phase scores as a covariate showed that while prior expectations modestly influenced final ratings (p ≈ 0.032), the main effect of filter type remained significant.
The key insight is the lack of a strong correlation between objective metrics (especially PSNR) and perceived visual quality. The 100 % Lightroom setting, despite its superior PSNR, was judged the poorest by participants due to excessive blurring and loss of detail. This aligns with earlier literature reporting that conventional quantitative scores often fail to capture human visual preferences.
The authors acknowledge several limitations: (1) only a single scene and image were used, restricting generalizability; (2) the participant pool was limited to a specific student demographic; (3) filter parameters were fixed rather than optimized for each image. They recommend future work to incorporate multiple low‑light scenes, broader participant samples, systematic parameter tuning, and comparisons with modern deep‑learning denoisers.
In summary, the study demonstrates that while classic kernel‑based filters can be objectively measured, human perception of image quality in low‑light denoising is more sensitive to artifacts such as edge blurring than to raw signal‑to‑noise improvements. This underscores the need for perceptually‑aware evaluation frameworks when developing or selecting denoising tools for photography.
Comments & Academic Discussion
Loading comments...
Leave a Comment