AudVowelConsNet: A Phoneme-Level Based Deep CNN Architecture for Clinical Depression Diagnosis
Depression is a common and serious mood disorder that negatively affects the patient's capacity of functioning normally in daily tasks. Speech is proven to be a vigorous tool in depression diagnosis. Research in psychiatry concentrated on performing …
Authors: Muhammad Muzammel, Hanan Salam, Yann Hoffmann
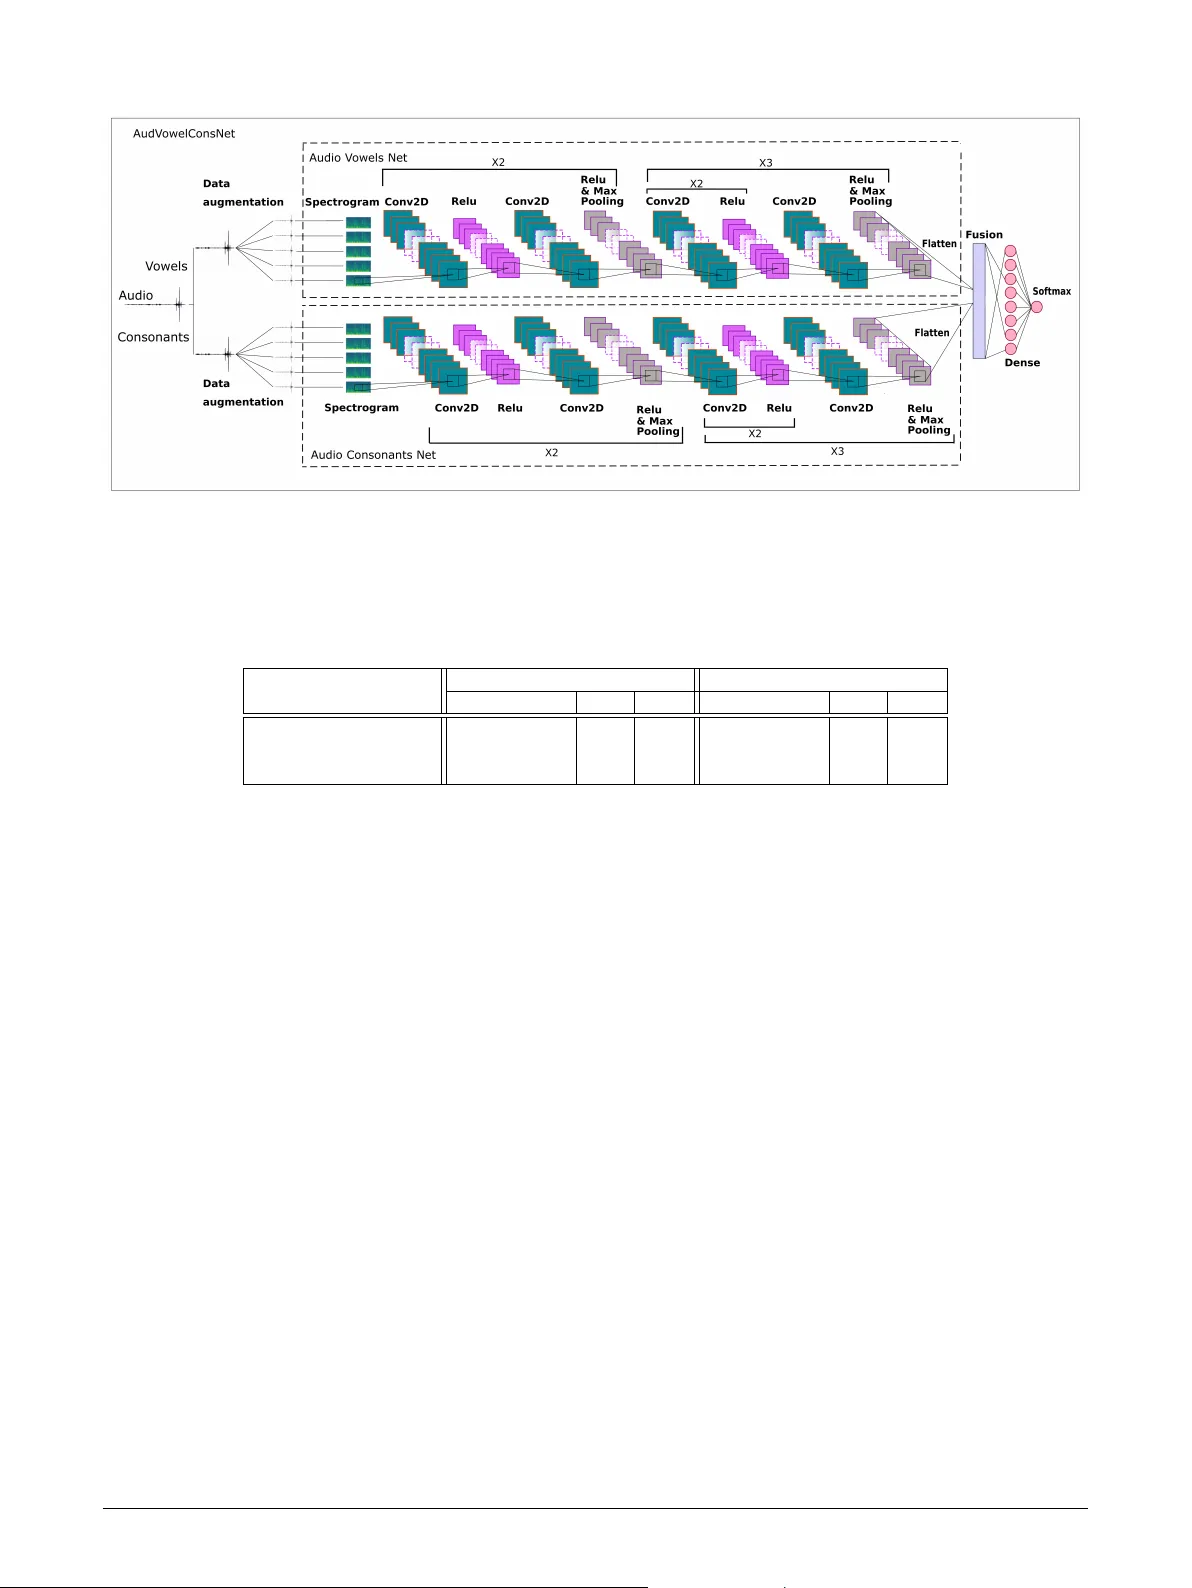
Graphical Abs tract A udV o w elConsNet: A Phoneme-Le v el Based Deep CNN Architecture f or Clinical Depression Di- agnosis Muhammad Muzammel,Hanan Salam,Y ann Hoffmann,Mohamed Chetouani,Alice Othmani Depression is a common and serious mood disorder that nega- tivel y affects the patient ’ s capacity of functioning normally in daily tasks. Speech is pro ven to be a vigorous tool in depression diagnosis. Researc h in psyc hiatr y concentrated on perform- ing fine-grained analysis on word-le vel speech components contributing to the manif estation of depression in speech and re- vealed significant variations at t he phoneme-level in depressed speech. On the other hand, research in Machine Learning-based automatic recognition of depression from speech focused on t he exploration of various acoustic features for the detection of de- pression and its severity level. Fe w ha v e f ocused on incor porat- ing phoneme-lev el speech components in automatic assessment systems. In this paper, we propose an Ar tificial Intelligence (AI) based application for clinical depression recognition and assessment from speech. W e in vestig ate the acoustic c harac- teristics of phoneme units, specifically vo wels and consonants f or depression recognition via Deep Learning. W e present and compare three spectrogram-based Deep Neural Netw ork archi- tectures, trained on phoneme consonant and vo wel units and their fusion respectivel y . Our experiments show that t he deep learned consonant-based acoustic characteristics lead to better recognition results than v ow el-based ones. The fusion of vo wel and consonant speech characteristics through a deep netw ork significantly outper f or ms the single space networks as well as the state-of-ar t deep learning approaches on t he DAIC- WOZ database. Highlights A udV o w elConsNet: A Phoneme-Lev el Based Deep CNN Architecture for Clinical Depression Di- agnosis Muhammad Muzammel,Hanan Salam,Y ann Hoffmann,Mohamed Chetouani,Alice Ot hmani • A new approach for speech-based automatic depression assessment via deep learning. • In ves tigate acoustic characteristics of speech consonant and vo wel spaces and their fusion for depression recognition. • Consonant-based deep learned acoustic descr iptors outper f or ms vo wel-based descr iptors. • Fusion of consonant and v ow el space deep lear ned descriptors outper f or m single space features. • Our proposed method outper f orms all state of t he ar t approaches in depression recognition on DAIC- WOZ dat aset. AudV o welConsN et: A Phoneme-Le v el Based Deep CNN Architecture f or Clinical Depr ession Diagnosis Muhammad Muzammel a , Hanan Salam b , Y ann Hoffmann c , Mohamed Chetouani d and Alice Othmani a , ∗ a Univ ersité P aris-Est Crét eil (UPEC), LISSI, Vitr y sur Seine 94400, Fr ance b Emlyon, 23 Av enue Guy de Collongue, 69130 Écully, F rance c Univ ersity of Luxembourg, Kirc hberg Campus, 6, rue Richard Coudenho ve-Kaler gi, L -1359, L uxembour g d Institut des Systèmes Intellig ents et de Robotique, Sorbonne Univ ersite, CNRS UMR 7222, P aris, Fr ance A R T I C L E I N F O Keyw ords : Major Depressive Disorder Clinical depression Detection AI-based application HCI-based Healthcare Speech Depression Recognition Deep phoneme-lev el lear ning A B S T R A C T Depression is a common and ser ious mood disorder that negatively affects the patient ’ s capacity of functioning normally in daily tasks. Speech is proven to be a vigorous tool in depression diagnosis. Researc h in psychiatry concentrated on performing fine-g rained analy sis on wor d-lev el speech compo- nents contributing to t he manifestation of depression in speech and rev ealed significant variations at the phoneme-lev el in depressed speech. On the other hand, research in Mac hine Learning-based automatic recognition of depression from speech focused on the exploration of various acoustic f eatures for the detection of depression and its sev erity level. Few hav e focused on incor porating phoneme-lev el speech components in automatic assessment systems. In this paper, we propose an Ar tificial Intelligence (AI) based application for clinical depression recognition and assessment from speech. W e inves tigate the acoustic characteristics of phoneme units, specifically vo wels and consonants for depression recognition via Deep Lear ning. W e present and compare three spectrog ram-based Deep Neural Network architec- tures, trained on phoneme consonant and vo wel units and their fusion respectively . Our experiments show that the deep learned consonant-based acoustic characteristics lead to better recognition results than vow el-based ones. The fusion of vow el and consonant speech characteristics through a deep netw ork significantly outper f or ms the single space networks as well as the state-of-ar t deep learning approaches on t he DAIC- WOZ dat abase. 1. Introduction Depression (Major Depressiv e Disorder) is a common and serious mood disorder that negativel y affects ho w a per - son f eels, t hinks and acts. It leads to a variety of emotional and phy sical problems, negativel y affecting a person ’ s ability to function in daily tasks ( Kanter et al. , 2008 ). It is mani- f ested through persistent f eelings of sadness, hopelessness and interest in activities loss and considered as a major cause of suicide affecting more than 300 million people in the world ( WHO , 2017 ). Depression causes a non-negligible economic burden per year due to increasing absenteeism and reduced productivity in t he workplace ( Greenberg et al. , 2015 ). If cor rectl y diagnosed, depression is a treatable disorder and its symptoms can be alleviated. Y et, misdiagnosing de- pressed patients is a common bar rier ( Mitchell et al. , 2009 ). Mostl y , questionnaire based scales are used by clinicians to measure depression ( Williams et al. , 2005 ; Williams , 1988 ; Zigmond and Snaith , 1983 ), Misdiagnosing depression is ei- ther due to comorbid conditions presenting similar symptoms such as hypothyr oidism, hypogl ycemia or ev en nor mal stress due to busy daily work, or subjective biases due to t he clini- cian ’ s skill as well as the reliability of a patient’ s perception of t heir mental state ( Blais and Baer , 2009 ). Automatic de- ∗ Corresponding author: Dr. Alice OTHMANI muhammad.muzammel@u-pec.fr (M. Muzammel); salam@em-lyon.com (H. Salam); yann.hoffmann.002@student.uni.lu (Y . Hoffmann); mohamed.chetouani@sorbonne-universite.fr (M. Chetouani); alice.othmani@u-pec.fr (A. Othmani) OR CID (s): pression detection methods can offer an objective framew ork f or depression diagnosis as well as an initial entr y point f or clinicians. In the past decade, automatic depression detection has became popular with t he emergence of publicly av ailable research datasets ( Gratch et al. , 2014 ) and t he success of Ma- chine Learning techniq ues in learning comple x patterns in such applications. State-of-the art approac hes proposed to assess depression based on behavioral non-verbal and v erbal cues ( Pampouc hidou et al. , 2017b ). Par ticular ly , speech has pro ven to be a reliable objective marker for depression assess- ment ( Cummins et al. , 2015 ) due to its accessibility and av ail- ability compared to other modalities. For instance, research findings show ed t hat speech segments of depressed subjects are slow ed, pauses between two segments are lengthened and differences in timbre were detected ( Kraepelin , 1921 ; Pampouc hidou et al. , 2017a ) compared to healthy subjects. Furt hermore, the r ise of deep learning techniq ues had led researchers to explore different deep architectures and meth- ods f or depression assessment ( Othmani et al. , 2020 ; Salekin et al. , 2018 ). Deep neural netw orks hav e significantly im- pro ved the performance of such tasks compared to traditional approaches due to their capacity to automatically learn both low and high level descriptors from the patient’ s behaviors without the need of human inter v ention. A sequence of speech sounds is organized in function of org anization units called syllables, which are typically consti- tuted of phoneme units, typically , v owel and consonant units ( De Jong , 2003 ). Speech vow els and consonants duration is Muhammad Muzammel et al.: Pr epr int submitted to Elsevier Page 1 of 12 AudV ow elConsNet: A Phoneme-Level Based Deep CNN Architecture for Clinical Dep ression Diagnosis directly influenced by f actors such as speaking rate, adjacent consonants, syllabic stress, position of a vo wel in a word and t he word type ( Farooq and Mahmood , 2018 ). Conse- quentl y , speech vo wels and consonants are directly affected in depressed speech. V ow el-lev el analysis in depressed patients w as studied in previous work . Specifically , findings rev ealed a reduced fre- quency range in vo wel production ( Darby et al. , 1984 ) and in the speech V ow el Space Area (VS A) ( Scherer et al. , 2015 ) in depression. Moreover , gender-dependent vo wel lev el analysis w as performed for boosting speech-based depression recog- nition ( Vlasenko et al. , 2017 ). Sur prisingly , t hese studies ignored the speech consonant space. In this paper, we focus on inv estigating the contr ibutions of acoustic characteristics of phoneme units for depression assessment. W e explore t he capacity of deep lear ning to ab- stract high level descriptors from speech consonant and vo wel spaces. W e propose and compare t hree spectrogram-based deep Neural Networ k architectures, trained on speech con- sonant space, vo wel space and deep consonant-vo wel fusion respectivel y . The str ucture of t he paper is organized as f ol- low s: the next section illustrates the related work. Section 4 represents t he the global schema and the proposed CNN ar - chitectures. In Section 5 , details about different experiments and results are giv en. Section 6 concludes the paper . 2. Related W ork Tr aditionally , inter vie w sty le questionnaire based scales are used by health practitioners to assess depression. Exam- ple scales include: Hospital Anxiety and Depression Scale (HADS) ( Zigmond and Snaith , 1983 ), Hamilton Depression Rating Scale (HDRS) ( Williams , 1988 ), Quick Inv entor y of Depression Symptomatology (QIDS) ( Rush et al. , 2003 ), Beck’ s Depression Inv entor y (BDI) ( Olay a-Contreras et al. , 2010 ), and the most commonly used, Patient Health Ques- tionnaire (PHQ) ( Williams et al. , 2005 ). PHQ is composed of nine clinical questions. Based on the patient answers, PHQ score is used to descr ibe t he severity lev el ranges on a scale of 0 to 23 . Patient Healt h Questionnaire (PHQ) ( Williams et al. , 2005 ) is t he most commonly used scale. PHQ is composed of nine clinical questions. Based on the patient answers, PHQ score is used to describe t he se v erity level ranges of depression on a scale of 0 to 23 . The assessment rely on clinicians subjective assessments which might present subjective biases ( Blais and Baer , 2009 ) due to the clinician ’ s skill and t he reliability of a patient’ s per - ception of their mental state ( Blais and Baer , 2009 ). Conse- quentl y automatic depression assessment approaches emerged which offer an objective wa y of mapping patient’ s verbal and non-verbal cues to a depression score. Automatic depression assessment approaches are consti- tuted mainly of t hree steps: 1) data collection where multi- modal data is acquired (audio, video ( de Melo et al. ; Song et al. , 2020 ), text ( Al Hanai et al. , 2018 ), context ( W are et al. , 2020 ), etc..) and depression score ground tr uth is collected simultaneously using clinicall y v alidated scales. 2) data pro- cessing where data is pre-processed, depression markers ex- tracted (f eatures) and 3) prediction where machine learning models are applied to predict the individual’ s depression state. Speech-based approaches for depression assessment rely on t he extraction of acoustic and prosodic markers. These include low and high le vel features designed and extracted from the audio signal in an attempt to model the characteris- tics of speech such as prosody , voice quality , frequency range, energy , etc. Extracted features are t hen fed to main-stream classifiers to predict depression ( Alghowinem et al. , 2013 ; Jiang et al. , 2018 ; Liu et al. , 2015 ; Ringe val et al. , 2017 ; V alstar et al. , 2016 ). 2.1. A coustic features based depression assessment Acoustic features used f or depression assessment can be categorized into six categor ies: Prosodic, Source, Formant, Spectral ( Cummins et al. , 2015 ), Cepstral and deep learning f eatures. These f eatures hav e been demonstrated to contain relev ant information about depressed speech. Prosodic features represent phoneme lev el v ariations in speech rate, rhythm, loudness, intonation and stress ( Al Hanai et al. , 2018 ; Asgar i et al. , 2014 ; Jiang et al. , 2018 ; Ringev al et al. , 2017 ). For instance, the Fundament al frequency (F0) and energy is used as it represents pitch and loudness percep- tual characteristics ( Cummins et al. , 2015 ). Source features capture information of the v oice produc- tion source. Such featur es parameterize t he air flo w from the lungs through glottis via glottal f eatures ( Jiang et al. , 2018 ; Low et al. , 2010 ), or vocal fold mov ements via voice qual- ity features. These include: spectr um maxima, nor malized amplitude quo tient, the quasi open quotient, harmonic dif- f erences H1-H2 and H1-H3, jitter , and the shimmer ( Asgar i et al. , 2014 ; Ringev al et al. , 2017 ; V alstar et al. , 2016 ). An- other type of source features is the T eager Energy Operator (TEO) ( Lo w et al. , 2010 ) whic h is used for computing the audio signal’ s energy in nonlinear manner ( Sundaram et al. , 2003 ). ‘TEO measures t he number of additional harmonics due to the nonlinear air flow in the vocal tract that produces the speech signal’ ( Low et al. , 2010 ). The interest of this filter lies in the fact that it has a small time window making it ideal f or signals local time analy sis ( Kv edalen , 2003 ). F ormant features contain information concer ning the v ocal tract acoustic resonances and ar ticulatory effor ts. These reflect physical v ocal tract properties such as the muscle tension in the form of f ormant frequencies (F1, F2, F3) that are affected by the depression state of the patient ( Al Hanai et al. , 2018 ; Cummins et al. , 2017 ). Spectral features characterise the speech spectr um which constitutes frequency distr ibution of t he speech signal at a specific time inst ance ( Al Hanai et al. , 2018 ; Asgari et al. , 2014 ; Jiang et al. , 2018 ; Ring ev al et al. , 2017 ). Examples of spectral features used in the literature include spectral flux, energy , slope and flatness ( Jiang et al. , 2018 ; Low et al. , 2010 ; Song et al. , 2018 ). Cepstral features are those based on a non-linear spectr um- of-a-spectrum representation. The most common used are Muhammad Muzammel et al.: Pr epr int submitted to Elsevier P age 2 of 12 AudV ow elConsNet: A Phoneme-Level Based Deep CNN Architecture for Clinical Dep ression Diagnosis Mel-Frequency Cepstral Coefficients (MFCC) ( Asgari et al. , 2014 ) and Linear Prediction Cepstral Coefficients ( Alghowinem et al. , 2013 ; Jiang et al. , 2018 ; Lopez-Otero et al. , 2015 ; Low et al. , 2010 ). Many authors repor ted that spectral f eatures attained a more robust performance f or depression detection compared to cepstral and other acoustic featur es ( France et al. , 2000 ; Low et al. , 2010 ; Moore et al. , 2004 ; EII et al. , 2007 ). Deep Learning features offer an automatic abstraction of audio descriptors contr ibuting to t he manifes tation of de- pression in speech, which has prov en to outper f or m others f or depression recognition. Ra w audio is either used as in- put to deep architectures ( Trigeorgis et al. , 2016 ) or acoustic f eatures are extracted a pr iori and used as input of the deep neural netw ork. For instance, Dinkel et al. ( 2019 ) proposed a self-supervised, W ord2V ec like pre-trained depression au- dio embedding method as a f eature for depression detection. On the other hand, Ma et al. ( 2016 ) used Mel-scale filter bank and MFCC f eatures while in Othmani et al. ( 2020 ), a spectogram-based CNN and an MFCC-based CNN are fused to detect depression. Salekin et al. ( 2018 ) e xtracted prosodic and MFCC f eatures, R ejaibi et al. ( 2019 ) extracted MFCC f eatures and Y ang et al. ( 2017a , b ) per f or med textual content analy sis, visual features, spectral and voice quality audio f eatures a pr iori to Deep Lear ning. Deep architectures – Proposed deep lear ning architec- tures include f eed-forward neural netw ork (FF -NN) ( Dham et al. , 2017 ), conv olutional neural network (CNN) ( Othmani et al. , 2020 ), long shor t-term memory conv olutional neural netw ork (LSTM-CNN) ( Ma et al. , 2016 ; Trigeor gis et al. , 2016 ), bidirectional long shor t-term memor y conv olutional neural netw ork (BL S TM-CNN) ( Dink el et al. , 2019 ; Salekin et al. , 2018 ), decon volutional neural network (DNN) ( Gupta et al. , 2017 ; Kang et al. , 2017 ), long short-ter m memor y re- cur rent neural networ k (LSTM-RNN) ( Al Hanai et al. , 2018 ; Rejaibi et al. , 2019 ), BLSTM-RNN ( Salekin et al. , 2018 ), deep conv olutional neural networ k - deconv olutional neural netw ork (DCNN-DNN) ( Y ang et al. , 2017a ) and decon v o- lutional neural network multiple instance lear ning (DNN- MIL) ( Salekin et al. , 2018 ). To the best of our know ledge the DCNN-DNN model proposed by ( Y ang et al. , 2017a ) and LSTM-RNN model proposed b y ( Rejaibi et al. , 2019 ) outperformed all the existing approaches. 2.2. Phoneme-lev el Analy sis Most of t he abov e approac hes extract acoustic features from t he entire speech acoustic signal. Few ha ve concen- trated on performing fine-grained analysis on the speech components contr ibuting t he most in the manifes tation of depression in speech and incor porating that in automatic as- sessment systems. Research in psyc hiatr y concentrated on underpinning how speech is affected in depressed patients. Flint et al. ( 1993 ) studied the difference of speech through an analysis of phoneme-lev el variations between healthy sub- jects and depressed patients. The study rev ealed significantly shortened voice onset time (consonant/vo wel time length) and decreased second formant transition (frequency variation of vocal tract shape during production of a dipht hong) and an increased spirantization (presence of aper iodic wa ves, not attribut able to background noise, dur ing t he closure inter v al of stop consonants) compared to controls. Darby et al. ( 1984 ) repor ted a reduction in frequency range of vo wel production in individuals suffer ing from neu- rological and psychological disorders. Esposito et al. ( 2016 ) concentrated on pauses and spectrogram-based consonant/vo wel lengthening analysis to in ves tigate how speech is affected in depression. Building on psychiatric research, Cummins et al. ( 2017 ); Vlasenko et al. ( 2017 ) focused on vo wel-le vel analy - sis to inv estigate t he effect of gender differences in depres- sion and incor porated their findings in vow el-based gender - specific automatic depression recognition system. The au- thors ignored the speech consonant space in their analy sis. Similarl y , in the field of emotion recognition, Ringev al and Chetouani ( 2008 ) build KNN classifiers based on consonant and v ow els phoneme units features characterization. In this paper we in v estigate the reliability of phoneme-lev el f eatures extracted from consonant and vo wel spaces as objectiv e mark - ers of depression. W e extend the state of art in proposing three spectrogram-based deep CNN architectures built on consonant, v ow el and consonant/vow el spaces fusion. 3. Motivations and Contributions A variety of acoustic f eatures (prosodic, source, f ormant, spectral and cepstral) can be extracted from the audio signal, as shown in the related work (section 2 ), to characterize the speech signal f or depression recognition. Spectral f eatures, offering a time-frequency representation of the audio signal, attained robust per f or mance for t his t ask as compared to other audio f eatures ( Ot hmani et al. , 2020 ). T o predict depression, acoustic f eatures are typically f ed to shallow machine lear ning models (eg. Support V ector Machines (SVM), Gaussian Mixture Models (GMM), etc.) ( Alghowinem et al. , 2013 ) or deep lear ning models. Com- pared to shallow models, deep learning models hav e shown higher performances in the recognition of depression due to their capacity to automatically lear n both low and high level descriptors from the patient’ s behaviors wit hout the need of human intervention. Researc h in psyc hiatry concentrated on per f or ming fine- grained analysis on word-le vel speech components contribut- ing to the manif estation of depression in speech and rev ealed significant variations at the phoneme-lev el. On the other hand, research in Machine Lear ning-based automatic recog- nition of depression from speech focused on t he exploration of various acoustic features for t he detection of depression and its sev er ity level. While some features such as prosodic f eatures represent phoneme-lev el variations of the speech signal, most of the state-of-art approaches extract acoustic f eatures from t he entire speech signal, and f ew ha ve focused on incor porating phoneme-lev el speech components in auto- matic depression assessment systems. Other than ( Vlasenko et al. , 2017 ) which proposed a v owel level analysis frame- w ork for speech-based depression recognition, it has not been reported in t he literature any work exploring phoneme-lev el Muhammad Muzammel et al.: Pr epr int submitted to Elsevier P age 3 of 12 AudV ow elConsNet: A Phoneme-Level Based Deep CNN Architecture for Clinical Dep ression Diagnosis Figure 1: Blo ck diagram of p rop osed metho dology for audio vo wels and consonants based depression assessment. units (consonants and vo wels) as objectiv e markers in a deep learning framew ork f or depression recognition. In this work, t he reliability of phoneme-lev el featur es ex- tracted from consonant and vo wel spaces as objective markers of depression is in vestigated. Due to their repor ted efficiency , spectrogram-based f eatures are extracted from the consonant and vow el spaces befor e f eeding t hem into 2 deep architec- tures and fusing them for depression classification. Compared to the st ate-of-the-art, t he presented study is the first to e x- plore phoneme-lev el units in a deep lear ning framew ork f or depression recognition. The contributions of this work can be summarized by the follo wing. • A new high-performing phoneme-lev el based approach f or speech-based automatic depression assessment via deep learning. • In ves tigation of the acoustic characteristics of speech consonant and vo wel spaces and their fusion for de- pression recognition. • Studying and compar ing t he per f or mances of the consonant- based and vo wel-based deep learned acoustic descr ip- tors f or depression assessment. • In ves tigating t he per f or mances of t he fusion of conso- nant and vow el spaces deep lear ned descr iptors com- pared to single space features. 4. Proposed Method W e propose a nov el approach t hat automatically lear ns and fuses vo wel and consonant spaces acoustic features via a deep learning arc hitecture. The proposed approach is consti- tuted of f our steps as shown in Figure 1 . First, patient ’ s speech is extracted from the sound sig- nal in a pre-processing step (Section 4.1 ). Second, voiced segments are extracted from which vo wels and consonants separation is per f or med (Section 4.2 ). Then, data augmen- tation is perf ormed to o vercome ov er-fitting issue relev ant to training Deep Learning Netw orks (Section 4.3 ). Finally , acoustic characteristics of speech vo wel and consonant spaces are extracted and fused t hr ough a deep Conv olutional Neural Netw ork (CNN) architecture, AudV owConsNe t, f or depres- sion detection and severity lev el recognition. (Section 4.4 ). 4.1. Patient Speech Extraction Our approach is based on audio recordings extracted from clinical interviews which constitute con versations between a health practitioner and a patient responding to a validated questionnaire intended to measure depression level. Our approach is based on depression assessment from t he patient ’ s responses to the clinical questions. Thus, we pre-process the recordings to extract t he patient’ s speech from that of the interviewer . 4.2. A udio V o w els and Consonants Separation Patient ’ s v ow els and consonants spaces are e xtracted through two steps. First voiced and unv oiced segments are separated from the patient’ s speech. Then, vo wels and con- sonants are extracted from voiced sounds based on phonetic transcription alignment. 1. Speech Segment ation – V oiced and unv oiced frames are separated using a threshold-based method on time frames of 0 . 01 second in Praat software ( Boersma and W eenink , 2001 ). The follo wing separation threshold values are selected based on previous literature studies ( Boersma and W eenink , 2001 ): • Frames wit h pitch higher t han a pitch ceiling of 500 𝐻 𝑧 are considered as v oiceless. • Frames that do not contain signal amplitudes abov e a Silence Threshold (ST) are considered v oiceless. Let 𝑃 𝐻 be the amplitude of the high- est frame peak and 𝐺𝑃 the amplitude of highest peak in the patient ’ s audio file, then ST is given by : 𝑆 𝑇 = 𝐻 𝑃 − 0 . 03 × 𝐺 𝑃 • A frame is marked as unv oiced if the signal strength of all its samples do not exceed a V oicing Thresh- old (VT) of 0 . 45 . • T o account for consecutive v oiced or unv oiced segments, a V oiced/Un voiced Cost (VUC) is set to 0 . 14 . 2. V ow els and Consonants Separation – V ow els and consonants are extracted from voiced segments based on phoneme lev el transcr iption alignment. This re- quires a cor responding lexicon cont aining phonetic transcription of words present in the cor pus. W e use the Car negie Mellon Univ ersity (CMU) pronouncing dictionary ( Lenzo et al. , 2007 ) transcriptions. The phoneme alignment and vo wel space plotting were per- f ormed using Praat v ocal toolkit and R vo wels package ( Cor re tge , 2019 ), (cf. Figure 2 ). 4.3. Data augmentation Data augmentation is performed to ov ercome t he problem of ov er-fitting and data scarcity and to improv e t he proposed architecture robustness against noise. T wo types of audio augmentation techniques are considered to per turb the con- sonant and vo wel audio signals: N oise Injection and Pitc h Augmentation ( Rejaibi et al. , 2019 ). Muhammad Muzammel et al.: Pr epr int submitted to Elsevier P age 4 of 12 AudV ow elConsNet: A Phoneme-Level Based Deep CNN Architecture for Clinical Dep ression Diagnosis Figure 2: Sepa ration of audio vo wels and consonants using Praat softw are. Da rk blue lines shows the boundaries of vow els. • Noise Injection : random noise is added to t he audio signals. If y is the audio signal and 𝛼 is the noise f actor, then t he noise augmented data 𝑥 is given by : 𝑥 = 𝑦 − 𝛼 × 𝑟𝑎𝑛𝑑 ( 𝑦 ) . W e use 𝛼 = 0 . 01 , 0 . 02 and 0 . 03 . • Pitch Augmentation : Audio sample pitch is low ered by 0 . 5 , 2 , 2 . 5 (in semitones). 4.4. A udV owConsN et Architecture The proposed deep neural netw ork named as AudV ow - ConsNet is the fusion of the vo wels and consonants spectrogram- based CNNs, as shown in Figure 3 . The output from the both architectures are flattened and fused in a fully -connected lay er in order to generate the label prediction for binar y (0 for non- depression and 1 f or depression) and 24 depression sev er ity lev els. 4.4.1. Spectrogram-Based Low-level F eatures Extraction Spectral f eatures attained robust performance for depres- sion detection as compared to other audio f eatures ( Othmani et al. , 2020 ). To extract spectrogram from the or iginal and augmented audio files, Shor t- Time Fourier Transf or m ( S TFT) is applied to t he audio data. Let, 𝑥 [ 𝑛 ] is the audio signal, then the STFT f(n, 𝜔 ) is given by : 𝑓 ( 𝑛, 𝜔 ) = ∞ ∑ 𝑛 =−∞ 𝑥 [ 𝑛 ] 𝑤 [ 𝑛 − 𝑚 ] 𝑒 − 𝑗 𝜔𝑚 (1) f(n, 𝜔 ) is the output of STFT and 𝑤 [ 𝑛 ] is the sliding window that emphasizes the local frequency parameter . The Hann window is selected as the sliding windo w and its equation is given bellow : 𝑤 ( 𝑛 ) = 0 . 5 ( 1 − 𝑐 𝑜𝑠 ( 2 𝜋 𝑛 𝑁 − 1 )) (2) Where N represents the lengt h of t he window and 0 ≤ n ≤ N. The spectrogram is computed by squaring the magnitude of the STFT signal f(n, 𝜔 ): 𝑆 ( 𝑛, 𝜔 ) = | 𝑓 ( 𝑛, 𝜔 ) | 2 (3) The obt ained spectrograms are f ed to t he deep conv olu- tion neural netw orks to extract high lev el features. 4.4.2. Deep learned High-level F eatures Descrip t ors The low -lev el spectral f eatures extracted from t he audio v ow els and consonants are fed to two different Con volutional Neural Netw orks (named: Audio V owels Net and A udio Consonants Net) to extract high-lev el features as shown in Figure 3 . Each of these modalities consist of five conv olu- tional blocks with same lay out str ucture. First two bloc ks composed of a two-dimensional (2D) conv olutional lay er f ol- low ed by a ReLU activation function, a second con v olutional la yer , a ReLU , and maxpooling la yer . While, the remaining three blocks consist of conv olutional la yer , ReL U activation function, a second conv olutional lay er, a ReLU , a t hird conv o- lutional lay er, another R eLU , and finally a maxpooling lay er . The f eature vector size of individual netw ork is 8194. 5. Results and Discussion In this section, we present the different experiments we performed f or depression assessment from speech signals using the proposed deep architecture. W e compare t he per- f ormance of 3 models: 1) Audio V ow els Net trained on t he audio vo wel space, 2) Audio Consonants Net trained on audio consonant space and 3) AudV owelConsN et Net, trained on the fusion of Audio V ow els Net and Audio Consonants Net. Moreov er, we compare the performance of t he three proposed netw orks with state-of-the ar t benchmark approaches. In the f ollowing we present the details concer ning the per f or med experiments. 5.1. Dataset T o ev aluate our proposed model, we use the Distress Anal- ysis Inter vie w Cor pus Wizard-of-Oz dataset (D AIC- WOZ) ( Gratch et al. , 2014 ). DAIC- WOZ contains clinical inter- view s recorded to in vestig ate different psychological distress conditions suc h as depression, anxiety , and post-traumatic stress disorder . The dataset is composed of 189 audio record- ings of par ticipants inter vie ws with a vir tual interviewer . All audio recordings are labeled b y t he PHQ-8 scores (depres- sion sev er ity level, [0-23] range) and t he PHQ-8 binar y (1/0 depressed vs. not depressed). The av erage length of the audio recordings is 15 minutes with a sampling rate of 16 𝑘𝐻 𝑧 . For technical reasons, in this study , only 182 participants audio recordings are used. For all experiments, the dataset is randomly divided into 80% f or training, 10% f or validation and 10% f or testing. 5.2. Evaluation Metrics The proposed approach is ev aluated using Precision, Re- call, F1-score, Root Mean Square Er ror (RMSE), Pearson Cor relation Coefficient (CC) and Concordance Coefficient Cor relation (CCC) ( La wrence and Lin , 1989 ). 𝐶 𝐶 𝐶 is a measure of the ag reement between t he predicted and true de- pression scores. Let 𝑇 𝑟𝑢𝑒 and 𝑃 𝑟𝑒𝑑 be t he tr ue and predicted depression score v ectors, then 𝐶 𝐶 𝐶 is giv en by: 𝐶 𝐶 𝐶 ( 𝑇 𝑟𝑢𝑒, 𝑃 𝑟𝑒𝑑 ) = 2 𝐶 𝐶 𝜎 𝑇 𝑟𝑢𝑒 𝜎 𝑃 𝑟𝑒𝑑 𝜎 2 𝑇 𝑟𝑢𝑒 + 𝜎 2 𝑃 𝑟𝑒𝑑 + ( 𝜇 𝑇 𝑟𝑢𝑒 − 𝜇 𝑃 𝑟𝑒𝑑 ) 2 Muhammad Muzammel et al.: Pr epr int submitted to Elsevier P age 5 of 12 AudV ow elConsNet: A Phoneme-Level Based Deep CNN Architecture for Clinical Dep ression Diagnosis Figure 3: The proposed AudV ow elConsNet architecture: a phoneme-level based CNN that fuses vo wel and consonant acoustic features via a deep learning framew ork. T able 1 Prop osed deep neural netw orks (Audio V ow els Net, Audio Consonants Net and AudVo wConsNet) p erfo rmances fo r depression assessment tasks (PHQ-8 Binary and Score) in terms of Accuracy , RMSE, CC, and CCC. Net wo rk PHQ-8 Bina ry PHQ-8 Sco re A ccuracy (%) CC CCC A ccuracy (%) CC CCC Audio Vo w els Net 78.77 0.58 0.57 54.26 0.59 0.58 Audio Consonants Net 80.98 0.62 0.61 57.57 0.61 0.61 AudV ow elConsNet 86.06 0.72 0.72 70.86 0.73 0.73 (4) 𝜎 𝑇 𝑟𝑢𝑒 and 𝜎 𝑃 𝑟𝑒𝑑 represent the standard deviations of vari- ables 𝑇 𝑟𝑢𝑒 and 𝑃 𝑟𝑒𝑑 , and 𝜇 𝑇 𝑟𝑢𝑒 and 𝜇 𝑃 𝑟𝑒𝑑 represents their respectiv e means. 5.3. Netw ork Implementation Details Both vo wels and consonants-based CNN architectures are constituted of five blocks. The number of con volution filters ( 𝑁 ) for each block, from input to output, is set to 𝑁 = [64 , 128 , 256 , 512 , 512] . For all conv olutional lay ers, we use a filter size of 3 × 3 . The stride and pool size of the max pooling la yer are 2 × 2 . In both netw orks, RELU is used as activation function for all con volutional and fully connected la yers. For AudV ow - elConsNet, two fully connected lay ers are used with RELU as activation function. For all three networ ks, to predict the PHQ-8 binary , t he output lay er is a dense la yer of size 2 with a Softmax activation function. T o predict the PHQ-8 scores (24 lev els), an output dense lay er of size 24 neurons is used with a Softmax activation function. The proposed models are trained with the RMSE as loss function and the A dam optimizer with a learning rate of 10 − 5 and a deca y of 10 − 6 . The batch size is set to 120 samples. The number of epochs f or training is set to 500 . An early stopping is per f ormed when the loss function stops impro ving after 10 epochs. 5.4. P erformance Anal ysis of Proposed Netw orks All three spectrogram based CNN netw orks (Audio V ow - els Net, Audio Consonants Net and AudV ow elConsNe t) are trained to deliv er the PHQ-8 binar y and PHQ-8 scores. 5.4.1. Com parison between the 3 proposed networ ks T able 1 summar izes the resulting per f or mances of all three networks on the testing set. R esults show that Audio Consonants Net performs better in terms of accuracy com- pared to Audio V ow els Net for both depression assessment tasks: PHQ-8 Binar y ( 80 . 98% vs. 78 . 77% ) and PHQ-Score ( 57 . 57% vs. 54 . 76% ). The higher CC & CCC confir m the per- f ormance. The improv ed per f ormance by the consonants net ov er t he vo wels one might be due to t he fact t hat consonants require more precise ar ticulation than vo wels. Therefore, t his leads to a strong er manifes tation of pronunciation differences of consonants in depressed and non-depressed scenar ios lead- ing to better results as compared to vo wels. Fusion of audio v ow els and consonants spectrogram- based deep learning descr iptors, significantly boosts the per- f ormance. AudV owConstN et achie ves significantly higher accuracy and better CC and CCC compared to both A udio V ow els Net and Audio Consonants Net for both tasks. An ac- curacy of 86 . 06% and 70 . 86% are obtained f or PHQ-8 binar y and PhQ-8 scores, respectivel y . For PHQ-8 binary , fusion model accuracy is improv ed by 7 . 99% with respect to Audio V ow els Net and by 5 . 08% with respect to Audio Consonants Muhammad Muzammel et al.: Pr epr int submitted to Elsevier P age 6 of 12 AudV ow elConsNet: A Phoneme-Level Based Deep CNN Architecture for Clinical Dep ression Diagnosis T able 2 Compa rison of the proposed deep neural netw orks architectures for PHQ-8 binary assessment fo r the tw o binary classes of Dep ression (D) and Non-Depression (ND). Metho d A ccuracy (%) A UC Sco re Precision (%) Recall (%) F1-Sco re (%) D ND D ND D ND A v. Audio Vo w els Net 78.77 0.75 67 84 66 85 66 85 78.99 Audio Consonants Net 80.98 0.76 73 84 64 89 68 86 80.30 AudV ow elConsNet 86.06 0.83 81 88 73 92 77 90 85.85 29.83 % Depressed 70.17 % Non-Depressed (a) Partition of depressed and non- depressed participants. 0 1 2 3 4 5 6 7 8 9 10 11 12 13 14 15 16 17 18 19 20 21 22 23 0 5 10 15 20 12 8 6 6 5 2 3 4 2 6 5 5 4 1 0 2 2 1 2 1 3 1 1 1 13 9 11 9 5 8 3 9 3 2 5 2 3 2 1 3 3 3 2 1 1 0 0 0 Female Male (b) Participants repartitions across the severity lev els of the PHQ test. Figure 4: Dep ression and severity level repartitions of the participants within the DAIC-W OZ Corpus. (a) Depressed versus Non-Dep ressed pa rticipants. The PHQ-8 bina ry of Depressed participants is 1 and the PHQ-8 binary of Non-Depressed participants is 0. (b) P articipants repa rtitions across the 24 depression severit y levels given by the PHQ-8 test. Net accuracy . Similarl y , f or PHQ-8 Score, the accuracy is impro v ed by 16 . 6% and 13 . 29% with respect to t he other two models. The Audio V owels and Audio Consonants Nets sep- arately are not very robust in the assessment of depression. It is the aggregation of both netw orks that captures higher-le vel f eatures which are able to better discriminate the lev el of depression. The DAIC- W OZ dat aset presents an unbalanced num- ber of samples as sho wn in Figure 4 . The number of non- depressed par ticipants is three times higher t han that of de- pressed participants. Moreov er , the number of samples for each score is not balanced. This imbalance could affect the performance of the proposed models in detecting depression. For t hat, in T able 2 , we compare t he per f or mance of the PHQ-8 binar y proposed netw orks for Depression (D) and Non-Depression (ND) classes in ter ms of precision, recall and F -score. W e also provide the accuracy and A UC score in the same table. One can notice that AudioV ow elConsNet obtained significantly higher values of precision, recall and F1-score f or each of the binar y classes as compared to both audio vo wels and consonants spectrogram based CNN net- w orks. The fusion of consonant and vo wel deep lear ning descriptors significantly enhanced its per f ormance for the classification of Depression and Non-Depression. Furt her - more, f or the Non-Depression class the model obt ained 88% , 92% and 90% values of precision, recall and F1 score, respec- tivel y . The precision of AudioV ow elConsNet for Depression class is higher by 8% and 14% as compared to Audio Conso- nants Net and Audio V ow els Net, respectivel y . Moreov er, the increment in precision has been obser v ed f or Non-Depression class f or AudioV ow elConsNet as compared to other models. Furt hermore, Audio Consonants Net achiev es higher preci- sion f or the Depression class as compared to Audio V ow els Net. For Non-Depression class, the precision value is almost same. Figure 5 shows the confusion matr ix for all t hree experi- ments in ter ms of PHQ-binar y classes. For AudV ow elCon- sNet a significant increment is obser v ed in tr ue positiv e (pre- diction f or Depression) and true negative (Non-Depression) values. An increase of 7 . 49% and 3 . 28% in tr ue negativ e predictions (i.e., non-depression class) has been obser v ed as compared to Audio V owels Net and Audio Consonants Net, respectiv ely . Similarly , for depression class an increment of 6 . 88% and 9% has been noted as compared Audio V owels Net and Audio Consonants Net, respectivel y . Fur thermore, a significant decrement in f alse positives can be seen in Fig- ure 5 . These results sho w that the fusion f eatures pro vide a meaningful impro vement in the per f ormance of t he networ k. Figure 6 show s the compar ison in terms of F-score, preci- sion and recall between the 24 PHQ-8 sev er ity levels predic- tion by the proposed networ ks. From the figure, we notice a similar trend in the per f or mance of t he t hree netw orks. Audio Consonants Net achiev es a slightly better per f or mance com- pared to Audio V ow els Net for all lev els. AudV owConsNet outperforms t he other networks f or all sev er ity lev els. Par - ticularl y , the highest results are obtained f or lev el 23 by the AudV owConsN et with an F-score of 83% , follo wed by t he Audio Consonants Net ( 75% ) and Audio V owels Net ( 71% ). Regar ding Precision, f or the AudV owConsNe t, the high- est precision value of 86% is obtained f or sev er ity levels 22 and 23 (cf. Figure 6b . On the other hand, the low est precision value of 68% is obt ained f or levels 15 and 21 , respectively . For Audio V ow els Net and Audio Consonants N et, the high- Muhammad Muzammel et al.: Pr epr int submitted to Elsevier P age 7 of 12 AudV ow elConsNet: A Phoneme-Level Based Deep CNN Architecture for Clinical Dep ression Diagnosis Predicted A ctual ND D total ND 12091 57.87% 2246 10.75% 14337 84.33% 15.67% D 2190 10.48% 4367 20.90% 6557 33.40% 66.60% total 14281 6613 84.66% 33.96% 15.34% 66.04% (a) Audio V ow els Net Predicted A ctual ND D total ND 12692 60 . 74% 2386 11 . 42% 15078 84 . 18% 15 . 82% D 1589 7 . 61% 4227 20 . 23% 5816 27 . 32% 72 . 68% total 14281 6613 88 . 87% 36 . 08% 11 . 13% 63 . 92% (b) Audio Consonants Net Predicted A ctual ND D total ND 13160 62.98% 1791 8.57% 14951 88.02% 11.98% D 1121 5.37% 4822 23.08% 5943 18.86% 81.14% total 14281 6613 92.15% 27.08% 7.85% 72.92% (c) AudV owelConsNe t Figure 5: Confusion matrix of all three experiments for bina ry dep ression assessment tasks. (a) Recall (b) Precision (c) F-score Figure 6: Compa rison of the p erfo rmances of the proposed deep neural netw orks architectures in the prodiction of the the 24 PHQ-8 depression severity levels on the test set in terms of Recall, Precision and F-score. est obt ained precision values are 73% and 74% , respectivel y . Furt hermore, the recall values of all three models are com- pared for each lev el. The comparison is presented in a Figure 6 . A notable difference can be obser v ed between the recall values obtained for AudV owConsN et and the values obt ained f or other models. For AudV owConsN et the highest recall value of 86% is obt ained for lev el 15 . While, the minimum value of 57% is obtained for lev el 21 . Furt hermore, we present the AudV ow elConsNet perfor - mances ov er the training epochs. Figure 7 represents the training and validation curves in terms of accuracy and loss f or PHQ binar y classes, while Figure 8 show s the training and validation curves f or PHQ-Score. A decrease in loss is observed f or both experiments. After a cert ain number of epochs, the validation loss cur ves tend to flatten. Theref ore, Muhammad Muzammel et al.: Pr epr int submitted to Elsevier P age 8 of 12 AudV ow elConsNet: A Phoneme-Level Based Deep CNN Architecture for Clinical Dep ression Diagnosis (a) Training and validation accuracy (b) Training and validation loss Figure 7: T raining and validation loss and accuracy curves in terms of training ep ochs of AudVo welConsNet fo r PHQ-binary classes with an early stopping. (a) Training and validation accuracy . (b) Training and validation loss. Figure 8: T raining and validation loss and accuracy curves in terms of training epho cs of AudVo welConsNet for PHQ-8 24 classes with an early stopping. we per f or m earl y stopping in both experiments. Similarly , f or both experiments, training and testing accuracy stopped increasing af ter a cer tain number of epochs. W e notice fe w fluctuations in training and validation loss cur v es bef ore the curves reach stability . This demonstrates that t he AudV owel- ConsNet does not ov er fit at t he end of training and validates its capacity to generalize to a new dat aset. 5.4.2. Com parison with state-of-the-art approac hes PHQ-8 Binary – T able 3 repor ts the Precision, Re- call and F1-score of AudV owelCons tNet compared to deep learning-based state-of-t he-art approaches of Ma et al. ( 2016 ), Salekin et al. ( 2018 ), Othmani et al. ( 2020 ), and Rejaibi et al. ( 2019 ) for the Depression and Non-depression PHQ-8 binary classes. Additionall y , t he t able summar izes t he av erage F- score, Accuracy , RMSE and CC f or t his task. W e can see that AudioV o welConsN et obtained significantly higher values of Precision, Recall and F1-score f or both classes (Depression and Non-Depression) as compared to existing state-of-t he-art methods. For the Depression class, the model obtained a pre- cision of 81% , a recall of 73% and an F1-score of 77% . Com- pared to EmoAudioNet ( Othmani et al. , 2020 ) and MFCC- based RNN method of ( Rejaibi et al. , 2019 ), AudioV ow elCon- sNet predicts t he Depression class more accurately increasing Precision by 43 . 92% and 17 . 39% respectiv ely . Moreov er , an increase of 10 . 72% and 12 . 82% in Non-Depression precision value is obtained with respect to ( Othmani et al. , 2020 ) and ( Rejaibi et al. , 2019 ). Compared to Ma et al. ( 2016 ), F1- score is increased by 65 . 1% on a verage and by 28 . 57% f or Non-Depression class using t he AudioV ow elConsNet. Audio V ow els and Audio Consonants Ne ts achie ved precision of 84% f or Non-Depression class and precision values of 67% and 73% respectivel y for Depression class outper f or ming the state of art methods (cf. T able 2 ). Salekin et al. ( 2018 ) reported an accuracy of 96 . 7% and an F1-Score of 85 . 44% . AudV o welConsN et results in a low er accuracy ( 86 . 06% ) and a similar F1-Score ( 85 . 85% ). This might be due to t he leav e- one-speaker out model ev aluation strategy used by Salekin et al. ( 2018 ). Compared to the other proposed approaches where a simple train-test split strategy is adopted, training the model on multiple train-test splits increases the model performance especially in small datasets. Similarly , f or PHQ- binary an increment of 16 . 09% and 12 . 84% in accuracy is obtained as compared to EmoAudioNet ( Othmani et al. , 2020 ) and MFCC-based RNN method ( Rejaibi et al. , 2019 ), respec- tivel y . PHQ-8 sev erity lev el – T able 4 summar izes state-of-the- art comparison results f or predicting the depression sev erity lev els in ter ms of RMSE. The proposed AudV owelConsN et performs better ( 0 . 1429 ) than the MFCC-based Recurrent Neural N etw ork arc hitecture ( Rejaibi et al. , 2019 ) ( 0 . 168 ), EmoAudioNe t (fusion of MFCC and Spectorgram based CNN Netw orks) ( Ot hmani et al. , 2020 ) ( 0 . 18 ). While t he ap- proach of Y ang et al. ( 2017b ) has the best non-scaled RMSE of ( 1 . 46 f or depressed male) for the PHQ-8 scores predic- tion. AudV owelConsN et comes in a close second with a non-normalized RMSE of 3 . 22 . 5.5. Discussion In this section we discuss the limitations and strengths of the proposed method with respect to the state of t he ar t ap- proaches. Moreover , we discuss the managerial implications of this approach for practice in psychiatry . Muhammad Muzammel et al.: Pr epr int submitted to Elsevier P age 9 of 12 AudV ow elConsNet: A Phoneme-Level Based Deep CNN Architecture for Clinical Dep ression Diagnosis T able 3 Compa rison of the p erformances of the p rop osed deep neural net wo rks with state of the art methods for p redicting the PHQ-8 bina ry for depression recognition in terms of Precision, Recall and F-Score. (D) and (ND) are for Dep ression and Non-Dep ression classes, resp ectively . The table also summrizes the average F-score, A ccuracy , RMSE and CC. Metho d Precision (%) Recall (%) F-Score (%) Acc. (%) RMSE CC D ND D ND D ND Av. Ma et al. ( 2016 ) 35 100 100 54 — 70 52 — — — Salekin et al. ( 2018 ) — — — — — — 85.44 96.7 — — Othmani et al. ( 2020 ) 56.28 79.48 45.11 85.85 50 83 75.39 74.13 0.47 0.51 Rejaibi et al. ( 2019 ) 69 78 35 94 46 85 80.00 76.27 0.41 — AudV ow elConsNet 81 88 73 92 77 90 85.85 86.06 0.37 0.72 T able 4 Severit y level compa rison of AudV owConsNet with existing state of the art metho ds fo r dep ression assessment. ( 𝐷𝑀 ) : Dep ressed Male. ( 𝑁 𝑜𝑟𝑚 ): Normalized RMSE Metho d RMSE V alstar et al. ( 2016 ) 7.78 Y ang et al. ( 2017a ) 5 . 59 𝐷𝑀 Y ang et al. ( 2017b ) 1 . 46 𝐷𝑀 Othmani et al. ( 2020 ) 0 . 18 𝑁 𝑜𝑟𝑚 Rejaibi et al. ( 2019 ) 0 . 17 𝑁 𝑜𝑟𝑚 AudV ow elConsNet 0 . 14 𝑁 𝑜𝑟𝑚 | 3.22 5.5.1. S tr engths and Limit ations In this research, a new approach is presented to separate v ow els and consonants from t he speech and build a deep learning model combining high lev el f eatures lear ned from such phoneme-lev el units f or depression recognition. There are many existing models which detect clinical depression using speech. Y et, t hese models did not provide informa- tion about which por tion of speech is mostly effected by the clinical depression. By analyzing consonants and vo wels separately , the proposed approach helped to understand t he effect of depression on human pronunciation. Particularly , it allow ed to understand which par t of t he speech (consonants or vo wels) is more affected by depression. The results re- vealed that the speech consonants space is more affected in the depressed speech compared to the vo wels space. Furt hermore, most of the existing approaches extract fea- tures from the patient’ s full speech (i.e., including voiced and un voiced segments). In t his research, t he removal of un w anted speechless segments reduces the noise in depres- sion detection and leads to a better accuracy as compared to the existing state of the ar t approaches ( Salekin et al. , 2018 ; Rejaibi et al. , 2019 ; Othmani et al. , 2020 ). Finall y , the proposed AudV owConsN et can be applied f or other speech-related applications. Extracting deep features from t he vo wels and from consonants separately could be a strong behavioural biomarker and a strong biometric trait for gender , ethnicity , dialect and emotion recognition. Howe ver , this statement mer its fur ther in ves tigation. On the other hand, t his research presents cer tain limit a- tions. For instance, the proposed approach was limited to audio vo wels and consonants based spectral featur es. While, many models extracted MFCC, spectral f eatures and other f eatures from t he patient speech ( Othmani et al. , 2020 ; Rejaibi et al. , 2019 ). Theref ore, a fur ther research can be per f ormed to extract different acoustic features from acoustic vo wels and consonants and compare the per f ormance to the proposed model. Moreov er, separating the speech signal to tw o separate phoneme units which are lear ned separately wit h two deep netw orks doubles t he needed comput ational pow er . This makes t he ubiquitous deployment of such model on resource limited platforms such as mobile or embedded platforms v er y challenging. 5.5.2. Managerial Implications for Practice The proposed approac h meets the growing demand f or the development of computer-aided diagnosis systems and artificial medical assistants using AI techniques in psyc hiatry . Such AI-based sys tems can assist clinicians in making more accurate predictions of ment al illness diagnosis and complement the potential misdiagnosis of inter view -based diagnosis practices con ventionall y used by such health prac- titioners. An essential requirement for the de velopment of reliable AI-based systems is to detect propitious behavioural biomarkers capable of reflecting pat hological attr ibutes of psyc hiatric disorders. The proposed approach ha ve the potential to be applied f or real-wor ld applications in sev eral f orms including arti- ficial medical assistants, web applications, computer-aided diagnosis systems, etc. Such applications, can be integrated in the treatment plan allowing to complement conv entional therapies by facilitating: • Patient monitor ing: monitor patient’ s vocal activity and prev ent t he onset of a mental health cr isis by seek - ing the health practitioner’ s aid at the r ight time or by using support g roups. Muhammad Muzammel et al.: Pr epr int submitted to Elsevier P age 10 of 12 AudV ow elConsNet: A Phoneme-Level Based Deep CNN Architecture for Clinical Dep ression Diagnosis • Interventions recommendations: detect depressive episodes and recommend personalized inter v entions to assist users in maintaining an emotional balance. 6. Conclusion and Future W ork In this paper, we propose an Artificial Intelligence (AI) based application f or clinical depression recognition and as- sessment from speech. A deep phoneme-lev el analysis and learning is per f or med and t hree spectrogram-based CNNs netw orks t hat rely on v ow el, consonant spaces and fusion of both are studied. Consonant based CNN architecture outper- f orms t he vo wel CNN network. The fusion of both networ ks impro ves significantl y the results and a notable increment in per f or mance is obser ved. Further, we compare the fu- sion netw ork (named AudV ow elConsNet) with state of the art benchmark approaches on the D AIC-W OZ dataset. Our model outper f orms all e xisting state-of-the-ar t approac hes in depression recognition. These results sho w that the pro- posed deep lear ning based analysis of v ow els and consonants is highly reliable in automatic diagnosis of clinical depres- sion. In future w ork, we aim to verify these findings on other depression-speech dat abases. Moreo ver , we are interested in studying the fusion of different modalities such as audio, textual, and visual modalities f or more accurate AI-based application f or clinical depression recognition. As a matter of fact, depressed individuals tend to speak slow ly and use simple phrases in their speech, compared to non-depressed individuals which express their positive f eelings in speech. Theref ore, e xplor ing techniques for automatic speec h tran- scription and the extraction of discr iminativ e linguistic fea- tures to complement acoustic based features present a future direction f or this wor k. Furt hermore, as the aim of this research w as to inv esti- gate the contributions of v ow els and consonants in depres- sion recognition, un voiced segments were remo ved from the patient speech. The remov al of these un v oiced segments im- pro ved the per f or mance of proposed model. Y et, depressed individuals tend to hav e more un v oiced segments as com- pared to voiced segments in speech. In t he future, we plan to in v estigate t he integ ration of t he silence duration as a f eature within the proposed model. Ref erences Al Hanai, T., Ghassemi, M. M., and Glass, J. R. (2018). Detecting depression with audio/text sequence modeling of inter view s. In Interspeec h , volume 2522, pages 1716–1720. Alghowinem, S., Goecke, R., W agner, M., Epps, J., Gedeon, T., Break spear , M., and Parker , G. (2013). A comparative study of different classifiers f or detecting depression from spont aneous speech. In 2013 IEEE Inter- national Confer ence on Acoustics, Speech and Signal Processing , pages 8022–8026. IEEE. Asgari, M., Shafran, I., and Sheeber, L. B. (2014). Inferring clinical depres- sion from speech and spoken utterances. In 2014 IEEE International W orkshop on Machine Learning for Signal Processing (ML SP) , pages 1–5. IEEE. Blais, M. and Baer, L. (2009). Understanding rating scales and assessment instruments. In Handbook of clinical rating scales and assessment in psychiatry and mental health , pages 1–6. Springer . Boersma, P . and Weenink, D. (2001). Praat, a system for doing phonetics by computer . Glot. International , 5(9):341–345. Corretge, R. (2019). Praat vocal toolkit: A praat plugin with auto- mated scr ipts for v oice processing. Sof twar e packag e available at: (http://www .praatv ocaltoolkit.com/index.html) . Cummins, N., Scherer, S., Krajew ski, J., Schnieder , S., Epps, J., and Quatier i, T . F . (2015). A review of depression and suicide risk assessment using speech analysis. Speec h Communication , 71:10–49. Cummins, N., Vlasenko, B., Sagha, H., and Schuller, B. (2017). Enhancing speech-based depression detection through gender dependent vo wel-le vel f ormant f eatures. In Confer ence on Ar tificial Intelligence in Medicine in Europe , pages 209–214. Spr ing er . Darby , J. K., Simmons, N., and Berger , P . A. (1984). Speech and voice parameters of depression: A pilot study . Jour nal of Communication Disorder s , 17(2):75–85. De Jong, K. (2003). T emporal constraints and characterising syllable str uc- turing. In Phonetic inter pr etation. P apers in laboratory phonology VI , pages 253–268. Cambridge University Press Cambr idge. de Melo, W . C., Granger , E., and Lopez, M. B. Encoding temporal informa- tion for automatic depression recognition from facial analysis. Dham, S., Shar ma, A., and Dhall, A. (2017). Depression scale recognition from audio, visual and text analysis. arXiv preprint . Dinkel, H., Zhang, P ., Wu, M., and Y u, K. (2019). Depa: Self- supervised audio embedding for depression detection. arXiv preprint arXiv:1910.13028 . EII, M., Clements, M. A., Peif er, J. W ., and W eisser, L. (2007). Cr itical analy sis of the impact of glottal features in the classification of clinical depression in speech. IEEE transactions on biomedical engineering , 55(1):96–107. Esposito, A., Esposito, A. M., Likforman-Sulem, L., Maldonato, M. N., and Vinciarelli, A. (2016). On the significance of speech pauses in depressive disorders: results on read and spontaneous nar rativ es. In Recent advances in nonlinear speech processing , pages 73–82. Spr inger . Farooq, M. and Mahmood, A. (2018). Acoustic analysis of front vow els and/æ/ in pakistani punjabi english. International Journal of English Linguistics , 8(1). Flint, A. J., Black, S. E., Campbell- Ta ylor, I., Gailey , G. F ., and Levinton, C. (1993). Abnormal speech articulation, psychomo tor retardation, and subcortical dysfunction in major depression. Journal of psychiatric resear ch , 27(3):309–319. France, D. J., Shiavi, R. G., Silverman, S., Silverman, M., and Wilkes, M. (2000). Acoustical properties of speech as indicators of depression and suicidal r isk. IEEE transactions on Biomedical Engineering , 47(7):829– 837. Gratch, J., Artstein, R., Lucas, G. M., Stratou, G., Scherer, S., Nazarian, A., W ood, R., Boberg, J., DeV ault, D., Marsella, S., et al. (2014). The distress analysis inter vie w cor pus of human and computer inter view s. In LREC , pages 3123–3128. Citeseer . Greenberg, P . E., Four nier , A.- A., Sisitsky , T ., Pike, C. T., and Kessler, R. C. (2015). The economic burden of adults with major depressive disorder in the united states (2005 and 2010). The Jour nal of clinical psychiatry , 76(2):155–162. Gupta, R., Sahu, S., Espy- Wilson, C. Y ., and Nara yanan, S. S. (2017). An affect prediction approach through depression severity parameter incor- poration in neural networks. In INTERSPEECH , pages 3122–3126. Jiang, H., Hu, B., Liu, Z., W ang, G., Zhang, L., Li, X., and Kang, H. (2018). Detecting depression using an ensemble logistic regression model based on multiple speech features. Computational and mathematical methods in medicine , 2018. Kang, Y ., Jiang, X., Yin, Y ., Shang, Y ., and Zhou, X. (2017). Deep transf or- mation lear ning for depression diagnosis from facial images. In Chinese Confer ence on Biometric Recognition , pages 13–22. Springer . Kanter, J. W ., Busch, A. M., W eeks, C. E., and Landes, S. J. (2008). The na- ture of clinical depression: Symptoms, syndromes, and behavior analysis. The Behavior Analyst , 31(1):1–21. Kraepelin, E. (1921). Manic depressive insanity and paranoia. The Jour nal of Nervous and Mental Disease , 53(4):350. Kvedalen, E. (2003). Signal processing using t he teager energy operator Muhammad Muzammel et al.: Pr epr int submitted to Elsevier P age 11 of 12 AudV ow elConsNet: A Phoneme-Level Based Deep CNN Architecture for Clinical Dep ression Diagnosis and other nonlinear operators. Master , Univer sity of Oslo Department of Informatics , 21. La wrence, I. and Lin, K. (1989). A concordance cor relation coefficient to ev aluate reproducibility . Biometrics , pages 255–268. Lenzo, K. et al. (2007). The cmu pronouncing dictionar y . Car negie Melon Univ ersity , 313. Liu, Z., Hu, B., Y an, L., W ang, T ., Liu, F., Li, X., and Kang, H. (2015). Detection of depression in speech. In 2015 inter national confer ence on affective computing and intelligent interaction (ACII) , pages 743–747. IEEE. Lopez-Otero, P ., Docio-Fer nandez, L., and Garcia-Mateo, C. (2015). Assess- ing speaker independence on a speech-based depression level estimation system. Patt ern Recognition Letters , 68:343–350. Low , L.-S. A., Maddage, N. C., Lech, M., Sheeber, L. B., and Allen, N. B. (2010). Detection of clinical depression in adolescents’ speech dur ing famil y interactions. IEEE T ransactions on Biomedical Engineering , 58(3):574–586. Ma, X., Y ang, H., Chen, Q., Huang, D., and W ang, Y . (2016). Depaudionet: An efficient deep model for audio based depression classification. In Proceedings of the 6th International Wor kshop on Audio/Visual Emotion Challeng e , pages 35–42. ACM. Mitchell, A. J., V aze, A., and Rao, S. (2009). Clinical diagnosis of depression in primar y care: a meta-analy sis. The Lancet , 374(9690):609–619. Moore, E., Clements, M., Peifer , J., and W eisser , L. (2004). Compar ing objective feature statistics of speech for classifying clinical depression. In The 26th Annual International Conference of the IEEE Engineer ing in Medicine and Biology Society , volume 1, pages 17–20. IEEE. Olay a-Contreras, P ., Persson, T., and Styf, J. (2010). Compar ison between the beck depression inv entory and psychiatric ev aluation of distress in patients on long-term sick leav e due to chronic musculoskeletal pain. Journal of multidisciplinar y healthcare , 3:161. Othmani, A., K adoc h, D., Bentounes, K., Rejaibi, E., Alfred, R., and Hadid, A. (2020). T ow ards robust deep neural networks for affect and depression recognition. ICPR 2020. Pampouchidou, A., Simantiraki, O., V azakopoulou, C.-M., Chatzaki, C., Pediaditis, M., Mar idaki, A., Marias, K., Simos, P ., Y ang, F ., Meriaudeau, F ., et al. (2017a). Facial geometry and speech analysis for depression detection. In 2017 39th Annual International Confer ence of the IEEE Engineering in Medicine and Biology Society (EMBC) , pages 1433–1436. IEEE. Pampouchidou, A., Simos, P ., Mar ias, K., Mer iaudeau, F., Y ang, F ., Pediadi- tis, M., and T siknakis, M. (2017b). Automatic assessment of depression based on visual cues: A systematic review . IEEE T ransactions on Affec- tive Computing , 10(4):445–470. Rejaibi, E., Komaty , A., Meriaudeau, F., Agrebi, S., and Ot hmani, A. (2019). Mfcc-based recur rent neural netw ork f or automatic clinical depression recognition and assessment from speech. arXiv pr epr int arXiv:1909.07208 . Ringe val, F. and Chetouani, M. (2008). Exploiting a vo wel based approach f or acted emotion recognition. In V erbal and nonverbal f eatures of human- human and human-machine inter action , pages 243–254. Spr ing er . Ringe val, F ., Schuller, B., V alstar, M., Gratch, J., Cowie, R., Scherer , S., Mozgai, S., Cummins, N., Schmitt, M., and Pantic, M. (2017). A vec 2017: Real-lif e depression, and affect recognition w orkshop and challeng e. In Proceedings of the 7th Annual Workshop on Audio/Visual Emotion Challeng e , pages 3–9. ACM. Rush, A. J., Trivedi, M. H., Ibrahim, H. M., Car mody , T. J., Ar no w, B., Klein, D. N., Marko witz, J. C., Ninan, P . T ., Kornstein, S., Manber, R., et al. (2003). The 16-item quick inv entor y of depressive symptomatology (qids), clinician rating (qids-c), and self-repor t (qids-sr): a psychome- tric evaluation in patients wit h chronic major depression. Biological psychiatry , 54(5):573–583. Salekin, A., Eberle, J. W ., Glenn, J. J., T eachman, B. A., and Stanko vic, J. A. (2018). A weakly supervised lear ning framew ork for detecting social anxiety and depression. Proceedings of the A CM on interactiv e, mobile, wear able and ubiquitous technologies , 2(2):81. Scherer , S., Lucas, G. M., Gratch, J., Rizzo, A. S., and Morency , L.-P . (2015). Self-repor ted symptoms of depression and ptsd are associated with reduced vow el space in screening inter vie ws. IEEE T ransactions on Affective Computing , 7(1):59–73. Song, S., Jaiswal, S., Shen, L., and V alstar, M. (2020). Spectral represent a- tion of behaviour pr imitives for depression analysis. IEEE T ransactions on Affective Computing . Song, S., Shen, L., and V alstar, M. (2018). Human behaviour -based auto- matic depression analysis using hand-crafted statistics and deep learned spectral features. In 2018 13th IEEE International Conference on Auto- matic F ace & Gesture Recognition (FG 2018) , pages 158–165. IEEE. Sundaram, N., Smolenski, B. Y ., and Y antorno, R. (2003). Instantaneous nonlinear teager energy operator for robust voiced–un voiced speech clas- sification. Speech processing . Trigeor gis, G., Ringev al, F., Br uec kner, R., Marchi, E., Nicolaou, M. A., Schuller , B., and Zaf eiriou, S. (2016). Adieu features? end-to-end speech emotion recognition using a deep con volutional recurrent network. In 2016 IEEE inter national conference on acoustics, speech and signal processing (ICASSP) , pages 5200–5204. IEEE. V alstar, M., Gratch, J., Schuller , B., Ringeval, F., Lalanne, D., Torres Torres, M., Scherer , S., Stratou, G., Cowie, R., and Pantic, M. (2016). A vec 2016: Depression, mood, and emotion recognition workshop and challenge. In Proceedings of the 6th international workshop on audio/visual emotion challeng e , pages 3–10. ACM. Vlasenko, B., Sagha, H., Cummins, N., and Schuller, B. W . (2017). Imple- menting gender -dependent vow el-level anal ysis f or boosting speech-based depression recognition. In INTERSPEECH , pages 3266–3270. W are, S., Y ue, C., Morillo, R., Lu, J., Shang, C., Bi, J., Kamath, J., Russell, A., Bamis, A., and W ang, B. (2020). Predicting depressive symptoms using smar tphone data. Smar t Health , 15:100093. WHO (2017). Depression and other common mental disorders: global health estimates. T echnical repor t, W orld Health Organization. Williams, J. B. (1988). A structured interview guide for the hamilton de- pression rating scale. Arc hives of general psychiatry , 45(8):742–747. Williams, L. S., Brizendine, E. J., Plue, L., Bakas, T ., Tu, W ., Hendrie, H., and Kroenke, K. (2005). Performance of the phq-9 as a screening tool f or depression af ter stroke. str oke , 36(3):635–638. Y ang, L., Jiang, D., Xia, X., Pei, E., Oveneke, M. C., and Sahli, H. (2017a). Multimodal measurement of depression using deep learning models. In Proceedings of the 7th Annual Workshop on Audio/Visual Emotion Challeng e , pages 53–59. ACM. Y ang, L., Sahli, H., Xia, X., Pei, E., Oveneke, M. C., and Jiang, D. (2017b). Hybrid depression classification and estimation from audio video and text inf ormation. In Proceedings of the 7th Annual Wor kshop on Audio/Visual Emotion Challenge , pages 45–51. Zigmond, A. S. and Snaith, R. P . (1983). The hospital anxiety and depression scale. Acta psychiatrica scandinavica , 67(6):361–370. Muhammad Muzammel et al.: Pr epr int submitted to Elsevier P age 12 of 12
Original Paper
Loading high-quality paper...
Comments & Academic Discussion
Loading comments...
Leave a Comment