OCR Graph Features for Manipulation Detection in Documents
Detecting manipulations in digital documents is becoming increasingly important for information verification purposes. Due to the proliferation of image editing software, altering key information in documents has become widely accessible. Nearly all approaches in this domain rely on a procedural approach, using carefully generated features and a hand-tuned scoring system, rather than a data-driven and generalizable approach. We frame this issue as a graph comparison problem using the character bounding boxes, and propose a model that leverages graph features using OCR (Optical Character Recognition). Our model relies on a data-driven approach to detect alterations by training a random forest classifier on the graph-based OCR features. We evaluate our algorithm’s forgery detection performance on dataset constructed from real business documents with slight forgery imperfections. Our proposed model dramatically outperforms the most closely-related document manipulation detection model on this task.
💡 Research Summary
The paper addresses the increasingly critical problem of detecting manipulations in digital documents such as bank statements, credit‑card bills, and tax returns. While most existing approaches rely on handcrafted, procedural pipelines that examine low‑level image cues (color, texture, noise), these cues are often absent or unreliable in documents that are typically black‑on‑white and may undergo printing, scanning, or compression. The authors therefore propose a fundamentally different formulation: treat each recognized character as the central node of a small graph, and encode the spatial and morphological relationships with its neighboring characters as graph‑level features.
Methodology
-
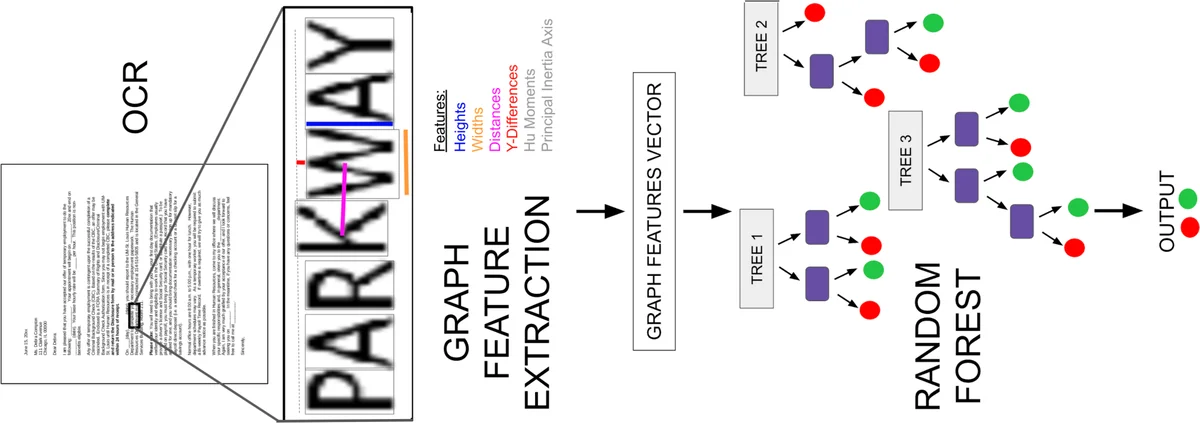
Graph Construction – Using Tesseract OCR, the bounding box of every character is extracted. For each character (the central node) a sub‑graph is built that includes n characters to the left and n characters to the right on the same text line (the authors experiment with n = 3, 5, 7, 9). Two boxes are considered to be on the same line if the absolute difference of their top‑y coordinates is less than 0.85 times the taller box’s height. When the central node lies near a line edge, missing neighbors are imputed from the opposite side if possible.
-
Feature Engineering – For every node in the sub‑graph the following descriptors are computed:
- Height and width of the OCR box (size).
- Y‑value difference relative to the central node (alignment error).
- Euclidean distance between the centers of the two boxes (proximity weighting).
- The seven Hu moments, which are invariant to rotation, scaling, and translation and capture the internal pixel distribution of the character.
- Principal Inertia Axis obtained via singular value decomposition of the second‑order central moments (μ20, μ11, μ02).
All node features are concatenated in a fixed order to form a single high‑dimensional vector representing the sub‑graph. The label is 1 if the central character has been altered, otherwise 0.
-
Classification – A Random Forest classifier is trained on these vectors. The authors perform an extensive hyper‑parameter search (480 random configurations) over the number of trees, maximum depth, minimum samples per leaf, and the neighbor count n. Five‑fold cross‑validation is used to report mean performance and standard deviation.
Dataset
The authors assemble a proprietary collection of 359 real‑world finance‑related documents (bank statements, offer letters, credit‑card statements, bills, tax returns). After converting PDFs to PNG images, they apply OCR and then randomly modify 5 % of the characters. Modifications consist of either a horizontal/vertical shift (1–5 px or 5–10 px) or a scaling operation (7–14 % or 15–25 %). The altered bounding boxes are stored as ground truth, but the detection model only receives the OCR‑derived boxes, never the original PDF coordinates. The training split contains 1470 pages, while the test split contains 389 pages.
Baseline Comparison
The most relevant prior work is Bertrand et al. (2013), which also works at the character level using Tesseract OCR. Their pipeline extracts Hu moments, size, and alignment, then computes two separate distance‑based scores (Euclidean distance between same‑character pairs and Mahalanobis distance to a class‑specific model). The two scores are combined via a hand‑tuned thresholding scheme. The authors argue that this method is a suitable baseline because it shares many low‑level features but lacks any graph‑structured representation or learned classifier.
Results
On the test set, the Bertrand et al. method achieves high recall (≈0.92) but low precision (≈0.58), leading to many false positives and an F1 score around 0.70. In contrast, the proposed graph‑based Random Forest attains precision ≈0.84, recall ≈0.88, and an F1 score exceeding 0.86, demonstrating a substantial reduction in false alarms while maintaining strong detection capability. The authors attribute this improvement to two factors: (i) the inclusion of relational features (distance, alignment) that capture inconsistencies between a character and its immediate context, and (ii) the data‑driven learning of a non‑linear decision surface, which replaces brittle hand‑crafted thresholds.
Strengths
- Novel formulation – Modeling a document as a collection of overlapping character graphs is original and exploits the inherent structured nature of text.
- Data‑driven pipeline – Random Forest automatically learns feature interactions, removing the need for manual scoring rules.
- Realistic evaluation – The dataset reflects genuine business documents and includes subtle manipulations that are not trivially visible.
Limitations
- OCR dependence – Errors in character detection or bounding‑box extraction directly corrupt the graph, potentially leading to missed detections or false positives.
- Scope of manipulations – The study only evaluates simple shift and scale attacks; more sophisticated forgeries (font substitution, background texture insertion, multi‑character splicing) remain untested.
- Granularity – The approach works at the character level; detecting higher‑level tampering (e.g., whole‑sentence reordering, paragraph insertion) would require larger graph windows or hierarchical modeling.
Future Directions
The authors suggest extending the method in several ways: (1) incorporating OCR confidence scores or employing ensemble OCR to mitigate detection errors; (2) building hierarchical graphs that span words, lines, and paragraphs, enabling detection of larger‑scale manipulations; (3) replacing the Random Forest with Graph Neural Networks (GNNs) to learn richer representations directly from the graph structure; and (4) fusing visual features with language models to capture semantic inconsistencies alongside visual anomalies.
Conclusion
By reframing document manipulation detection as a graph comparison problem and leveraging OCR‑derived geometric and shape descriptors, the paper demonstrates a clear performance advantage over the strongest existing character‑level baseline. The work provides a practical, scalable solution for real‑world business document verification and opens a promising research avenue where structured graph representations and modern machine‑learning classifiers converge to protect the integrity of digital paperwork.
Comments & Academic Discussion
Loading comments...
Leave a Comment