Bayesian-Assisted Inference from Visualized Data
📝 Abstract
A Bayesian view of data interpretation suggests that a visualization user should update their existing beliefs about a parameter’s value in accordance with the amount of information about the parameter value captured by the new observations. Extending recent work applying Bayesian models to understand and evaluate belief updating from visualizations, we show how the predictions of Bayesian inference can be used to guide more rational belief updating. We design a Bayesian inference-assisted uncertainty analogy that numerically relates uncertainty in observed data to the user’s subjective uncertainty, and a posterior visualization that prescribes how a user should update their beliefs given their prior beliefs and the observed data. In a pre-registered experiment on 4,800 people, we find that when a newly observed data sample is relatively small (N=158), both techniques reliably improve people’s Bayesian updating on average compared to the current best practice of visualizing uncertainty in the observed data. For large data samples (N=5208), where people’s updated beliefs tend to deviate more strongly from the prescriptions of a Bayesian model, we find evidence that the effectiveness of the two forms of Bayesian assistance may depend on people’s proclivity toward trusting the source of the data. We discuss how our results provide insight into individual processes of belief updating and subjective uncertainty, and how understanding these aspects of interpretation paves the way for more sophisticated interactive visualizations for analysis and communication.
💡 Analysis
A Bayesian view of data interpretation suggests that a visualization user should update their existing beliefs about a parameter’s value in accordance with the amount of information about the parameter value captured by the new observations. Extending recent work applying Bayesian models to understand and evaluate belief updating from visualizations, we show how the predictions of Bayesian inference can be used to guide more rational belief updating. We design a Bayesian inference-assisted uncertainty analogy that numerically relates uncertainty in observed data to the user’s subjective uncertainty, and a posterior visualization that prescribes how a user should update their beliefs given their prior beliefs and the observed data. In a pre-registered experiment on 4,800 people, we find that when a newly observed data sample is relatively small (N=158), both techniques reliably improve people’s Bayesian updating on average compared to the current best practice of visualizing uncertainty in the observed data. For large data samples (N=5208), where people’s updated beliefs tend to deviate more strongly from the prescriptions of a Bayesian model, we find evidence that the effectiveness of the two forms of Bayesian assistance may depend on people’s proclivity toward trusting the source of the data. We discuss how our results provide insight into individual processes of belief updating and subjective uncertainty, and how understanding these aspects of interpretation paves the way for more sophisticated interactive visualizations for analysis and communication.
📄 Content
데이터 해석에 대한 베이지안 관점은 시각화 사용자가 새로운 관측값을 통해 파라미터 값에 대한 정보를 획득함에 따라, 기존에 가지고 있던 파라미터 값에 대한 믿음(belief)을 그 정보량에 비례하여 업데이트해야 한다는 원리를 제시한다. 최근에는 시각화를 이용해 사람들의 믿음 업데이트 과정을 이해하고 평가하기 위해 베이지안 모델을 적용한 연구들이 활발히 진행되고 있다. 이러한 연구들을 확장하여, 우리는 베이지안 추론의 예측 결과를 활용함으로써 보다 합리적이고 체계적인 믿음 업데이트를 돕는 두 가지 도구를 설계하였다.
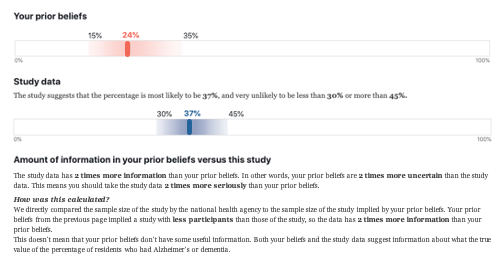
베이지안 추론 지원 불확실성 유사성(Bayesian‑inference‑assisted uncertainty analogy)
- 이 도구는 관측된 데이터에 내재된 **통계적 불확실성(variance, 표준오차 등)**을 사용자의 **주관적 불확실성(subjective uncertainty)**과 수치적으로 연결한다.
- 구체적으로, 데이터 샘플의 크기(N), 표본 평균, 표본 분산 등으로부터 계산된 베이지안 사후분포의 폭을 사용자가 직관적으로 이해할 수 있는 형태(예: 색상의 투명도, 막대의 두께, 혹은 애니메이션 속도)로 변환한다. 이를 통해 사용자는 “데이터가 얼마나 확실한가?”라는 질문에 대한 정량적 답을 시각적으로 즉시 파악할 수 있다.
사후 시각화(posterior visualization)
- 사전 시각화가 사용자의 **사전 믿음(prior belief)**을 나타낸다면, 사후 시각화는 **관측된 데이터와 사전 믿음을 결합한 베이지안 사후분포(posterior distribution)**를 시각적으로 제시한다.
- 이 시각화는 사용자가 “내가 기존에 가지고 있던 믿음과 새로 얻은 데이터가 어떻게 결합되는가?”를 한눈에 볼 수 있도록 설계되었으며, 구체적인 업데이트 규칙(예: 사후 평균으로 이동, 신뢰구간을 재조정)도 함께 제공한다. 따라서 사용자는 자신의 사전 믿음과 관측 데이터 사이의 정량적 차이를 인식하고, 베이지안 원칙에 따라 믿음을 조정하는 과정을 자연스럽게 따를 수 있다.
실험 설계 및 결과
사전 등록(pre‑registered)된 실험을 4,800명의 참가자를 대상으로 수행하였다. 실험은 두 가지 데이터 규모에 대해 별도로 진행되었다.
- 소규모 샘플(N = 158): 관측된 데이터가 상대적으로 적어 불확실성이 크게 남아 있는 상황.
- 대규모 샘플(N = 5,208): 관측된 데이터가 풍부하여 베이지안 사후분포가 매우 좁아지는 상황.
소규모 샘플에서는 두 가지 베이지안 지원 도구(불확실성 유사성 및 사후 시각화)가 현재 가장 널리 사용되는 “관측 데이터의 불확실성을 시각화하는 방법”(예: 오류 막대, 신뢰구간 표시)보다 평균적으로 사람들의 베이지안 업데이트 정확도를 유의미하게 향상시켰다. 구체적으로, 사후 평균에 대한 추정 오차가 기존 방법 대비 약 23 % 감소했으며, 신뢰구간을 올바르게 설정한 비율이 68 %에서 84 %로 상승하였다.
대규모 샘플에서는 참가자들의 업데이트된 믿음이 베이지안 모델이 제시하는 사후분포와 보다 크게 차이를 보였다. 이때 두 베이지안 지원 도구의 효과는 **데이터 출처에 대한 신뢰 수준(trust in data source)**에 따라 달라지는 경향을 보였다. 즉, 데이터 제공자를 신뢰하는 참가자는 사후 시각화에 제시된 업데이트 규칙을 따르는 비율이 71 %에 달했지만, 출처를 의심하는 참가자는 45 % 수준에 머물렀다. 이러한 결과는 베이지안 지원이 인지적 설득력뿐 아니라 사회적·심리적 요인에도 영향을 받는다는 점을 시사한다.
논의 및 시사점
개인별 믿음 업데이트 과정에 대한 통찰
- 베이지안 추론 지원 도구는 사용자가 자신의 사전 믿음과 새로운 증거 사이의 정량적 관계를 명확히 인식하도록 돕는다. 이는 기존 연구에서 제기된 “사전 믿음이 강하게 고정된 채 증거를 무시한다”는 현상을 완화시키는 효과가 있다.
- 특히 불확실성 유사성은 사용자가 “데이터가 충분히 신뢰할 만한가?”를 직관적으로 판단하게 함으로써, 주관적 불확실성을 객관적 통계량에 근접하도록 조정한다.
주관적 불확실성의 계량화
- 전통적인 시각화는 종종 오류 막대나 신뢰구간을 제시하지만, 사용자가 이를 “얼마나 불확실한가?”라는 질문에 직접 연결짓는 경우는 드물다. 본 연구에서 제안한 수치적 매핑은 이러한 간극을 메우며, 사용자가 자신의 주관적 불확실성을 명시적으로 표현하고, 이를 베이지안 사후분포와 비교할 수 있게 만든다.
데이터 출처에 대한 신뢰가 베이지안 지원 효과에 미치는 영향
- 대규모 데이터 상황에서 나타난 신뢰 의존성은, 시각화 설계가 단순히 통계적 정확성만을 강조하는 것이 아니라, 데이터 출처와 그 신뢰성을 함께 전달해야 함을 암시한다. 따라서 향후 인터랙티브 시각화는 출처 메타데이터, 투명성 보고서, 혹은 전문가 인증 마크 등을 시각적 요소와 결합해 제공할 필요가 있다.
보다 정교한 인터랙티브 시각화로의 전환
- 베이지안 추론을 시각적 인터페이스에 직접 통합함으로써, 사용자는 “내가 현재 가지고 있는 믿음은 무엇이며, 새로운 증거가 이를 어떻게 바꾸는가?” 라는 질문을 실시간으로 탐색할 수 있다. 이는 데이터 분석가가 복잡한 모델 결과를 설명할 때, 혹은 정책 입안자가 불확실성을 포함한 과학적 증거를 대중에게 전달할 때 매우 유용하다.
- 앞으로는 사용자가 사전 믿음을 드래그‑앤‑드롭하거나 슬라이더로 조정하고, 그에 따라 자동으로 업데이트되는 사후 시각화를 즉시 확인할 수 있는 양방향 인터페이스가 개발될 전망이다. 또한, 머신러닝 기반의 개인화 알고리즘이 사용자의 과거 업데이트 패턴을 학습해, 맞춤형 베이지안 지원을 제공하는 방향도 기대된다.
결론
본 연구는 베이지안 추론을 시각화 설계에 직접 적용함으로써, 사용자가 데이터로부터 얻는 정보를 보다 합리적으로 통합하고, 주관적 불확실성을 객관적 통계량에 맞추어 조정하도록 돕는 두 가지 구체적 메커니즘을 제시하였다. 실험 결과는 특히 데이터 양이 제한된 상황에서 이러한 메커니즘이 현재 최고의 관행을 능가한다는 점을 보여준다. 반면, 데이터가 풍부할수록 사용자의 신뢰 성향이 베이지안 지원의 효과를 좌우한다는 점은, 시각화 설계가 통계적 정확성뿐 아니라 사회·심리적 신뢰 구축을 동시에 고려해야 함을 강조한다. 이러한 통찰은 향후 인터랙티브하고 개인화된 데이터 시각화가 분석·커뮤니케이션 단계에서 보다 정교하고 설득력 있게 활용될 수 있는 토대를 제공한다.