Essential Motor Cortex Signal Processing: an ERP and functional connectivity MATLAB toolbox -- user guide version 2.0
The purpose of this document is to help individuals use the "Essential Motor Cortex Signal Processing MATLAB Toolbox". The toolbox implements various methods for three major aspects of investigating human motor cortex from Neuroscience view point: (1…
Authors: Esmaeil Seraj, Karthiga Mahalingam
Geo rgia Institute of T echnology , A tlanta (GA), United States Scho ol of Electrical and Computer Engineering Essen tial Motor Cortex Signal Pro cessing: an ERP and functional connectivit y MA TLAB to olb o x - user guide v ersion 2.0 Esmaeil Sera j † , ∗ Karthiga Mahalingam † ∗ Corresp onding author † Corresp ondences shall b e forwarded to: ele ctr onic mail: { esera j3, kmahalingam } @gatech.edu July 23, 2020 ERP & Cortical F unctional Connectivit y MA TLAB T o olb o x Georgia T ec h Abstract The purp ose of this do cumen t is to help individuals use the ”Essential Motor Cortex Signal Pro cessing MA TLAB T o olb o x”. The to olbox implemen ts v arious methods for three ma jor asp ects of inv estigating h uman motor cortex from Neuroscience view p oint: (1) ERP estimation and quan tification, (2) Cortical F unctional Connectivity analysis and (3) EMG quan tification. The to olbox – whic h is distributed under the terms of the GNU GENERAL PUBLIC LICENSE as a set of MA TLAB R routines – can b e do wnloaded directly at the address: http://oset.ir/category.php?dir=Tools . or from the public rep ository on GitHub, at address below: https://github.com/EsiSeraj/ERP_Connectivity_EMG_Analysis . The purp ose of this toolb ox is threefold: 1. Extract the even t-related-p oten tial (ERP) from prepro cessed cerebral signals (i.e. EEG, MEG, etc.), iden tify and then quantify the ev en t-related synchronization/desync hronization (ERS/ERD) even ts. Both time-course dynamics and time-frequency (TF) analyzes are in- cluded. 2. Measure, quantify and demonstrate the cortical functional connectivit y (CF C) across scalp electro des. These set of functions can also b e applied to v arious types of cerebral signals (i.e. electric and magnetic). 3. Quantify electrom yogram (EMG) recorded from activ e muscles during p erforming motor tasks. Key-w ords: Ev ent-Related P oten tial, ERP , Even t-Related Sync hronization, ERS, Ev en t-Related Desync hronization, ERD, ERP Time Dynamics, Time-F requency Analysis, Cortical F unctional Connectivit y , CFC, Electroencephalogram, EEG, Electromy ogram, EMG, EMG Quan tification, MA TLAB F unction, F ree T o olbox, User Guide, Man ual 1 ERP & Cortical F unctional Connectivit y MA TLAB T o olb o x Georgia T ec h Con ten ts 1 In tro duction 3 1.1 License - No W arran ty . . . . . . . . . . . . . . . . . . . . . . . . . . . . . . . . . . . 3 1.1.1 The Op en-Source Electrophysiological T o olb o x (OSET) . . . . . . . . . . . . . 3 1.2 Citation . . . . . . . . . . . . . . . . . . . . . . . . . . . . . . . . . . . . . . . . . . . 4 1.3 Do wnload and Utilization . . . . . . . . . . . . . . . . . . . . . . . . . . . . . . . . . 4 1.4 Getting Help . . . . . . . . . . . . . . . . . . . . . . . . . . . . . . . . . . . . . . . . 4 2 User Guide 4 2.1 Ov erview . . . . . . . . . . . . . . . . . . . . . . . . . . . . . . . . . . . . . . . . . . . 4 2.2 F undamen tals . . . . . . . . . . . . . . . . . . . . . . . . . . . . . . . . . . . . . . . . 6 2.2.1 Data: Setup, Equipments and F ormat . . . . . . . . . . . . . . . . . . . . . . . 6 2.2.2 Preconditioning . . . . . . . . . . . . . . . . . . . . . . . . . . . . . . . . . . . 7 2.2.3 Time-course ERP Dynamics . . . . . . . . . . . . . . . . . . . . . . . . . . . . 8 2.2.4 Time-frequency ERP Analysis . . . . . . . . . . . . . . . . . . . . . . . . . . . 11 2.2.5 Time-course Cortical F unctional Connectivit y . . . . . . . . . . . . . . . . . . 12 2.2.6 P air-wise Cortical F unctional Connectivity . . . . . . . . . . . . . . . . . . . . 13 2.2.7 EMG Quan tification . . . . . . . . . . . . . . . . . . . . . . . . . . . . . . . . 15 3 Reference Man ual 18 3.1 bdf2mat main.m . . . . . . . . . . . . . . . . . . . . . . . . . . . . . . . . . . . . . . . 18 3.2 trigger synch.m . . . . . . . . . . . . . . . . . . . . . . . . . . . . . . . . . . . . . . 20 3.3 trigger avg erp.m . . . . . . . . . . . . . . . . . . . . . . . . . . . . . . . . . . . . . 21 3.4 trigger avg TF erp.m . . . . . . . . . . . . . . . . . . . . . . . . . . . . . . . . . . . 22 3.5 erp quantification.m . . . . . . . . . . . . . . . . . . . . . . . . . . . . . . . . . . . 23 3.6 TCPLV.m . . . . . . . . . . . . . . . . . . . . . . . . . . . . . . . . . . . . . . . . . . . 24 3.7 PWPLV.m . . . . . . . . . . . . . . . . . . . . . . . . . . . . . . . . . . . . . . . . . . . 26 3.8 PWCoherence.m . . . . . . . . . . . . . . . . . . . . . . . . . . . . . . . . . . . . . . . 27 3.9 emg quantification.m . . . . . . . . . . . . . . . . . . . . . . . . . . . . . . . . . . . 28 3.10 drift reject.m . . . . . . . . . . . . . . . . . . . . . . . . . . . . . . . . . . . . . . . 29 3.11 emg onset.m . . . . . . . . . . . . . . . . . . . . . . . . . . . . . . . . . . . . . . . . . 30 3.12 phase est.m . . . . . . . . . . . . . . . . . . . . . . . . . . . . . . . . . . . . . . . . . 31 3.13 PLV PhaseSeq.m . . . . . . . . . . . . . . . . . . . . . . . . . . . . . . . . . . . . . . . 32 3.14 sig trend.m . . . . . . . . . . . . . . . . . . . . . . . . . . . . . . . . . . . . . . . . . 32 3.15 task separator.m . . . . . . . . . . . . . . . . . . . . . . . . . . . . . . . . . . . . . 33 4 Ac kno wledgment 33 5 References 34 2 ERP & Cortical F unctional Connectivit y MA TLAB T o olb o x Georgia T ec h 1 In tro duction This do cument is mean t to help individuals use the ”Essential Motor Cortex Signal Pro cessing MA TLAB T o olbox”. Using the most p opular reference articles in literature, the to olb ox implements v arious metho ds for three ma jor asp ects of neuro-physiological inv estigation of human motor cortex: (1) ERP estimation and quantification (e.g. based on [1, 2, 3, 4]), (2) Cortical F unctional Connectivity analysis (e.g. based on [5, 6, 7, 8, 9]) and (3) EMG quantification (e.g. based on [10, 11]). The purp ose of this to olb ox is threefold: 1. Extract the even t-related p otential (ERP) from prepro cessed cerebral signals (i.e. EEG, MEG, etc.), iden tify and then quan tify the even t-related sync hronization/desynchronization (ERS/ ERD) ev ents. Both time-course dynamics and time-frequency (TF) analysis are included. 2. Measure, quan tify and demonstrate the cortical functional connectivity (CF C) across scalp electro des. These set of functions can also b e applied to v arious t yp es of cerebral signals (i.e. electric and magnetic). 3. Quantify electrom yogram (EMG) recorded from active m uscles during p erforming motor tasks. A primary goal of this to olset is to ease understanding the routines and help individuals alter our co des according to their study and/or implement their o wn tec hniques. F or this purp ose, herein, w e first present a detailed tutorial (e.g. Section 2.2.) on signal preconditioning and in terpretable- implemen tation of introduced metho ds, from a practical view-p oin t. 1.1 License - No W arran ty This program is free softw are; you can redistribute it and/or mo dify it under the terms of the GNU GENERAL PUBLIC LICENSE as published by the F ree Soft ware F oundation; either v ersion 2 of the License, or (at y our option) any later version. This program is distributed in the hop e that it will be useful, but WITHOUT ANY W ARRANTY; without ev en the implied w arrant y of MERCHANT ABILITY or FITNESS FOR A P AR TICULAR PURPOSE. See the GNU GENERAL PUBLIC LICENSE for more details. Y ou should ha ve re- ceiv ed a copy of the GNU GENERAL PUBLIC LICENSE along with this program; if not, see h http://www.gnu.org/licenses/ i or write to the F ree Softw are F oundation, Inc., 51 F ranklin Street, Fifth Flo or, Boston, MA 02110-1301, USA. 1.1.1 The Op en-Source Electrophysiological T o olb ox (OSET) Op en Source Electroph ysiological T o olb o x (OSET) is a collection of electrophysiological data and op en source codes for biosignal generation, mo deling, pro cessing, and filtering. OSET, version 3.1, 2014 Released under the GNU GENERAL PUBLIC LICENSE [12]. Copyrigh t c 2012. As a progressive general-purp ose op en-source to olset, OSET is one of the main sources to access the functions and co des of curren t motor c ortex signal pr o c essing to olb o x and also its do cumen tation and dep endencies. 3 ERP & Cortical F unctional Connectivit y MA TLAB T o olb o x Georgia T ec h 1.2 Citation Within the limits of the GNU GENERAL PUBLIC LICENSE, you can use the toolb ox as you please; ho wev er, if you use the to olbox in a w ork of y our o wn that y ou wish to publish, you need to mak e sure to cite this user man ual and the original studies prop erly , as sho wn b elow. This w ay y ou will con tribute to helping other scholars find these items. • Esmaeil Sera j and Karthiga Mahalingam “Essen tial Motor Cortex Signal Pro cessing: an ERP and functional connectivit y MA TLAB to olb o x - User Guide V ersion 1.0,” arXiv Preprin t, June 2019 [Online]. 1.3 Do wnload and Utilization The latest v ersion of the to olb o x can b e downloaded directly from OSET at the address: http://oset.ir/category.php?dir=Tools or from the public rep ository on GitHub, at: https://github.com/EsiSeraj/ERP_Connectivity_EMG_Analysis The functions and m-files can b e downloaded separately as y ou need or all together in a compressed file named ERP Connectivity EMG Analysis Toolbox . Once y ou hav e downloaded and uncompressed the to olb o x, 35 files represented in follo wing T ables shall be app eared in your c hosen directory . T able (1) represen ts all m-files (i.e. core functions, internal computational functions and demo test files) included in this to olset with their short descriptions and references. Additionally , a copy of b oth GNU general public license, this user manual and ten recorded sample data are also included (see Section 2.2.1 for details). Moreo v er, you migh t add the path of the directory in which y ou stored the to olb o x to y our MA TLAB in order to easily use and apply the functions for your own dataset. 1.4 Getting Help If y ou hav e added the to olb ox directory to the MA TLAB R path y ou can simply type: or in command window to get online help for the function y ou are using. F urthermore, you can also con tact any of the authors 1 directly to ask an y related questions or discuss possible difficulties or errors y ou might encoun ter. Please feel free to con tact in either case. 2 User Guide 2.1 Ov erview This do cument is mean t to help individuals use the ”Essential Motor Cortex Signal Pro cessing MA TLAB T o olb o x” whic h implements v arious metho ds for three ma jor asp ects of inv estigating h uman motor cortex from Neuroscience view p oint: (1) ERP estimation and quantification (e.g. 1 E. Sera j, K. Mahalingam: { eseraj3, kmahalingam } @gatech.edu 4 ERP & Cortical F unctional Connectivit y MA TLAB T o olb o x Georgia T ec h T able 1: Essential Motor Cortex Signal Analysis m-files . ro w name (function) description reference 1 test ERPanalysis main.m demo for testing the ERP analysis functions Original 2 test connectivity main.m demo for testing the functional connectivit y functions Original 3 test EMGanalysis main.m demo for testing the EMG quan tification functions Original 4 trigger avg erp.m trigger-a veraged ERP time-course estimation function Original 5 trigger avg TF erp.m trigger a veraged ERP time/frequency represen tation Original 6 erp quantification.m quan tifying the area of ERD/ERS even ts Original 7 TCPLV.m time-course PL V estimation function for a pair of electro des Original 8 PWPLV.m pair-wise PL V estimation function Original 9 PWCoherence.m pair-wise coherence estimation function Original 10 PLV PhaseSeq.m PL V quan tification function OSET [13] 11 emg quantification.m quan tifying the EMG signals Original 12 phase est.m TFP phase estimation function OSET [13] 13 trigger synch.m sync hronizing signals according to trigger time Original 14 bdf2mat main.m reading EEG/EMG signal from b df files, prepro cessing and conditioning Original 15 emg onset.m EMG onset estimation function Original 16 drift reject.m drift cancellation from biological recordings OSET [12] 17 BaseLine2.m estimating the baseline of a signal OSET [12] 18 sig trend.m estimating the trend of a signal OSET [12] 19 BPFilter5.m forw ard-backw ard zero-phase CIC filtering function OSET [12] 20 task separator.m task based data separation to a void memory ov eruse Original 21 eeg read bdf.m Con verting “*.b df” to “*.mat” Gleb Tc heslavski [14] 5 ERP & Cortical F unctional Connectivit y MA TLAB T o olb o x Georgia T ec h based on [1, 2, 3, 4]), (2) Cortical F unctional Connectivity analysis (e.g. based on [5, 6, 7, 8, 9]) and (3) EMG quantification (e.g. based on [10, 11]). Measuremen ts and metho dologies are all deriv ed based on the pro cedures suggested by the most popular reference articles in that category , as aforemen tioned. The curren t v ersion of to olb o x co v ers six well-kno wn and widely used approac hes within Neuroscience comm unity for analyzing motor cortex p oten tials and EMG signals, as follows: • Preconditioning: Prepro cessing the signals, including baseline drift remo v al, artifact rejec- tion, mo vemen t onset detection (i.e. for non-cued mo vemen ts), trigger synchronization (i.e. essen tial step for ERP extraction through non–synchronized trials of EEG data) and etc. • Time-course ERP Dynamics: Estimation and quan tification of ERP (i.e. ERS and ERD ev ents). • Time-frequency ERP Analysis: Estimation and represen tation of time-frequency (TF) maps through v arious widely-accepted TF analysis metho ds suc h as Short-time F ourier T rans- form (STFT), Con tin uous W av elet T ransform (CWT), Narro w-band Channelization (NBCH) and etc. • Time-course Cortical F unctional Connectivit y: Estimation and quan tification of lo- cal/large -scale functional connectivity b et w een arbitrary pairs of electro des through Phase Lo c king V alue (PL V) [7, 9] and Magnitude Squared Coherence (MSC) [6]. • Pair-wise Cortical F unctional Connectivit y: Estimation and quantification of lo cal/large -scale functional connectivit y maps across scalp electro des through PL V and MSC. • EMG Quan tification: Estimation and quantification of electromy ogram (EMG) records of activ e muscles during p erforming motor tasks. 2.2 F undamen tals 2.2.1 Data: Setup, Equipments and F ormat Activ eTwo is a v ery w ell-known commonly used high-resolution biosignal acquisition system that comes with adv an tageous capabilities suc h as active electro des [15]. Activ e electro des are those that do es not require extensiv e skin (scalp) preparation due to the presence of pre-amplifiers in them. The pin electro des must b e connected to the scalp on one end and to the acquisition system on the other. The acquisition system is then connected to the PC to which it relays electro de data serially . Electro de gel has to be used on the scalp with electro des to impro ve conductivity and to reduce noise. Care should b e taken to reduce noise as muc h as p ossible b y prop erly grounding all electrical appliances connected with the electro de system, making sure there are minimum head mov emen ts while recording etc. Before starting data collection, all electro des need to b e c heck ed for their prop er functionality . This can be p erformed through the single buc k et test [16]. Electro des can be placed according to the 10-20 system [17], which is a very common approac h for most studies. EEG cap has to b e adjusted based on head circumference, nasion-inion, and ear-to-ear distance. Reference electro de areas are normally c hosen to b e the av erage b et w een tw o ears [15] and th us CMS/DRL flat type electro des should b e placed b ehind earlob es. Finally , EMG electro des should b e placed directly on the activ e muscle the activit y of which is to b e recorded. 6 ERP & Cortical F unctional Connectivit y MA TLAB T o olb o x Georgia T ec h The EEG signals recorded by Activ eTwo are s tored in *.b df format files. W e provided a v ery useful MA TLAB m-file b y Gleb Tc hesla vski [14] that con verts *.b df format files to *.mat MA TLAB data files. 2.2.2 Preconditioning In ERP and functional connectivit y analysis problems, preconditioning mostly refers to prepro cessing the signals. This includes baseline drift remov al, artifact rejection, mov ement onset detection from EMG signals, trigger sync hronization (i.e. as describ ed ab ov e) and etc. Quic k note on artifact rejection: The concept of noise in this problem could be regarded to t w o differen t parts of recorded signals. First group are the common sources of noise observed in EEG recordings such as m uscle activity , eye mov ement, electro cardiographic activity , instrumentation and equipment related artifacts and interference, slo w drifts and amplifier saturation and etc. [2]. Moreo ver, bac kground EEG activity is considered as the other source of noise [1]. In this case, ERP is considered as signal and the bac kground EEG activity as noise [2, 1]. Artifact rejection in later case is normally easy , since as widely accepted, bac kground ongoing EEG is considered as uncorrelated to signal (ERP) and th us, can b e rejected b y an ensemble av eraging o ver trials [1, 2, 3]. The b est wa y of dealing with the first group of noises ho wev er, is to not ha v e an y in first place. The easiest sources of noise to deal with are A C p ow er lines, ligh ting and electronic equipmen t such as computers, displays and TVs, wireless routers, noteb o oks and also mobile phones. The basic step here is to simply remov e any unnecessary sources of electro-magnetic (EM) noise from the recording ro om and, if p ossible, replace equipmen t using alternate current with direct current [18, 19]. F urther, a significan t n umber of noise sources can b e rejected through differen t steps of lo w-pass, high-pass and sometimes notch filters. Drift cancellation: Despite ha ving v arious sources of additional noise on EEG, one of the most imp ortan t ones to deal with, in this application, is the baseline drift noise (a.k.a base line w ander). The drift noise normally happ ens due to sw eating, drifts of cap and/or electro des and similar rea- sons, which could normally lead to amplifier saturation [2, 18] and thus incorrect and unreliable measuremen ts. The effect of drifts on ERP estimation application is sho wn in Fig. 1 which is directly emplo yed from [2]. As shown, although the effect of drift remov al from 182 trials is relatively small, still is considerable for analyzing the relativ e decreases and increases in ERP p o w er (ERD/ERS) quan tification. As suggested in [2], a n umber of issues are to b e tak en in to consideration, such as detecting negative drifts as well as p ositiv e ones, using similar sp ecs for the drift rejection metho d across trials and also c ho osing a prop er-length (long enough) temp oral window for drift calculation (preferably b et ween 1 or t w o seconds) [2]. Nevertheless, the filtering sp ecs in EEG artifact remo v al are highly dependent on the data and recording conditions and thus, should b e c hosen empirically [2, 20]. The strongest recommendation throughout the literature is to ev aluate the filter b efore b ecoming committed to [2, 20]. An imp ortan t consideration to be taken into account here is that the filtering procedure itself, dep ending on the c haracteristics and nature of the utilized filter and filtering metho d, can also significantly affect the data in the non-filtered frequency ranges and th us can affect the onset detection and/or amplitude of estimated ERP . Therefore, to preven t these problems, it is highly recommended that filtering should b e limited to what is necessary and unav oidable [18]. 7 ERP & Cortical F unctional Connectivit y MA TLAB T o olb o x Georgia T ec h Figure 1: The effect of drift (base line w ander) on ERP analysis. (a) and (b) examples of trials with drifts. (c) estimated ERP in each case. This figure is adopted from [2]. In this to olb o x, the function drift reject.m is pro vided for this purp ose whic h uses tw o stages of median or mo ving av erage temp oral filtering to extract the base-line w ander and reject it. T o op erate this function y ou can simply call function b elow with prop er input parameters: sig = drift reject(raw sig, L1, L2, approach) where the inputs and outputs are describ ed later in Section 3. Fig. 2 is an elaboration of ho w ho w this function w orks. 2.2.3 Time-course ERP Dynamics F or this part, the con ven tional approac h, as prop osed in [1], is implemen ted. Accordingly , the w ell- kno wn five-step metho d presen ted b elo w is employ ed for ERP extraction from EEG signals: • Step #1 – Band-pass frequency filtering the EEG data in each trial • Step #2 – Squaring the samples of filtered trials to find the p ow er • Step #3 – Ensemble av eraging ov er synchronized trials according to trigger time • Step #4 – Calculating the trend of output sequence in order to obtain ERP signal • Step #5 – Quantifying the estimated ERP signal according to a reference p erio d The estimated signal in Step #4 is the desired ERP signal. Each step is elab orated b elo w. 8 ERP & Cortical F unctional Connectivit y MA TLAB T o olb o x Georgia T ec h Figure 2: Two sample EMG (left) and EEG (righ t) from pro vided sample dataset b efore and after remo ving the drift artifact as describ ed in [2, 18, 20] Step #1: F or this step, zero-phase bandpass frequency filtering using Cascaded In tegrator-Comb (CIC) filter is implemen ted [21]. The filter performs forw ard-backw ard filtering successiv ely . I t has absolutely zero-phase for even filter order v alues and a phase-lag equal to a single stage CIC filter for o dd filter order v alues. Therefore, for this application w e recommend an even v alue to b e chosen as the filter order to prev ent any subsequen t phase distortion. An imp ortan t issue here is to select the frequency band of interest for sho wing the time course of ERP [1]. This concern is v ery crucial due to the fact that differen t brain states can mo dulate differen t frequency bands of EEG rh ythms. Additionally , even for the same action, one migh t observ e in tra- trial v ariability on dominant frequencies [1]. Accordingly , estimating the time-course of ERP signal related to the task for further analysis requires additional cautions to b e taken into account. Due to the sub jectiv e pro cess of c ho osing a prop er frequency band for ERP analysis, herein, the functions are designed to accept frequency ranges in a w ay that users can customize their frequency range of interest and exp erimen t v arious bands of frequency easily . T o read further in these regards, refer to [1, 2, 3]. Steps #2, #3 and #4: Steps 2 through 4 are closely related (e.g. ev en could be considered as one step) where after squaring the samples of the filtered signal, t w o successiv e aver aging steps are p erformed across trials and then time [1]. Ensem ble a veraging is the most imp ortant one among these steps since EEG signals are required to b e a veraged o ver synchronized data trials according to their resp ective trigger time. Based on this, first the onset of mov ement needs to b e estimated (i.e. can be p erformed either through hardw are settings (e.g. cue based recordings) or using our pro vided emg onset.m function) as the trigger time. Then, the EEG trials hav e to b e sorted and aligned with resp ect to the trigger time and even tually a v eraged across data trials. Afterwards, a simple temp oral a veraging is p erformed on obtained signal to extract the ERP sequence. In terested individuals can refer to either the Reference Man ual (i.e. Section3) or [1, 2, 3] for details of eac h av eraging step and implemented signal trend estimation function. Steps #5: F or this step, normally a 1-sec long reference p erio d b efore the mov ement onset is c hosen. Afterwards, the relative decrease interv als in p o w er after mov emen t onset are called ERD ev ents and vice v ersa, the relative increase interv als in p ow er are named ERS [22, 23]. 9 ERP & Cortical F unctional Connectivit y MA TLAB T o olb o x Georgia T ec h According to discussions presented in [22, 23, 1], reference p erio d is chosen some seconds b efore the task onset, completely based on application of in terest and data and thus is empirically set. Reference v alue is calculated as the a verage of p ow er samples within reference p erio d. An axis according to the reference v alue is set to 100% and the corresp onding crosses of ERP curv e are named resp ectively , time step ”0”, start of ERD1/ERS1, end of ERD1/ERS1 and so on. Afterw ards, standard deviation of the reference perio d is calculated and the corresp onding confidence in terv als are defined (mean plus/min us 2 or 3 times STD). Finally , the area enclosed b y ERP curv e and “ mean - confidence in terv al ” is calculated and normalized b y the length of that segment as ERD area and vice versa; the area enclosed b y ERP curve and “ mean + confidence interv al ” is calculated and normalized b y the length as ERS area. In this to olbox, the function trigger avg erp.m is provided for this purpose which utilizes trigger synch.m function to synchronize cerebral signals according to their trigger time and BPFilter5.m function to p erform the aforemen tioned CIC filtering. T o op erate this function you can use the demo m-file test ERPanalysis main.m or simply call function b elo w with prop er input parameters: [erp, synch eeg, synch emg, trigger time sec, time vec] = trigger avg erp(eeg, emg, fs, emg onset sampl, freq band, duration) where the inputs and outputs are describ ed later in Section 3. Fig. 3 is an elaboration of ho w ho w this function w orks. Moreo ver, function erp quantification.m is provided to quantify the calculated ERP signal as the output of trigger avg erp.m according to the exact pro cedure describ ed ab ov e. T o op erate this function y ou can simply call function b elo w with prop er input parameters: [erd area, ers area, quant erp] = erp quantification(erp, fs, trigger time sec, ref per, cof intv) where the inputs and outputs are describ ed later in Section 3. Fig. 4 is an elaboration of ho w ho w this function w orks. Figure 3: Time courses of trigger av eraged ERP curves, related to alpha and b eta bands. 10 ERP & Cortical F unctional Connectivit y MA TLAB T o olb o x Georgia T ec h Figure 4: Pro cedure for quan tifying the area of ERD/ERS Even ts. Note that the confidence interv al lines are plotted with exaggeration for b etter representation and are not in scale. 2.2.4 Time-frequency ERP Analysis Time-frequency represen tations (TFRs) can monitor ERPs in a wide range of frequency comp onents alongside with their temp oral v ariations. Using TFRs, not only the risk of missing imp ortan t in- formation is lo w er, but also the in terpretations provided can b e more comprehensiv e and generic. Herein, as a part of ERP analysis pac k age, a MA TLAB function is dedicated to this purp ose in whic h three different approac hes for time/frequency analysis, namely Short-Time F ourier T ransform (STFT), Con tin ues W av elet T ransform (CWT) and Narro w-Band Channelization method (NBCH) as in tro duced in [1], are implemen ted. Theoretical concepts of each TFR metho d is out of scope of the curren t document, ho w ever, in ter- ested users can refer to [24] for a detailed and comprehensive discussion on time/frequency analysis concepts and its tec hniques. Nev ertheless, as a short description, in STFT, the TF map of each trial is calculated separately through F ourier T ransform and a veraged o ver all. Similarly , for CWT the scalo- gram displa ying the squared and o v er-all-trials-av eraged wa v elet co efficien ts are used. Ev en tually , for NBCH, ERP maps are generated according to ERP b eha viors within very narro w frequency bands. The ERP maps are matrices, the ro ws of which corresp ond to frequency-sp ecific ERP estimations. The implemented function enables v ariable frequency range. The pro cedures utilized for all three TFR methods here are in accordance with [1]. The function trigger avg TF erp.m is pro vided for this purp ose whic h utilizes trigger synch.m function to sync hronize cerebral signals according to their trigger time and BPFilter5.m function to p erform the aforementioned CIC filtering for NBCH metho d. Moreo ver, for STFT and CWT metho ds, MA TLAB’s inner spectrogram and cwt functions are used. T o op erate this function y ou can use the demo m-file test ERPanalysis main.m or simply call function b elo w with prop er input parameters: [erp tf, synch eeg, synch emg, trigger time sec, freq vec, time vec] = trigger avg TF erp(eeg, emg, fs, emg onset sampl, duration, method) where the inputs and outputs are describ ed later in Section 3. Fig. 5 is an elaboration of ho w ho w this function works. It is worth noting that the CWT pro duces similar results. Note that several b enc hmark studies such as [25], [26], [27] and [28] are research show-cases of the real-world applica- tions how these TF analysis data can b e put to use. F or instance, as inv estigated and sho wn by [29] and also [27] and [30] insp ecting the irregularities of the TF patterns through entrop y quantities can b e very informative regarding the underlaying motor-task [25], depth of sleep and Neurons activit y 11 ERP & Cortical F unctional Connectivit y MA TLAB T o olb o x Georgia T ec h rate [29, 27], lev els of Alzheimer’s disease [31, 28] and ev en the cognitiv e skills and their resp ectiv e p erformances in sub jects [32, 26, 13]. Figure 5: TF maps estimated through STFT and NBCH metho ds. Note that despite the visible differences, b oth metho ds sho w almost same interpretations (note the relative magnitudes), with resp ect to the trigger time (red dashed line). 2.2.5 Time-course Cortical F unctional Connectivit y Time-course cortical functional connectivit y is usually used to in vestigate the lo cal-scale brain con- nectivit y across differen t electro des within same brain regions (i.e. primary motor cortex). T o this end, Phase Lo cking V alue (PL V) as the common quan tit y for this purp ose [7, 9, 33] are implemented, measuring b oth temp oral dynamics of lo cal-scale and heat-maps of large-scale functional connectivity . The details of eac h metho d is describ ed b elo w. Phase-lo c king V alue (PL V): PL V is a measure for quan tifying ho w constan t the phase difference b et w een t wo signals is. In order to calculate the PL V in frequency f for tw o signals (or channels) x ( t ) and y ( t ), the follo wing steps are required [7, 9]: • Using narrow-band filters cen tered at f , calculate the instantaneous frequency-sp ecific phase v alues φ x ( t, f ) and φ y ( t, f ). • Calculate the instantaneous phase-difference b et ween x ( t ) and y ( t ) and quantify the lo cal sta- bilit y of this phase-difference ov er time as follows: P LV ( f ) = 1 T T X t =1 exp ( j [ φ y ( t, f ) − φ x ( t, f )]) (1) where T is the signal length and the summation is o ver all temp oral samples of the instantaneous phases. PL V v aries betw een 0 and 1, corresp onding to completely non-synchronized signals and complete sync hronization, resp ectiv ely [7, 9]. In simple w olds, considering the difference b etw een firing rates of neurons as phase difference b et ween their electrical p otentials, PL V measures how ” c onne cte d ” differen t neurons in far regions of brain are through quan tifying the difference b etw een their firing rates [7, 9, 33]. 12 ERP & Cortical F unctional Connectivit y MA TLAB T o olb o x Georgia T ec h One very imp ortan t consideration is the phase estimation approac h that one needs to take in to accoun t. F or phase estimation in first step, the T ransfer F unction P erturbation (TFP) metho d in tro duced in [34] and [35] has b een adopted. TFP is a statistical Mon te-Carlo based phase estimation approac h whic h uses infinitesimal p erturbations on filter and other signal estimation parameters in order to accoun t for sto chastic prop erties of EEG signals. According to the discussion presented in Section 2.2.2, using TFP is sp ecifically required due to presence of bac kground EEG noise (whic h in this case cannot b e rejected as simple). It has b een sho wn in [34] and [35] that without using TFP , estimated phase of EEG ma y contain v ariations and spikes whic h do not hav e any ph ysiological origins within brain or are not due to brain activity and are merely side-effects of estimation metho d. F or this purp ose, cerebral signal phase estimation to olb ox [13] has b een used. In this to olb o x, function TCPLV.m is provided for this purp ose which first utilizes phase est.m func- tion to estimate the instantaneous phase (IP) sequence of input signals through intr o duced TFP metho d and then uses PLV PhaseSeq.m function to quantify the phase difference b etw een calculated IPs. F unction TCPLV.m measures time-course PL V for 1se c time-steps either b etw een tw o sp ec- ified electro de channels or b et ween one imp ortan t channel and all other c hannels (resulting in a heat-map across scalp). As recen t examples of using such framew ork and implementation (time- course PL V) we can men tion [35, 27, 25]. T o op erate this function you can use the demo m-file test connectivity main.m or simply call function b elo w with prop er input parameters: tcplv = TCPLV(eeg, fs, freq rng, pairofint, emg onset sampl, duration, pertnum) where the inputs and outputs are describ ed later in Section 3. Figures 6, 7 and 8 are elab orations of ho w this function w orks in either of aforementioned cases. Read the figure captions for more details. Figure 6: C3-F3 PL V time-course dynamics for three different motor tasks in a clinical exp erimen t measured for 7-13Hz, 8-12Hz and 13-30Hz rhythms from left to right resp ectiv ely , within 1 second in terv als. Mo vemen t onset is around 3.5sec. 2.2.6 P air-wise Cortical F unctional Connectivit y P air-wise cortical functional connectivity is usually used to inv estigate the large-scale brain connectiv- it y across scalp (i.e. betw een differen t brain regions). T o this end, the Magnitude Squared Coherence (MSC) and Phase Locking V alue (PL V) as the common quan tities for this purpose [6, 36, 7, 9, 33] are implemen ted, measuring heat-maps of large-scale functional connectivity . Magnitude Squared Coherence (MSC): The con ven tional method presen ted in [6] for measur- ing coherence is based on w eigh ted windo wing of the F ourier transform of signals [33]. Considering 13 ERP & Cortical F unctional Connectivit y MA TLAB T o olb o x Georgia T ec h Figure 7: Electro de placemen ts for time-course PL V maps b etw een C3 and all other EEG channels. x ( t ) and y ( t ) as tw o c hannels of recorded EEG signals, MSC can be measured in frequency f as b elo w: | M S C ( f ) | 2 = | P S D xy ( f ) | 2 P S D xx ( f ) P S D y y ( f ) = | P N i =1 X i ( f ) Y ∗ i ( f ) | 2 P N i =1 | X i ( f ) | 2 P N i =1 | Y i ( f ) | 2 (2) The MSC here, is calculated using a non-o verlapping hamming window using FFT analysis for EEG, in a frequency range of in terest for all trials, and then a v eraged across trials. The mean MSC then is analyzed within 1 se c ond temp or al windows co vering -3 to -2, -2 to -1, -1 to 0, 0 to 1 and 1 to 2 seconds, with resp ect to 0 set as trigger time. MSC measures are calculated for all p ossible electro de com binations, resulting in N × N MSC maps (for N-c hannel EEG recording), represen ting the functional connectivit y across the whole scalp. Similar to PL V, MSC v aries b etw een 0 to 1 [6, 33, 37]. In this to olb o x, function PWCoherence.m is pro vided for this purpose whic h first utilizes BPFilter5.m function to p erform the aforemen tioned CIC filtering and then uses MA TLAB’s internal mscohere.m function to quan tify the frequency-sp ecific MSC v alues. As mentioned, function PWCoherence.m measures MSC maps for 1se c time-steps b etw een all p ossible pairs of electrode. As recent examples of using suc h framework and implementation (pair-wise MSC) w e can men tion [26, 27, 25, 35]. T o op erate this function y ou can use the demo m-file test connectivity main.m or simply call function b elo w with prop er input parameters: pwcoher = PWCoherence(eeg, fs, freq rng, emg onset sampl, duration, plot flag) where the inputs and outputs are describ ed later in Section 3. Figures 9 are elab orations of how how this function w orks in either of aforementioned cases. Read the figure captions for more details. Phase Lo cking V alue (PL V) for Large-scale F unctional Connectivity: Similar to MSC, PL V can b e measured b etw een all p ossible electro de pairs, resulting in PL V maps across entire scalp. W e provided this option in this to olb o x b y implemen ting function PWPLV.m whic h first utilizes phase est.m function to estimate the instantaneous phase (IP) sequence of all c hannels of input data through introduced TFP metho d and then uses PLV PhaseSeq.m function to quantify the phase difference b et w een calculated IPs. F unction TCPLV.m measures pair-wise PL Vs for 1se c time-steps b et w een all p ossible electro de pairs resulting in N × N PL V maps (for N-c hannel EEG recording), rep- resen ting the functional connectivity across en tire scalp. As recent examples of using suc h framework 14 ERP & Cortical F unctional Connectivit y MA TLAB T o olb o x Georgia T ec h Figure 8: Normalized time-course PL V maps b etw een C3 and all other electro des for b eta rh ythms (13-30Hz) for 1 second time bins from -3 prior to 2 seconds after the mo vemen t onset. and implemen tation (time-course PL V) we can men tion [34, 35, 27, 25, 26]. T o op erate this function y ou can use the demo m-file test connectivity main.m or simply call function b elow with prop er input parameters: pwplv = PWPLV(eeg, fs, freq rng, emg onset sampl, duration, pertnum, plot flag) where the inputs and outputs are described later in Section 3. This function also outputs figures similar to Figures 9. 2.2.7 EMG Quantification The purp ose of this section of to olbox is to estimate and quan tify electrom yogram (EMG) signals recorded from active m uscles during p erforming motor tasks. The EMG quan tification is a common practice within Neuroscience communit y in order to ev aluate the work-load of brain (through EMG curv e’s immediate slop e after mo vemen t onset) and also for the rehabilitation purp oses (stronger m uscles after brain stimulation or training). The basic steps for EMG quantification are as b elow [10]: • Removing Electro cardiogram (ECG) artifacts from EMG signals of each trial • F orm the full-rectified signal from the remaining EMG signal of each trial • T rigger-av erage the rectified signals across trials • Extract the trend of the av eraged signal as the quan tified EMG The first step of this pro cess, i.e. remo ving the ECG artifact, can b e pro cessed through several differen t simple or more complex approaches [38]. High-pass frequency filters (HPF) [39], ECG subtraction through QRS-complex detection (F AS) [40], adaptive filtering (AF) approac hes [41, 42], ICA based approac hes [43, 44] and also combined AF-ICA based metho ds [45]. Here in this to olbox ho wev er, we promise to stick with the simple and fast metho ds and th us, implemen t a mo dified high-pass frequency filtering approach not only to gain from the simplicit y but to also impro ve 15 ERP & Cortical F unctional Connectivit y MA TLAB T o olb o x Georgia T ec h Figure 9: MSC maps within 1 second time steps for an upp er-b o dy limb mov ement task. the p erformance accuracy of remo ving ECG artifact from EMG signals. Accordingly , our mo dified ECG remov al approac h includes low-pass filter combined with median filtering ( LPF+MF ). HPF is normally used only to remo ve the ma jor ECG frequency comp onen ts whic h are restricted b y the (1- 30Hz) [46]. The main drawbac k of this approach is due to the fact that HPF will remo ve the frequency comp onen ts of EMG too [46]. Nev ertheless, to o vercome this limitation, we implemented and used a LPF+MF to first detect the ECG signal (instead of blindly removing its comp onen ts) and then p erform a temporal subtraction. T o this end, first w e trac k the ma jor ECG frequency comp onents (1-30Hz) with a fourth order (can b e mo dified within function parameters) elliptic I IR low-pass filter with pass-band ripple and stop-band attenuations of 0.1dB and -50dB, resp ectiv ely . As b efore, the filtering is processed in a forward-bac kward zero-phase manner to av oid any phase distortion due to non-linear phase resp onse of I IR filters. Afterw ards, a median temp oral filter with smal l windo w-length is used to estimate and extract the ECG patterns more accurately [10, 46, 47, 48]. In this to olb o x, function emg quantification.m is provided for this purp ose which first utilizes MA TLAB’s internal ellip function to generate an elliptic I IR filter and then uses BaseLine2.m function t wice; first to trac k and remov e the ECG comp onen ts and then to quan tify the EMG signal as describ ed before. T o op erate this function y ou can use the demo m-file test EMGanalysis main.m or simply call function b elo w with prop er input parameters: [emg bl, synch emg2, ecg estimate2 bl, time vec] = emg quantification(emg data, fs, emg onset sampl, duration) where the inputs and outputs are describ ed later in Section 3. Fig 10 is an elab oration of ho w this function works. Performance of simple HPF is also sho wn for comparison and elab orating the reliability of the prop ose approac h (i.e. LPF+MF). Maximum magnitude (muscle activ ation strength), activ ation slop e (m uscle activ ation speed) and immediate activ ation slop e after mov ement onset (muscle-brain w ork load) are some p otentially imp ortan t information captured from quan tified EMG through our pro vided function. See Fig 11 for graphical elab oration of these concepts. 16 ERP & Cortical F unctional Connectivit y MA TLAB T o olb o x Georgia T ec h Figure 10: The aforemen tioned pro cedure suggested to extract the ECG patterns from EMG signal. Note the final blue curve as the extracted ECG signal. The blue curv e is then subtracted from the red one to form the ECG-free EMG signal. EMG Mov ement Onset Detection: As promised b efore in Section 2.2.3, here, w e pro vide users with a simple but fast and reliable EMG onset estimation function. The onset detection in EMG signals has a broad literature in whic h v arious methods aimed to satisfy differen t purposes and ap- plications are prop osed and discussed. The simplest prop osed approac h for this purp ose is the single thresholding metho d [49] which later on has b een mo dified in to double-threshold metho ds [50, 51]. Although there are sev eral complex highly sensitiv e metho ds for onset detection, their utility really dep ends on users’ application of interest and thus to reduce computational cost, here we designed and implemented a simple t wo-stage thresholding metho d whic h is highly reliable for ERP applica- tion. The prop osed tw o-stage thresholding metho d is basically formed based on double-thresholding framew ork (whic h includes three steps) [50, 51]. The three steps are (1) signal conditioning (which is done in prepro cessing phase), (2) detection of an ev ent (p erformed b y calculating a window ed standard deviation ov er time, named as STD vector) and (3) exact detection of the mov ement time (p erformed b y using a threshold on STD v ector’s temp oral trend). As reported previously in [50] and [51], mo ving temp oral filtering and thresholding methods are very common and could b e satisfactory based on application requiremen ts. Additionally , according to discussions in [50] and [51], parameters and thresholds in suc h approaches need to b e set empirically based on the data and application. In this to olb o x, function emg onset.m is pro vided for this purp ose whic h follo ws the exact pro cedure as describ ed ab ov e. T o op erate this function you can use the demo m-file test EMGanalysis main.m or simply call function b elo w with prop er input parameters: [onset sampl, onset time] = emg onset(emg, fs, W, th coeff, Trl) where the inputs and outputs are describ ed later in Section 3. Fig 12 is an elaboration of how this function w orks. It w orth noting that, although the implemen ted pro cedure is not as sensitiv e as complex new metho ds, it still satisfies our requirements for the application of ERP analysis [47, 48]. 17 ERP & Cortical F unctional Connectivit y MA TLAB T o olb o x Georgia T ec h Figure 11: Quan tified EMG curves ov er 50 trials of t wo differen t tasks. Note the represen ted imp or- tan t parameters derived from quan tified EMG. This is due to the fact that ERP is calculated by a veraging o v er a large num b er of trials and th us here w e are interested in in tra-trial v ariations and information rather than inter-trial ones. 3 Reference Man ual 3.1 bdf2mat main.m bdf2mat main.m Purp ose: Reading EEG/EMG signal from b df files, prepro cessing and conditioning. Synopsis (global mo de): [eeg data, emg data, fs] = bdf2mat main(trl num, elec num, emg ch, eeg ch, filename) Synopsis (lo cal mo de): [eeg data, emg data, fs, emg onset sampl, emg onset time] = bdf2mat main(trl num, elec num, emg ch, eeg ch, filename, drift flag, onset flag) Inputs: 18 ERP & Cortical F unctional Connectivit y MA TLAB T o olb o x Georgia T ec h Figure 12: The implemented EMG mo vemen t onset detection pro cedure. Input Description trl num n umber of trials elec num n umber of electro des used to record EEG emg ch EMG c hannel of interest eeg ch scalar or double v ector of EEG channels of interest filename file name format as a string drift flag baseline drift rejection flag, (options: ’drift’ , ’nodrift’ ) onset flag onset detection flag, (options: 1, 0) Defaults: Input Default V alues drift flag ’drift’ onset flag 1 Outputs: Output Description eeg data prepro cessed EEGs of the selected channel from all trials emg data prepro cessed EMGs of the selected channel from all trials fs sampling frequency (Hz) emg onset sampl sample num b er of the mov ement onset emg onset time corresponding time of mov ement onset (Seconds) 19 ERP & Cortical F unctional Connectivit y MA TLAB T o olb o x Georgia T ec h Notes: • An empty brack et [.] Must b e assigned to not-sp ecified v alues. • EMG and EEG c hannels of interest ha ve to be a doubles (i.e. either an integer or a vector of indices). • filename needs to b e defined in a w ay that trl num can b e used as an index to trac k and load all of the stored data. F or instance, data file names may b e defined as filename i where i = 1 , 2 , ..., N in which N represents the total num b er of data files. Refer to our sample data included in this to olb o x to see another example of this, if needed. • One should exp ect the emg onset sampl and emg onset time within output argumen ts in case they flagged the onset detection as 1 within input. 3.2 trigger synch.m trigger synch.m Purp ose: Synchronizing EEG/EMG signals according to mo vemen t onset time. Synopsis (global mo de): [ensemble eeg, synch eeg, trigger time sec, time vec] = trigger synch(eeg, fs, onset time) Synopsis (lo cal mo de): [ensemble eeg, synch eeg, trigger time sec, time vec, synch emg] = trigger synch(eeg, fs, onset time, duration, emg) Inputs: Input Description eeg cell array containing EEG channels of in terest from all trials fs sampling frequency (Hz) onset time v ector of onset times (Seconds) duration required signal duration after mo vemen t onset (Seconds) emg cell array containing EMG channels of in terest from all trials Defaults: Input Default V alues duration 2 emg { . } 20 ERP & Cortical F unctional Connectivit y MA TLAB T o olb o x Georgia T ec h Outputs: Output Description ensemble eeg ensem bles of EEG trials in a matrix synch eeg sync hronized EEG signals based on trigger time trigger time sec trigger onset flag (Seconds) time vec time v ector required for ERP plots synch emg sync hronized EMG signals based on trigger time Notes: • An empty brack et [.] Must b e assigned to not-sp ecified v alues. • The provided function ’ bdf2mat main.m ’ outputs the compatible EEG/EMG data for this function; how ever, y ou can simply store y our data in a cell arra y in whic h each elemen t includes one data trial(s) of in terest. • The output argument ’ ensemble eeg ’ is an essential v ariable to b e used within the provided function ’ trigger avg erp.m ’ and th us you can simply replace it with ~ sym b ol if using this function indep enden tly . • One should exp ect the synch emg (e.g. synchronized EMG data) within output arguments in case they inputed EMG data. 3.3 trigger avg erp.m trigger avg erp.m Purp ose: T rigger-a veraged ERP time-course estimation function to extract the temp oral dynamics of ev ent-related p oten tials. Synopsis (global mo de): [erp, synch eeg, trigger time sec, time vec] = trigger avg erp(eeg, fs, freq band, onset time) Synopsis (lo cal mo de): [erp, synch eeg, trigger time sec, time vec, synch emg] = trigger avg erp(eeg, fs, freq band, onset time, duration, emg) Inputs: Input Description eeg cell array containing EEG channels of in terest from all trias fs sampling frequency (Hz) freq band frequency band of in terest (refer to Notes b elow) onset time v ector of onset times (Seconds) duration required signal duration after mo vemen t onset (Seconds) emg cell array containing EMG channels of in terest from all trials 21 ERP & Cortical F unctional Connectivit y MA TLAB T o olb o x Georgia T ec h Defaults: Input Default V alues duration 2 emg { . } Outputs: Output Description erp extracted ERP signal synch eeg sync hronized EEG signals based on trigger time trigger time sec trigger onset flag (Seconds) time vec time v ector required for ERP plots synch emg sync hronized EMG signals based on trigger time Notes: • An empty brack et [.] Must b e assigned to not-sp ecified v alues. • Av ailable options for freq band are: ’ delta ’, ’ theta ’, ’ alpha ’, ’ beta ’ or ’ gamma ’ where are defined in ranges 1-4(Hz), 4-8(Hz), 8-12(Hz), 12-32(Hz) and 32-80Hz, resp ectiv ely . In case you need to c hange these ranges, open up the function script and c hange f0 and bw v alues for the band you wish to alter (i.e. lines 105 to 115). Note that f0 and bw are center and bandwidth of the frequency range, resp ectiv ely . • The provided function ’ bdf2mat main.m ’ outputs the compatible EEG/EMG data for this function; how ever, y ou can simply store y our data in a cell arra y in whic h each elemen t includes one data trial(s) of in terest. • One should exp ect the synch emg (e.g. synchronized EMG data) within output arguments in case they inputed EMG data. 3.4 trigger avg TF erp.m trigger avg TF erp.m Purp ose: T rigger-a veraged ERP T/F representation to track the time-frequency dynamics of even t- related p oten tials. Synopsis (global mo de): [erp tf, synch eeg, trigger time sec, time vec, freq vec] = trigger avg TF erp(eeg, fs, onset time) Synopsis (lo cal mo de): [erp tf, synch eeg, trigger time sec, time vec, freq vec, synch emg] = trigger avg TF erp(eeg, fs, onset time, duration, method, emg) 22 ERP & Cortical F unctional Connectivit y MA TLAB T o olb o x Georgia T ec h Inputs: Input Description eeg cell array containing EEG channels of in terest from all trials fs sampling frequency (Hz) onset time v ector of onset times (Seconds) duration required signal duration after mo vemen t onset (Seconds) method metho d for T/F representation, (options: ’ STFT ’, ’ CWT ’, ’ NBCH ’) emg cell array containing EMG channels of in terest from all trials Defaults: Input Default V alues duration 2 method ’ STFT ’ emg { . } Outputs: Output Description erp tf estimated ERP time-frequency map synch eeg sync hronized eeg signals based on trigger time trigger time sec trigger onset flag (Seconds) time vec time v ector required for ERP plots freq vec frequency v ector required for ERP map plots synch emg sync hronized emg signals based on trigger time Notes: • An empty brack et [.] Must b e assigned to not-sp ecified v alues. • The provided function ’ bdf2mat main.m ’ outputs the compatible EEG/EMG data for this function; how ever, y ou can simply store y our data in a cell arra y in whic h each elemen t includes one data trial(s) of in terest. • One should exp ect the synch emg (e.g. synchronized EMG data) within output arguments in case they inputed EMG data. 3.5 erp quantification.m erp quantification.m Purp ose: ERP area (ERD and ERS even ts’ area) quantification. Synopsis (global mo de): [erd area, ers area, quant erp] = erp quantification(erp, fs, trigger time) 23 ERP & Cortical F unctional Connectivit y MA TLAB T o olb o x Georgia T ec h Synopsis (lo cal mo de): [erd area, ers area, quant erp] = erp quantification(erp, fs, trigger time, ref per, cof intv) Inputs: Input Description erp v ector of estimated ERP signal fs sampling frequency (Hz) trigger time trigger onset flag (Seconds) ref per v ector of reference p erio d (refer to Notes b elo w) cof intv confidence in terv al co efficient Defaults: Input Default V alues ref per [-1.3, -0.3] Seconds cof intv 3 Outputs: Output Description erd area ERD ev ents area ers area ERS ev ents area quant erp ERP with quan tified magnitude Notes: • An empty brack et [.] Must b e assigned to not-sp ecified v alues. • Reference p erio d v ariable ’ ref per ’ ha ve to b e a double vector in [-a, -b] form where -a and -b are the edges of reference segment in Seconds. Min us sign sho ws that this p eriod b elongs to b efore mov emen t onset (i.e. trigger time). • erd area and ers area are stored in a v ariable-size cell array the size of which dep end on the duration of ERP signal after mo v ement onset. F or instance, in figure 4 there are 2 ERD ev ents and only one ERS even t detected. As a results, the corresp onding area cell arrays will b e of size 1 × 2 and 1 × 1, resp ectiv ely . 3.6 TCPLV.m TCPLV.m Purp ose: PL V temporal dynamics estimated within 1 Second time-steps for an y arbitrary time range b efore and after mov emen t onset. 24 ERP & Cortical F unctional Connectivit y MA TLAB T o olb o x Georgia T ec h Synopsis (global mo de): tcplv = TCPLV(eeg, fs, onset time) Synopsis (lo cal mo de): tcplv = TCPLV(eeg, fs, onset time, freq rng, duration, pairofint, pertnum) Inputs: Input Description eeg cell array containing eeg channels of in terest from all trials fs sampling frequency (Hz) onset time v ector of onset times (Seconds) freq rng frequency range of in terest (Hz) duration required temp oral duration for tracking PL V dynamics (Seconds) pairofint channel pair of interest for PL V time-course pertnum n umber of p erturbations while using the TFS phase estimation metho d Defaults: Input Default V alues freq rng [12, 32] (Hz) duration [-3, 2] (Seconds) pairofint ’all’ pertnum 100 Outputs: Output Description tcplv estimated time-course phase lo c king v alue (PL V) dynamics b etw een eeg pairs of in terest Notes: • An empty brack et [.] Must b e assigned to not-sp ecified v alues. • freq rng has to b e in [a, b] form double vector where ’ a ’ and ’ b ’ are edges of the frequency band of in terest in Hz. • duration has to b e in [-a, b] form double vector where ’ a ’ is the required duration (Seconds) prior to mo vemen t onset and ’ b ’ is the required duration (Seconds) after the mov ement onset. The sp ecified duration will b e segmented in to 1-sec-long windows to calculate PL V. Refer to Section 2.2.5 for more details. • pairofint can either b e a double vector or ’ all ’ string. As a double vector it has to b e in [a, b] form resulting in PL V measures betw een electro de num b er a and electro de n um b er b . Moreo ver, if y ou use ’ all ’, a PL V map will b e calculated betw een C3 electro de and all other electro des to co ver large-scale functional connectivity dynamics b et ween motor cortex and other brain regions. In this case, C3 is chosen as the default electrode; ho wev er, if y ou wish to change 25 ERP & Cortical F unctional Connectivit y MA TLAB T o olb o x Georgia T ec h this for y our data, op en up the script, scroll to line 143 of co de and change the v alue 6 to you electro de num b er of interest. 3.7 PWPLV.m PWPLV.m Purp ose: Pair-wise Phase-Lo cking V alue (PL V) dynamics estimated within 1-Second time-steps for an y arbitrary time range and all electro de pairs. Synopsis (global mo de): pwplv = PWPLV(eeg, fs, onset time) Synopsis (lo cal mo de): pwplv = PWPLV(eeg, fs, onset time, freq rng, duration, pertnum, plot flag) Inputs: Input Description eeg cell array containing eeg channels of in terest from all trials fs sampling frequency (Hz) onset time v ector of onset times (Seconds) freq rng frequency range of in terest (Hz) duration required temp oral duration for tracking PL V dynamics (Seconds) pertnum n umber of p erturbations while using the TFS phase estimation metho d plot flag flag to visualize the results or not (options: ’ plot ’, ’ noplot ’) Defaults: Input Default V alues freq rng [12, 32] (Hz) duration [-3, 2] (Seconds) pertnum 100 plot flag ’ plot ’ Outputs: Output Description pwplv estimated pairwise phase lo c king v alue (PL V) b etw een all p ossible electro de pairs Notes: • An empty brack et [.] Must b e assigned to not-sp ecified v alues. • freq rng has to b e in [a, b] form double vector where ’ a ’ and ’ b ’ are edges of the frequency band of in terest in Hz. 26 ERP & Cortical F unctional Connectivit y MA TLAB T o olb o x Georgia T ec h • duration has to b e in [-a, b] form double vector where ’ a ’ is the required duration (Seconds) prior to mo vemen t onset and ’ b ’ is the required duration (Seconds) after the mov ement onset. The sp ecified duration will b e segmented in to 1-sec-long windows to calculate PL V. Refer to Section 2.2.5 for more details. • This function utilizes all of the electro des (i.e. not just motor cortex electro de C3) and all p ossible combinations to calculate PL V v alues and generate connectivity maps. Refer to Section 2.2.6 for more details. 3.8 PWCoherence.m PWCoherence.m Purp ose: Pair-wise Magnitude-Squared Coherence (MSC) dynamics estimated within 1-Second time-steps for an y arbitrary time range and all electro de pairs. Synopsis (global mo de): pwcoher = PWCoherence(eeg, fs, onset time) Synopsis (lo cal mo de): pwcoher = PWCoherence(eeg, fs, onset time, freq rng, duration, plot flag) Inputs: Input Description eeg cell array containing eeg channels of in terest from all trials fs sampling frequency (Hz) onset time v ector of onset times (Seconds) freq rng frequency range of in terest (Hz) duration required temp oral duration for tracking PL V dynamics (Seconds) plot flag flag to visualize the results or not (options: ’ plot ’, ’ noplot ’) Defaults: Input Default V alues freq rng [12, 32] (Hz) duration [-3, 2] (Seconds) plot flag ’ plot ’ Outputs: Output Description pwcoher estimated pairwise magnitude squared coherence (MSC) b et w een all p ossible electro de pairs 27 ERP & Cortical F unctional Connectivit y MA TLAB T o olb o x Georgia T ec h Notes: • An empty brack et [.] Must b e assigned to not-sp ecified v alues. • freq rng has to b e in [a, b] form double vector where ’ a ’ and ’ b ’ are edges of the frequency band of in terest in Hz. • duration has to b e in [-a, b] form double vector where ’ a ’ is the required duration (Seconds) prior to mo vemen t onset and ’ b ’ is the required duration (Seconds) after the mov ement onset. The sp ecified duration will b e segmented in to 1-sec-long windows to calculate PL V. Refer to Section 2.2.5 for more details. • This function utilizes all of the electro des (i.e. not just motor cortex electro de C3) and all p ossible com binations to calculate MSC v alues and generate connectivit y maps. Refer to Sec- tion 2.2.6 for more details. 3.9 emg quantification.m emg quantification.m Purp ose: EMG signal analysis and quantification. Synopsis (global mo de): [emg quant, synch emg2, ecg estimate2 bl, time vec] = emg quantification(emg data, fs, emg onset sampl) Synopsis (lo cal mo de): [emg quant, synch emg2, ecg estimate2 bl, time vec] = emg quantification(emg data, fs, emg onset sampl, duration) Inputs: Input Description emg data cell arra y containing EMG signals of all trials fs sampling frequency (Hz) emg onset sampl vector con taining mov ement onset samples of all trials duration duration of signal required after onset Defaults: Input Default V alues duration 2 28 ERP & Cortical F unctional Connectivit y MA TLAB T o olb o x Georgia T ec h Outputs: Output Description emg quant v ector containing quan tified EMG v alues synch emg2 cell arra y containing sync hronized EMG trials based on mov emen t onset ecg estimate2 bl extracted ECG signal from EMG channels time vec time-v ector required for plotting quantified EMG 3.10 drift reject.m drift reject.m Purp ose: Drift (baseline wander) cancellation from biosignal recordings. Synopsis (global mo de): sig = drift reject(raw sig, L1) Synopsis (lo cal mo de): sig = drift reject(raw sig, L1, L2, approach) Inputs: Input Description raw sig matrix or v ector of raw recordings L1 first stage windo w length (sample) L2 second stage windo w length (sample) approach filtering approac h, (options: ’md’ or ’mn’) Defaults: Input Default V alues L2 L1 (sample) approach ’mn’ Outputs: Output Description sig matrix or v ector of drift-rejected signals Notes: • An empty brack et [.] Must b e assigned to not-sp ecified v alues. 29 ERP & Cortical F unctional Connectivit y MA TLAB T o olb o x Georgia T ec h 3.11 emg onset.m emg onset.m Purp ose: EMG onset detection function based on in tro duced tw o-stage thresholding approac h in Section 2.2.7. Synopsis (global mo de): [onset sampl, onset time] = emg onset(emg, fs, W) Synopsis (lo cal mo de): [onset sampl, onset time] = emg onset(emg, fs, W, th coeff, Trl) Inputs: Input Description emg the emg signal fs EMG signal’s sampling frequency (Hz) W windo w length for STD calculation (sample) th coeff threshold co eff for onset detection Trl curren t trial num b er Defaults: Input Default V alues th coeff 1 Trl — Outputs: Output Description onset sampl sample n umber of the mov ement onset onset time corresp onding time of mov emen t onset Notes: • th coeff is a co efficient that will b e multiplied b y the standard deviation of the EMG baseline and by default is set to 1 so that the estimation threshold will b e equal to one-standard-deviation of baseline (i.e. 1 × STD { emg } ). • An empty brack et [.] Must b e assigned to not-sp ecified v alues. 30 ERP & Cortical F unctional Connectivit y MA TLAB T o olb o x Georgia T ec h 3.12 phase est.m phase est.m Purp ose: Instantaneous phase estimation by the T ransfer F unction Perturbation (TFP) metho d [34, 35, 13]. Synopsis (global mo de): [phase avg, freq avg, amp avg, analytic sig avg] = phase est(sig, fs, f0, bw base) Synopsis (lo cal mo de): [phase avg, freq avg, amp avg, analytic sig avg] = phase est(sig, fs, f0, bw base, pertnum) Inputs: Input Description sig input raw signal fs sampling frequency (Hz) f0 cen ter frequency of the passband (Hz) bw base bandwidth of the frequency filter (Hz) pertnum n umber of p erturbations while using the TFP phase estimation metho d Defaults: Input Default V alues pertnum 100 Outputs: Output Description phase avg estimated instan taneous phase of input signal freq avg estimated instan taneous frequency of input signal amp avg estimated instan taneous env elop e of input signal analytic sig avg generated analytic form of input signal Notes: • pertnum is by default set to 100, ho w ever the v alue mostly dep ends on the application and also the required level of reliability . Nevertheless, 100 has b een tested in sev eral applications b efore and is considered enough [35, 27, 25, 26]. • TFP p erturbation parameters are set according to the findings of [34] and are c hosen in a wa y that are ph ysiologically irrelev ant. In case one needs to change these v alues due to different application sp ecs, refer to lines 83 to 88 of co de. • An empty brack et [.] Must b e assigned to not-sp ecified v alues. 31 ERP & Cortical F unctional Connectivit y MA TLAB T o olb o x Georgia T ec h 3.13 PLV PhaseSeq.m PLV PhaseSeq.m Purp ose: Calculating Phase Lo cking V alue (PL V) matrix (Pairwise PL V) using phase sequences [13]. Synopsis: PLV = PLV PhaseSeq(phase sig) PLV = PLV PhaseSeq(phase sig1, phase sig2, phase sig3, ...) Inputs: Input Description phase sig input phase matrix phase sig1 input phase v ector #1 phase sig2 input phase v ector #2 • • • • Outputs: Output Description PLV P airwise PL V matrix Notes: • While using the first case, the phase sig hav e to b e a matrix with at least tw o ro ws where eac h row represen ts a phase signal. In second case, each of the phase sig1...phase sign are ro w vectors of phase sequences. This option is pro vided in case that someone needs to calculate the PL V matrix b et ween separate phase signals. 3.14 sig trend.m sig trend.m Purp ose: Calculating the trend of a signal using lo cal minima. Synopsis: [Tr sig, loc] = sig trend(sig) 32 ERP & Cortical F unctional Connectivit y MA TLAB T o olb o x Georgia T ec h Inputs: Input Description sig input ra w signal Outputs: Output Description Tr sig trend v ector loc returns the lo cations required for plotting the trend 3.15 task separator.m task separator.m Purp ose: T ask based separation of data to av oid memory ov eruse. Synopsis (global mo de): sep file names = task separator(filename) Inputs: Input Description filename original whole-data file name as a string Outputs: Output Description sep file names cell array con taining separated files’ names 4 Ac kno wledgmen t The authors would lik e to thank Dr. Maysam Ghov anlo o 2 , Dr. Minoru Shinohara 3 , Dr. Boris I. Prilutsky 4 , Dr. Andrew J. Butler 5 and Zhenxuan Zhang 6 for their insightful discussions and commen ts. 2 GT-Bionics Lab, School of Electrical and Computer Engineering, Georgia T ech, Atlan ta, GA, USA 3 Human Neuromuscular Physiology Lab, School of Biological Sciences, Georgia T ec h, A tlanta, GA, USA 4 Biomec hanics and Motor Con trol Lab, Sc ho ol of Biological Sciences, Georgia T ech, Atlan ta, GA, USA 5 B.F. Lewis School of Nursing & Health Professions, Georgia State Univ ersit y , Atlan ta, GA, USA 6 GT-Bionics Lab, School of Electrical and Computer Engineering, Georgia T ech, Atlan ta, GA, USA 33 ERP & Cortical F unctional Connectivit y MA TLAB T o olb o x Georgia T ec h 5 References References [1] G. Pfurtscheller and F. L. Da Silv a, “Even t-related eeg/meg sync hronization and desync hroniza- tion: basic principles,” Clinic al neur ophysiolo gy , v ol. 110, no. 11, pp. 1842–1857, 1999. [2] T. C. Handy , Event-r elate d p otentials: A metho ds handb o ok . MIT press, 2005. [3] S. J. Luck, An intr o duction to the event-r elate d p otential te chnique . MIT press, 2014. [4] S. Makeig, S. Deb ener, J. Onton, and A. Delorme, “Mining even t-related brain dynamics,” T r ends in c o gnitive scienc es , vol. 8, no. 5, pp. 204–210, 2004. [5] M. D. Greicius, B. Krasno w, A. L. Reiss, and V. Menon, “F unctional connectivit y in the resting brain: a net w ork analysis of the default mo de hypothesis,” Pr o c e e dings of the National A c ademy of Scienc es , vol. 100, no. 1, pp. 253–258, 2003. [6] G. Carter, C. Knapp, and A. Nuttall, “Estimation of the magnitude-squared coherence function via ov erlapp ed fast fourier transform pro cessing,” IEEE tr ansactions on audio and ele ctr o ac ous- tics , v ol. 21, no. 4, pp. 337–344, 1973. [7] J.-P . Lachaux, E. Ro driguez, J. Martinerie, and F. J. V arela, “Measuring phase sync hrony in brain signals,” Human br ain mapping , v ol. 8, no. 4, pp. 194–208, 1999. [8] F. V arela, J.-P . Lachaux, E. Ro driguez, and J. Martinerie, “The brainw eb: phase synchroniz ation and large-scale in tegration,” Natur e r eviews neur oscienc e , vol. 2, no. 4, p. 229, 2001. [9] M. G. Rosenblum, A. S. Pik ovsky , and J. Kurths, “Phase sync hronization of c haotic oscillators,” Physic al r eview letters , vol. 76, no. 11, p. 1804, 1996. [10] A. L. Ricamato and J. M. Hidler, “Quantification of the dynamic prop erties of emg patterns during gait,” Journal of ele ctr omyo gr aphy and kinesiolo gy , v ol. 15, no. 4, pp. 384–392, 2005. [11] C. B. W alter, “T emp oral quantification of electrom yograph y with reference to motor control researc h,” Human Movement Scienc e , v ol. 3, no. 1-2, pp. 155–162, 1984. [12] R. Sameni, “The op en-source electrophysiological to olbox (oset), v ersion 3.1, 2014,” URL http://www. oset. ir , 2014. [13] E. Sera j, “Cerebral signal phase analysis to olbox–user guide,” arXiv pr eprint arXiv:1610.02249 , 2016. [14] G. Tc hesla vski, “eeg b df reader matlab function.” [Online]. Av ailable: h ttps://www.mathw orks. com/matlab cen tral/fileexc hange/13070- eeg- b df- reader?fo cused=5083421&tab=function [15] B. BioSemi, “Biosemi activet w o.[eeg system],” Amster dam: BioSemi , 2011. [16] L. Smith, “Activet w o system op erating guidelines,” Corte ch Solutions, Inc. , 2009. [17] T. C. T echnologies, “10/20 system p ositioning manual.” 2012. [18] G. Rep o vs, “Dealing with noise in eeg recording and data analysis,” in Informatic a Me dic a Slovenic a , vol. 15, no. 1, 2010, pp. 18–25. 34 ERP & Cortical F unctional Connectivit y MA TLAB T o olb o x Georgia T ec h [19] G. A. Light, L. E. Williams, F. Mino w, J. Spro ck, A. Rissling, R. Sharp, N. R. Sw erdlow, and D. L. Braff, “Electro encephalography (eeg) and ev ent-related p otentials (erps) with h uman participan ts,” Curr ent pr oto c ols in neur oscienc e , vol. 52, no. 1, pp. 6–25, 2010. [20] J. B. Nitschk e, G. A. Miller, and E. W. Co ok, “Digital filtering in eeg/erp analysis: Some tec hnical and empirical comparisons,” Behavior R ese ar ch Metho ds, Instruments, & Computers , v ol. 30, no. 1, pp. 54–67, 1998. [21] R. Ly ons, “Understanding cascaded in tegrator-com b filters,” Emb e d Syst Pr o gr am , vol. 18, no. 4, pp. 14–27, 2005. [22] G. Pfurtsc heller, “Graphical display and statistical ev aluation of even t-related desync hronization (erd),” Ele ctr o enc ephalo gr aphy and clinic al neur ophysiolo gy , vol. 43, no. 5, pp. 757–760, 1977. [23] B. Graimann and G. Pfurtscheller, “Quantification and visualization of ev en t-related c hanges in oscillatory brain activity in the time–frequency domain,” Pr o gr ess in br ain r ese ar ch , v ol. 159, pp. 79–97, 2006. [24] L. Cohen, Time-fr e quency analysis . Prentice hall, 1995, v ol. 778. [25] E. Sera j and F. Karimzadeh, “Impro ved detection rate in motor imagery based b ci systems using com bination of robust analytic phase and env elop e features,” in Ele ctric al Engine ering (ICEE), 2017 Ir anian Confer enc e on . IEEE, 2017, pp. 24–28. [26] E. Sera j, “An inv estigation on the utility and reliability of electro encephalogram phase signal up on interpreting cognitiv e resp onses in the brain: A critical discussion,” Journal of A dvanc e d Me dic al Scienc es and Applie d T e chnolo gies , v ol. 2, no. 4, pp. 299–312, 2017. [27] F. Karimzadeh, R. Bo ostani, E. Sera j, and R. Sameni, “A distributed classification pro cedure for automatic sleep stage scoring based on instan taneous electro encephalogram phase and en velope features,” IEEE T r ansactions on Neur al Systems and R ehabilitation Engine ering , v ol. 26, no. 2, pp. 362–370, 2018. [28] E. Sera j, M. Y azdi, and N. Shahparian, “fmri based cerebral instantaneous parameters for automatic alzheimer’s, mild cognitive impairment and health y sub ject classification,” arXiv pr eprint arXiv:1904.07441 , 2019. [29] R. Bo ostani, F. Karimzadeh, and M. Nami, “A comparative review on sleep stage classification metho ds in patients and healthy individuals,” Computer metho ds and pr o gr ams in biome dicine , v ol. 140, pp. 77–91, 2017. [30] F. Karimzadeh, E. Sera j, R. Bo ostani, and M. T orabi-Nami, “Presen ting efficient features for automatic cap detection in sleep eeg signals,” in 2015 38th International Confer enc e on T ele c om- munic ations and Signal Pr o c essing (TSP) . IEEE, 2015, pp. 448–452. [31] E. Sera j, M. Y azdi, and N. Shahparian, “Instantaneous fmri based cerebral parameters for automatic alzheimer, mild cognitiv e impairmen t and health y sub ject classification,” Journal of inte gr ative neur oscienc e , v ol. 18, no. 3, pp. 261–268, 2019. [32] F. Karimzadeh, M. Nami, and R. Bo ostani, “Sleep microstructure dynamics and neuro cognitiv e p erformance in obstructive sleep apnea syndrome patien ts,” Journal of inte gr ative neur oscienc e , v ol. 16, no. 2, pp. 127–142, 2017. [33] E. Sera j, “Cerebral synchron y assessmen t: A general review on cerebral signals’ synchronization estimation concepts and metho ds,” arXiv pr eprint arXiv:1612.04295 , 2016. 35 ERP & Cortical F unctional Connectivit y MA TLAB T o olb o x Georgia T ec h [34] R. Sameni and E. Sera j, “A robust statistical framew ork for instan taneous electro encephalogram phase and frequency estimation and analysis,” Physiolo gic al me asur ement , v ol. 38, no. 12, p. 2141, 2017. [35] E. Sera j and R. Sameni, “Robust electro encephalogram phase estimation with applications in brain-computer in terface systems,” Physiolo gic al me asur ement , vol. 38, no. 3, p. 501, 2017. [36] F. T. Sun, L. M. Miller, and M. D’esp osito, “Measuring interregional functional connectivit y using coherence and partial coherence analyses of fmri data,” Neur oimage , v ol. 21, no. 2, pp. 647–658, 2004. [37] J. Groß, J. Kujala, M. H¨ am¨ al¨ ainen, L. Timmermann, A. Schnitzler, and R. Salmelin, “Dynamic imaging of coheren t sources: studying neural in teractions in the h uman brain,” Pr o c e e dings of the National A c ademy of Scienc es , v ol. 98, no. 2, pp. 694–699, 2001. [38] N. W. Willigen burg, A. Daffertshofer, I. Kingma, and J. H. v an Die¨ en, “Remo ving ecg con tami- nation from emg recordings: A comparison of ica-based and other filtering pro cedures,” Journal of ele ctr omyo gr aphy and kinesiolo gy , vol. 22, no. 3, pp. 485–493, 2012. [39] J. D. Drak e and J. P . Callaghan, “Elimination of electro cardiogram con tamination from elec- trom yogram signals: An ev aluation of currently used remov al techniques,” Journal of ele ctr omyo- gr aphy and kinesiolo gy , v ol. 16, no. 2, pp. 175–187, 2006. [40] K. Aminian, C. Ruffieux, and P . Rob ert, “Filtering b y adaptiv e sampling (fas),” Me dic al and Biolo gic al Engine ering and Computing , v ol. 26, no. 6, pp. 658–662, 1988. [41] S. Abbasp our and A. F allah, “Remo ving ecg artifact from the surface emg signal using adaptive subtraction tec hnique,” Journal of biome dic al physics & engine ering , vol. 4, no. 1, p. 33, 2014. [42] F. Nougarou, D. Massicotte, and M. Descarreaux, “Efficient procedure to remov e ecg from semg with limited deteriorations: Extraction, quasi-p eriodic detection and cancellation,” Biome dic al Signal Pr o c essing and Contr ol , vol. 39, pp. 1–10, 2018. [43] S. Abbasp our, M. Lind´ en, and H. Gholamhosseini, “Ecg artifact remov al from surface emg signal using an automated metho d based on wa v elet-ica.” in pHe alth , 2015, pp. 91–97. [44] M. Chen, X. Zhang, X. Chen, M. Zh u, G. Li, and P . Zhou, “F astica p eel-off for ecg interference remo v al from surface emg,” Biome dic al engine ering online , vol. 15, no. 1, p. 65, 2016. [45] Y. Li, X. Chen, X. Zhang, and P . Zhou, “Ecg artifact remo v al from emg recordings using indep enden t comp onen t analysis and adapted filter,” in Neur al Engine ering (NER), 2013 6th International IEEE/EMBS Confer enc e on . IEEE, 2013, pp. 347–350. [46] S. Akselro d, D. Gordon, F. A. Ub el, D. C. Shannon, A. Berger, and R. J. Cohen, “Po w er sp ectrum analysis of heart rate fluctuation: a quan titative prob e of b eat-to-b eat cardiov ascular con trol,” scienc e , vol. 213, no. 4504, pp. 220–222, 1981. [47] F. Barlaam, M. Descoins, O. Bertrand, T. Hasbroucq, F. Vidal, C. Assaiante, and C. Schmitz, “Time–frequency and erp analyses of eeg to characterize an ticipatory p ostural adjustmen ts in a biman ual load-lifting task,” F r ontiers in human neur oscienc e , vol. 5, p. 163, 2011. [48] O. E. Krigolson, “Ev en t-related brain potentials and the study of reward pro cessing: Metho d- ological considerations,” International Journal of Psychophysiolo gy , 2017. [49] P . R. Ca v anagh and P . V. Komi, “Electromec hanical delay in h uman skeletal muscle under concen tric and eccentric contractions,” Eur op e an journal of applie d physiolo gy and o c cup ational physiolo gy , vol. 42, no. 3, pp. 159–163, 1979. 36 ERP & Cortical F unctional Connectivit y MA TLAB T o olb o x Georgia T ec h [50] P . Bonato, T. D’Alessio, and M. Knaflitz, “A statistical metho d for the measurement of muscle activ ation in terv als from surface my o electric signal during gait,” IEEE T r ansactions on biome d- ic al engine ering , v ol. 45, no. 3, pp. 287–299, 1998. [51] J. Drapa la, K. Brzostowski, A. Szpala, and A. Rutk owsk a-Kucharsk a, “Two stage emg onset detection metho d,” Ar chives of Contr ol Scienc es , vol. 22, no. 4, pp. 427–440, 2012. 37
Original Paper
Loading high-quality paper...
Comments & Academic Discussion
Loading comments...
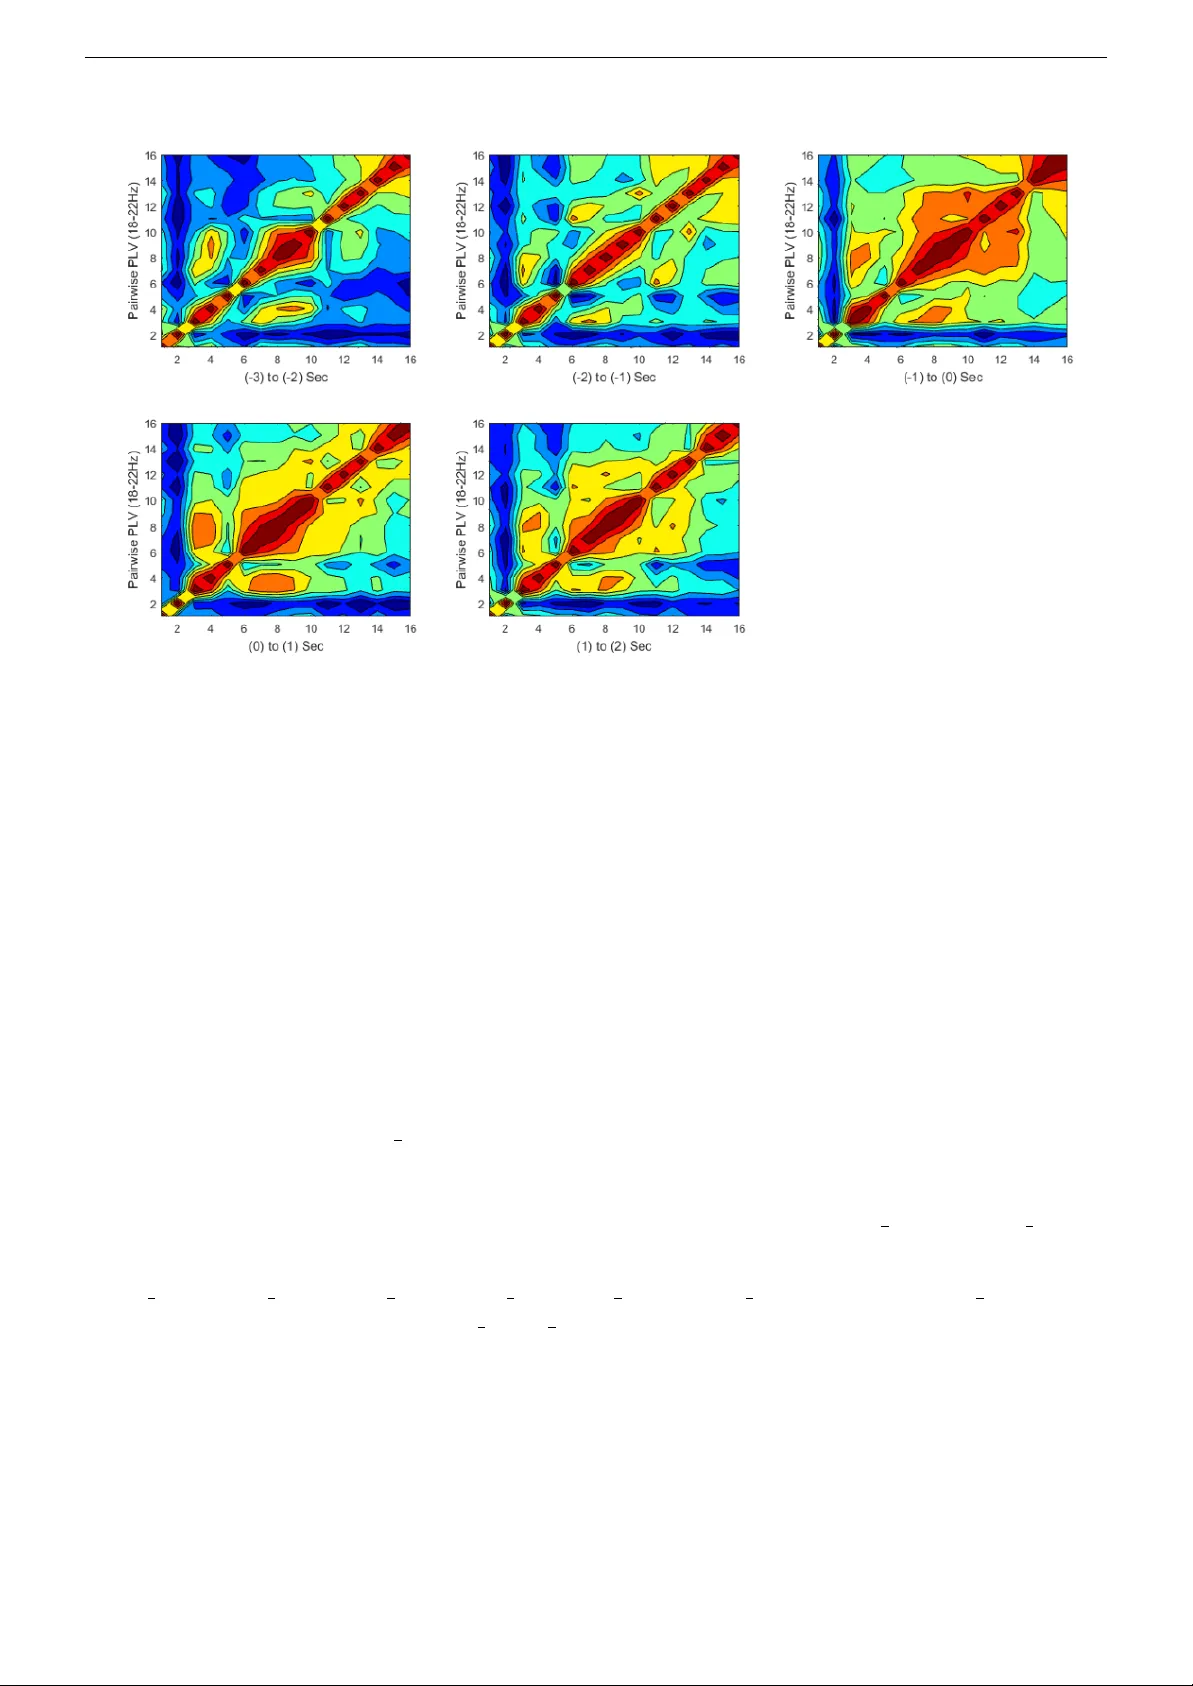
Leave a Comment