Comparing Edge Detection Methods based on Stochastic Entropies and Distances for PolSAR Imagery
Polarimetric synthetic aperture radar (PolSAR) has achieved a prominent position as a remote imaging method. However, PolSAR images are contaminated by speckle noise due to the coherent illumination employed during the data acquisition. This noise pr…
Authors: Abra~ao D. C. Nascimento, Michelle M. Horta, Alej
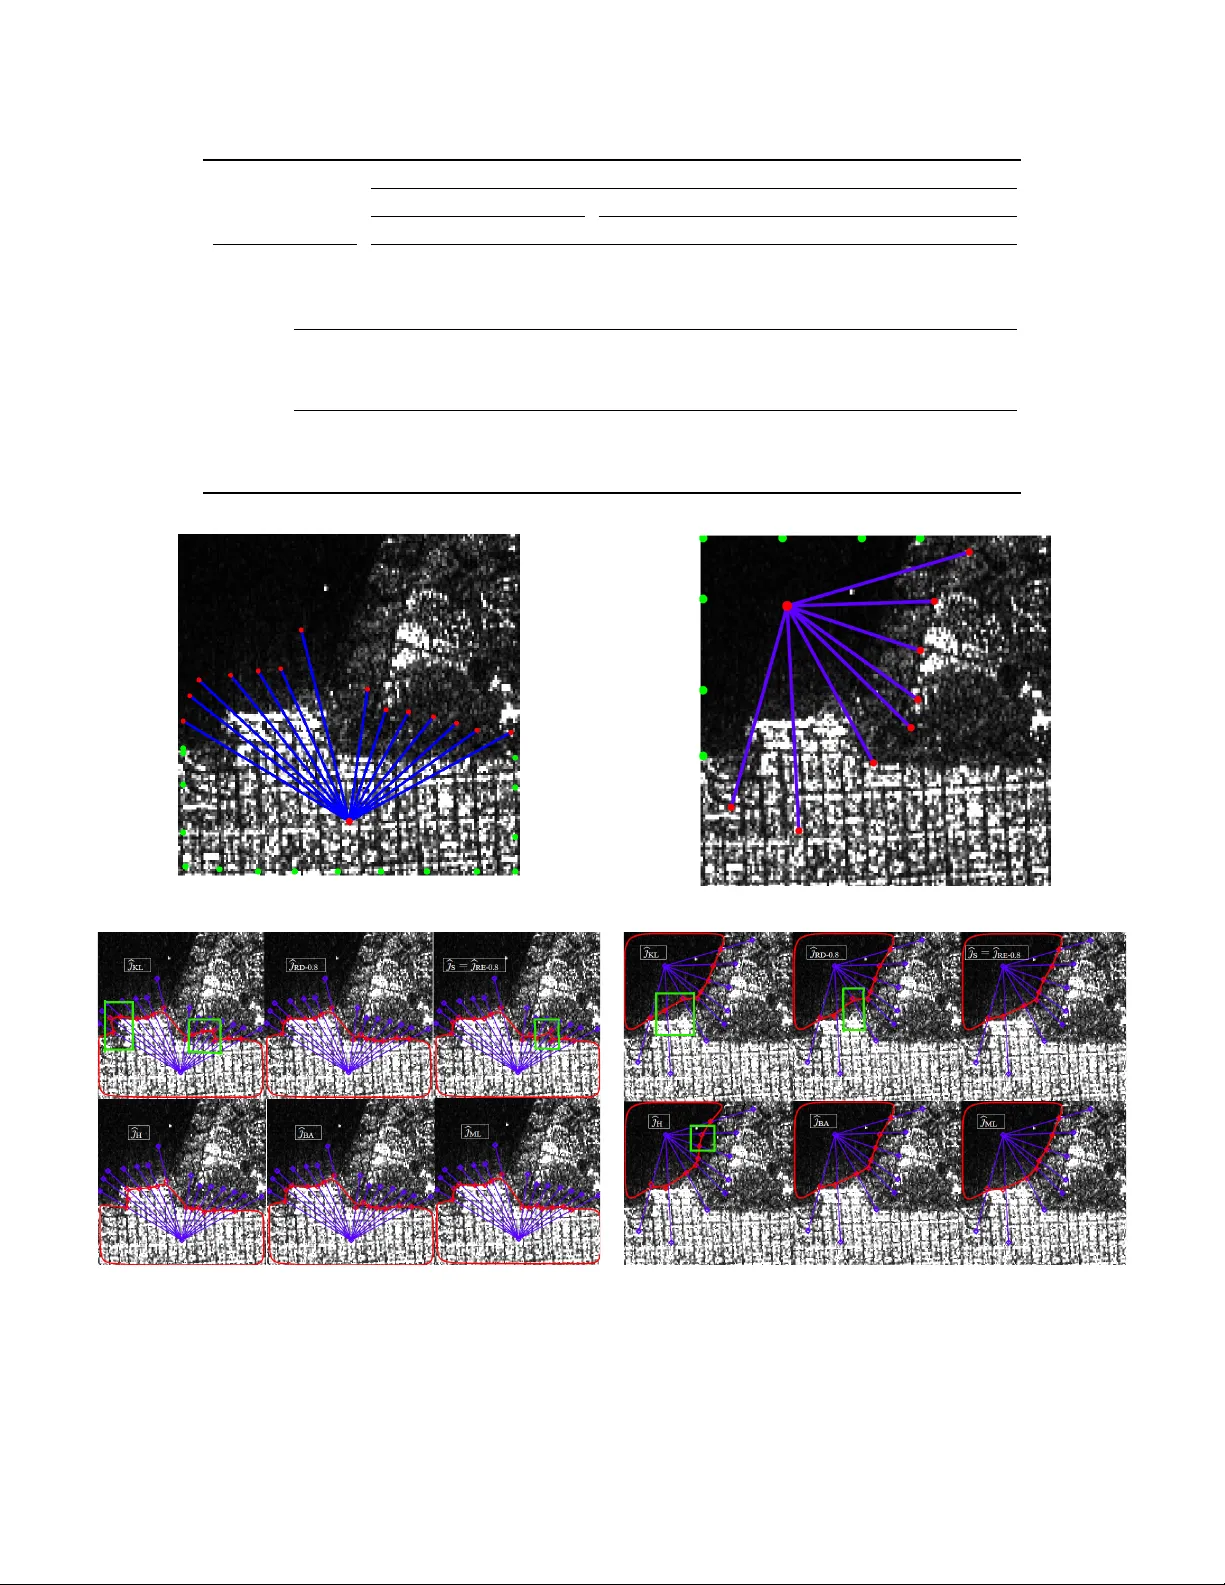
1 Comparing Edge Detection Methods based on Stochastic Entropies and Distances for PolSAR Imagery Abra ˜ ao D. C. Nascimento, Michelle M. Horta, Alejandro C. Frery , Member , and Renato J. Cintra, Senior Member Abstract —Polarimetric synthetic aperture radar (PolSAR) has achieved a prominent position as a remote imaging method. Howev er , PolSAR images are contaminated by speckle noise due to the coherent illumination employed during the data acquisition. This noise pro vides a granular aspect to the image, making its processing and analysis (such as in edge detection) hard tasks. This paper discusses seven methods f or edge detection in multilook PolSAR images. In all methods, the basic idea consists in detecting transition points in the finest possible strip of data which spans two regions. The edge is contoured using the transitions points and a B-spline curve. Four stochastic distances, two differences of entropies, and the maximum like- lihood criterion were used under the scaled complex W ishart distribution; the first six stem from the h - φ class of measures. The performance of the discussed detection methods was quantified and analyzed by the computational time and probability of correct edge detection, with respect to the number of looks, the backscatter matrix as a whole, the SP AN, the covariance an the spatial resolution. The detection pr ocedures were applied to three r eal P olSAR images. Results pr ovide evidence that the methods based on the Bhattacharyya distance and the difference of Shannon entropies outperf orm the other techniques. Index T erms —Image analysis, information theory , polarimetric SAR, edge detection. I . I N T R O D U C T I O N P OLARIMETRIC synthetic aperture radar (PolSAR) has achiev ed a prominent position as a remote imaging method [1]. SAR images are contaminated by speckle, a typ- ical noise present in data acquired with coherent illumination subject to multipath interference. Speckle noise introduces a granular aspect to the image, and its multiplicativ e nature makes SAR image analysis a challenging task [2]. Most of the classical image processing methods assume additi ve noise, which is ineffecti ve for processing SAR imagery [3]. Thus, PolSAR image analysis require specifically tailored signal processing techniques. This work was supported by CNPq, Fapeal, F APESP , and F A CEPE, Brazil. A. D. C. Nascimento is with the Departamento de Estat ´ ıstica, Uni versidade Federal de Pernambuco, Cidade Uni versit ´ aria, 50740-540, Recife, PE, Brazil, e-mail: abraao@de.ufpe.br M. M. Horta is with the Departamento de Computac ¸ ˜ ao, Uni versidade Federal de S ˜ ao Carlos, Rod. W ashington Lu ´ ıs km 235, 13565-905, S ˜ ao Carlos, SP , Brazil, e-mail: michellemh@gmail.com A. C. Frery is with the Instituto de Computac ¸ ˜ ao, Universidade Federal de Alagoas, BR 104 Norte km 97, 57072-970, Macei ´ o, AL, Brazil, e-mail: acfrery@gmail.com R. J. Cintra is with the Signal Processing Group, Departamento de Es- tat ´ ıstica, Universidade Federal de Pernambuco, Cidade Universit ´ aria, 50740- 540, Recife, PE, Brazil, e-mail: rjdsc@ieee.org Among image processing techniques, edge detection oc- cupies a central position. In simple terms, its purpose is to identify boundaries between regions of different structural characteristics [4]. In PolSAR systems, such features are usu- ally represented by different scattering characteristics, which are effected by surface reflectance and speckle noise. Sev eral edge detection approaches have been proposed for SAR imagery , among them gradient-based methods [5]–[8]. Such approach consists in using a sliding windo w to define a measure map that highlights the edges, resembling the edge strength map technique [5]. Then a thresholding step is applied to perform the sought edge detection. In a different approach, Oliv er et al. [6] proposed a maximum likelihood method aiming at two goals: (i) detecting the presence of an edge within a window and (ii) determining accurately the position of the edge. Another line of research is the specific study of edge detection based on physical properties from urban areas. As an example, Baselice and Ferraioli [9] utilized Markov random fields to model jointly the amplitude and interferometric phase of two complex SAR images. Statistical procedures, including active contour models, ha ve also been applied to edge detection on SAR images [3], [4], [10]–[13]. Giron et al. [13] compare sev en edge detectors following the general idea proposed by Gambini et al. [3]: finding transition points in strips of data. This latter method was successfully emplo yed in [12] and [13] for a comparative study using other strate gies based on the same acti ve contour approach. In [4], Frery et al. extended it to multilook PolSAR data using the polarimetric G H distribution as model. In the present work, we aim at extending the proposal of Gambini et al. [3]. In its original idea, this method consists in forming strips of data around regions that span from the centroid of the candidate region to points located outside the region under consideration. Resulting strips are then submitted to a screening phase, where each one is scanned looking for the point which defines two distinct regions under it based on maximization criterion, such as likelihood function. The point that satisfies a decision rule is called tr ansition point . A pre-processing step may be necessary in order to define the initial regions. A post-processing step defines the edges of the regions by combining the transition points with B-spline curves. For any type of approach, the edge detection problems can be related to three main aspects: (i) the procedure for detection, (ii) the determination of the most accurate edge position, 2 and (iii) the specification of the window size (the window represents a square window or a strip of data). The latter may influence all others aspects in such manner that smaller windows may not con vey enough information to identify the presence of edges, while bigger windo ws may contain more than two edges. Then, the ideal windo w size is the one that provides only a single edge within the windo w [6]. Following the approach discussed in [3], we assume that there is one edge within the window pro vided by the initial selection. Our proposal improves or extends those procedures in three senses: (i) the finest possible strips of data are used, namely the ones of one pix el width, and (ii) stochastic distances and difference of entropies are employed as objective functions to be maximized; not only the likelihood function as in [3]. (iii) the influence of the spatial image resolution is performed. The Kullback-Leibler and Bhattacharyya distances have been used by Morio et al. [14] as a scalar contrast measure between different channels of polarimetric and interferometric synthetic aperture radar (PolInSAR) images. These distances were calculated assuming that PolInSAR images follow the complex multidimensional Gaussian circular distribution. The distances were then compared by their discrimination ability . In the present paper , this work extended in two ways: (i) the complex Wishart model is utilized instead of the Gaussian circular distrib ution, and (ii) four distances, particular cases of the h - φ class of di v ergences, were considered as well as two dif ference of entropies. Other information theory measures hav e been employed for change detection. Erten et al. [15] proposed a method based on mutual information for PolInSAR images assuming the scaled complex W ishart law . As a result, they could verify that the new detector is more ef ficient than the one based on the maximum likelihood ratio statistic [16]. Therefore, the contribution of this paper is two fold. Firstly , the paper presents a detailed discussion about information the- ory measures (using h - φ di ver gences and entropies) as criteria for the edge detection problem [3]. Secondly , we compare their performance by edge accuracy and computational time, using contrast and spatial resolution as factors. Three real multilook PolSAR images are employed to show the application of the proposal. The best results were obtained using R ´ enyi and Bhattacharya distances and difference of entropies. This paper is structured as follo ws. Section II presents the se ven assessed measures. An analysis of the proposed techniques using real and simulated data is presented in Section III. T o that end, Monte Carlo experiments are per- formed in Section III-A to assess required computational time and probability of correct detection. Section III-B presents applications to real PolSAR images. Finally , the results are summarized in Section IV. I I . E D G E D E T E C T I O N A P P RO AC H E S U N D E R S C A L E D C O M P L E X W I S H A RT D I S T R I B U T I O N In this section, we present sev en approaches for detecting edges in PolSAR images based on the methodology employed by [3], [4], [12], [13]: finding a transition point in a strip of data which is an estimator of the edge position. In all cases, the estimator is the maximum of a gi ven function. The first function is a likelihood, which is a multiv ariate extension of the approach shown in [12]. Remaining functions are h - φ div er gences and (difference of) entropies [17]–[19]. The edge detection methodologies considered in this paper operate in multiple stages: (i) identifying the initial centroid of the area of interest in a automatic, semiautomatic, or manual manner; (ii) casting rays from the centroid to the outside of the area; (iii) collecting data around the rays; (iv) detecting points in the strips of data which provide evidence of a change of properties, a transition; (v) defining the contour using a imputation method among the transition points, such as B- Splines [3]. W e bring contributions to stages (iii) and (i v). Initially , let us admit a region R with centroid C . Rays are traced from C to control points P i , i = 1 , 2 , . . . , S , located outside R ; the S resulting rays can be represented by segments in the form s ( i ) = C P i and the angle between consecutiv e rays is i = ∠ ( s ( i ) , s ( i +1) ) . Rays are con verted into pixels using Bresenham’ s midpoint line algorithm [20]. This representation provides the thinnest possible digital representation for a ray . This contrast with the 20-pixel wide strips employed in [3], [4], [12], [13]. This setup is illustrated in Fig. 1. Fig. 1. Edge detection on the polarimetric strip s ( i − 1) from the centroid C of a region to the control point P i − 1 . Data are assumed to follow a scaled complex Wishart distribution [21]. The scaled complex W ishart distribution has density giv en by f Z ( Z 0 ; Σ , L ) = L mL | Z 0 | L − m | Σ | L Γ m ( L ) exp − L tr Σ − 1 Z 0 , (1) where Z 0 is possible outcomes of Z , Σ represents the cov ari- ance matrix, L is the number of looks, m is the number of 3 polarization channels, Γ m ( L ) = π m ( m − 1) / 2 Q L − 1 i =0 Γ( L − i ) is the multiv ariate gamma function, and | · | and tr( · ) are the determinant and the trace, respecti vely . W e refer to this distribution as W ( Σ , L ) The strip of data collected around the i th ray s ( i ) , i = 1 , 2 , . . . , S , contains N ( i ) pixels. Each pixel k of a gi ven strip i is assumed to be described by the return matrix Z ( i ) k , which is distributed according to the scaled complex W ishart law [4]. Denoting the correct boundary position as j ( i ) , we hav e the following configuration: ( Z ( i ) k ∼ W ( Σ ( i ) A , L ( i ) A ) , for k = 1 , . . . , j ( i ) , Z ( i ) k ∼ W ( Σ ( i ) B , L ( i ) B ) , for k = j ( i ) + 1 , . . . , N ( i ) , . (2) In other words, each strip is formed by tw o patches of samples, and each patch obe ys a complex Wishart law with different parameter v alues. In this work, we assume that the number of looks is estimated beforehand and remains constant for the whole image. Thus, L ( i ) A = L ( i ) B = L in ev ery strip i = 1 , 2 , . . . , S . This supposition is realistic, since the number of looks is obtained from radar upon reception of backscattered pulses [21]. The main idea is to estimate the edge position j ( i ) on the data strip around ray s ( i ) according to a specified decision rule. Gray lines in Fig. 1 illustrate different configurations when the edge position is shifted. The model stated in (2) assumes that at most one transition occurs in any giv en ray . Issues may arise if multiple transitions take place; this is discussed further in Section III-B, Fig. 14. In the following we present three different decision rules. For brevity , we omit the superscript index ( i ) , since we focus our analysis on a single strip. A. Log-likelihood The likelihood function of the sample described by (2) is giv en by L ( j ) = j Y k =1 f Z ( Z 0 k ; Σ A , L ) N Y k = j +1 f Z ( Z 0 k ; Σ B , L ) , where Z 0 k is possible outcomes of the random matrices described in (2). The log-likelihood is more con v enient for maximization purposes: ` ( j ) = log L ( j ) = j X k =1 log f Z ( Z 0 k ; Σ A , L )+ N X k = j +1 log f Z ( Z 0 k ; Σ B , L ) . (3) The maximum likelihood estimator b ML of the index at the location where the transition occurs is given by b ML = arg max j ` ( j ) . (4) Using the model gi ven by (1) in (4), with minor algebraic manipulation one obtains ` ( j ) = N − mL (1 − log L ) − log Γ m ( L ) + L j log | b Σ A ( j ) | + ( N − j ) log | b Σ B ( j ) | , (5) where b Σ A ( j ) and b Σ B ( j ) are the maximum likelihood esti- mators for Σ A and Σ B , respectiv ely , with respect to edge position j . This estimator satisfies the following expression: b Σ I ( j ) = ( j − 1 P j k =1 Z k if I = A, ( N − j ) − 1 P N k = j +1 Z k if I = B B. Information Theory Information theory measures have receiv ed considerable attention as tools for contrast quantification [22], [23]. In this section, we describe novel methodologies for detecting PolSAR boundaries based on such measures. W e adopt the following notation. Let X and Y be two random matrices obeying the scaled complex W ishart distribution with same known numbers of looks. The associated probability densities are f X ( Z 0 ; θ 1 ) and f Y ( Z 0 ; θ 2 ) , respectiv ely , where θ 1 = v ec( Σ A ) and θ 2 = v ec( Σ B ) are their parameter vectors and vec( · ) is the vectorization operator . Both densities are defined ov er the set of Hermitian positiv e definite matrices A . 1) Stochastic distances: (i) Kullback-Leibler: d KL ( X , Y ) = 1 2 Z A [ f X ( Z 0 ; θ 1 ) − f Y ( Z 0 ; θ 2 )] × log f X ( Z 0 ; θ 1 ) f Y ( Z 0 ; θ 2 ) d Z 0 . (ii) R ´ enyi of order 0 < β < 1 : d RD- β ( X , Y ) = 1 β − 1 × log h R A f X ( Z 0 ; θ 1 ) β f Y ( Z 0 ; θ 2 ) 1 − β d Z 0 2 + R A f X ( Z 0 ; θ 1 ) 1 − β f Y ( Z 0 ; θ 2 ) β d Z 0 2 i . (iii) Bhattacharyya: d BA ( X , Y ) = − log Z A q f X ( Z 0 ; θ 1 ) f Y ( Z 0 ; θ 2 ) d Z 0 . (iv) Hellinger: d H ( X , Y ) = 1 − Z A q f X ( Z 0 ; θ 1 ) f Y ( Z 0 ; θ 2 ) d Z 0 . In the above expressions, the differential element is gi ven by d Z 0 = m Y i =1 d Z 0 ii m Y i, j = 1 | {z } i , i = 1 , 2 , θ ik is the k th element of vector θ i , k = 1 , 2 , . . . , p , σ 2 M ( θ i ) = δ ∗ i K ( θ i ) − 1 δ i , the superscript > is the transposition operator , ∗ represents the conjugate transposition, K ( θ i ) = E {− ∂ 2 log f Z ( Z ; θ i ) /∂ θ 2 i } is the Fisher information matrix, δ i = [ δ i 1 δ i 2 · · · δ ip ] > such that δ ik = ∂ H M ( θ i ) /∂ θ ik , p is the size of vector θ i , and v = " j σ 2 M ( c θ 1 ( j )) + ( N − j ) σ 2 M ( c θ 2 ( N − j )) # − 1 × " j H M ( c θ 1 ( j )) σ 2 M ( c θ 1 ( j )) + ( N − j ) H M ( c θ 2 ( N − j )) σ 2 M ( c θ 2 ( N − j )) # . Frery et al. [27] showed that the expression given in (7) follows asymptotically a χ 2 1 distribution, and it can be used to test whether two samples from the scaled W ishart distrib ution possess the same entropy , i.e., H 0 : H M ( θ 1 ) = H M ( θ 2 ) . Additionally , the Shannon and R ´ enyi of order β entropies are giv en by , respectiv ely: H S ( X ) ≡ H S ( θ i ) = − Z A f X ( Z 0 ; θ i ) log f X ( Z 0 ; θ i )d Z 0 = E {− log f X ( Z ; θ i ) } and H R- β ( X ) ≡ H R- β ( θ i ) =(1 − β ) − 1 log Z A f β X ( Z 0 ; θ i )d Z 0 =(1 − β ) − 1 log E f β − 1 X ( Z ; θ i ) , for i = 1 , 2 . Applying these expressions to the density giv en in (1) the following entropies and v ariances are obtained: • Shannon: H S ( Σ , L ) = m ( m − 1) 2 log π − m 2 log L + m log | Σ | + mL + ( m − L ) ψ (0) m ( L ) + m − 1 X k =0 log Γ( L − k ) and σ 2 S = ( m − L ) ψ (1) m ( L ) + m − m 2 L 2 ψ (1) m ( L ) − m L + m 2 L v ec Σ − 1 ∗ Σ ⊗ Σ v ec Σ − 1 , 5 where ⊗ is the Kronecker product, “ v ec ” is the operator which vectorizes its ar gument, and ψ ( v ) m is the v th-order multiv ariate polygamma function given by [25] ψ ( v ) m ( x ) = m − 1 X i =0 ψ ( v ) ( x − i ) , and the ordinary polygamma function is [25] ψ ( v ) ( x ) = ∂ v +1 log Γ( x ) ∂ x v +1 , for v ≥ 0 . • R ´ enyi of order 0 < β < 1 : Denoting q = L + (1 − β )( m − L ) , the R ´ enyi entropy is e xpressed by H R- β ( Σ I , L ) = m ( m − 1) 2 log π − m 2 log L + m log | Σ I | + P m − 1 i =0 log Γ( q − i ) − β log Γ( L − i ) 1 − β − mq log β 1 − β and σ 2 R- β = n β 1 − β ψ (0) m ( q ) − ψ (0) m ( L ) − mβ log ( β ) 1 − β − m 2 L o 2 ψ (1) m ( L ) − m L + m 2 L v ec Σ − 1 ∗ Σ I ⊗ Σ v ec Σ − 1 . These and other results are further discussed in [27]. Therefore, two additional detectors can be defined by the points that maximize the test statistics based on entropies between the two distributions: b M = arg max j S M ( c θ 1 ( j ) , c θ 2 ( N − j )) | {z } ≡ S M ( j ) = arg max j S M ( j ) , where M = { S , RE- β } . The expressions giv en in (6) and (7) hav e known asymptotic distributions so, besides being discriminatory measures, they also hav e significance le vels. This can be useful when the strip of data conv eys a single class and, therefore, no detection should be made. Nev ertheless, in the subsequent section these properties are not considered, due to the f act that the procedure is bounded to use small samples. I I I . A P P L I C AT I O N S W e now apply the methodologies presented in the previous section to simulated and real data. Initially , in Section III-A, complex W ishart distributed scenarios were generated in order to quantify and to assess the accuracy and computational load of the detailed edge detection schemes. For such estimates of the detection error as well as the execution time for each method were compared. Finally , three applications to real data are performed in Section III-B. These applications illustrate the difficulties of determining an ideal windo w size. A. Pr ecision and execution time In order to measure and compare the accuracy of the discussed sev en edge detection techniques, we follow the same methodology proposed by Frery et al. [4]. W e estimate the probability of detecting the edge with an error less than k pixels, for k = 1 , 2 , . . . , 10 . This probability w as estimated using strips of data of 400 pixels di vided in halves, filled with samples from the W ishart distrib ution with two different cov ariance matrices: Σ A = 962892 19171 − 3579 i − 154638 + 191388 i 56707 − 5798 + 16812 i 472251 (8) Σ B = 360932 11050 + 3759 i 63896 + 1581 i 98960 6593 + 6868 i 208843 , (9) which were observed by Frery et al. [4] in urban and forest imagery , respecti vely . In all cases four looks ( L = 4 ) were considered. Fig. 2 shows a simulated PolSAR image with this configuration according to the Pauli decomposition [29]. Fig. 2. False color of the Pauli decomposition of a simulated image from the scaled W ishart distribution with four looks and two halves defined by Σ A and Σ B . Figure 3 shows the functions to be maximized as func- tions of the position for a typical simulation: the likelihood (Fig. 3(a)), distances (Fig. 3(b)), and entropies (Fig. 3(c)). The edge is at 200, and this position identified with a vertical solid line; the symmetric interval of twenty pix els around it is shown in vertical dash-dot lines. All of these distances exhibit a maximum which is close to the true edge position. W e generated 1000 independent scene simulations to obtain the estimated boundaries positions ( b ( r ) ∈ { b ML , b D , b M } , 1 ≤ r ≤ 1000 ). The distance between these points and the true boundary (the absolute empirical bias) was ev aluated for each replication: E ( r ) = | b ( r ) − 200 | , and the probability of observing an error smaller than a certain number of pixels is estimated by relativ e frequencies as f ( k ) = T ( k ) / 1000 , where T ( k ) the number of replications for which the error is smaller than k pixels. Fig. 4 presents, in semilogarithmic scale, the estimated probability of finding the edge with an error equal or smaller than k pixels, k = 1 , 2 , . . . , 10 . Results show evidence that the methods based on entropies hav e the best results for k ≤ 3 . On the other hand, admitting an error k ≥ 4 , the method in v olving stochastic distances have the higher estimated detec- tion probability . This fact suggests that a combination of these 6 (a) Lik elihood detector (b) Distance detectors (c) Entrop y detectors Fig. 3. Illustration of the proposed edge detection measures on images with halves which follow W ( Σ A , 4) and W ( Σ B , 4) distributions. The solid vertical line is at the edge and the dashed lines are at 10 pixels from it. methodologies could lead to ev en more precise edge detection. Finally , the method based on the likelihood is outperformed by those based on stochastic distances; ho wev er , the former method provides better estimates when compared to S S and S R- β . Fig. 4. Performance of detectors on phantom images with two halves distributed according to scaled complex Wishart laws. 1) Influence of the backscatter matrix and time e xecution: Now we de vise a simulation study where data is more similarly distributed; therefore of fering a more difficult scenario. Also we aim at assessing the ex ecution time of each method. Strips of data were defined with halves which follow distributions W ((1 + k ) Σ B , 4) and W ( Σ B , (1 + v )4) , respecti vely . This situation is referenced by “case- ( k , v ) ”. Fig. 5 presents images sampled in cases (0 , 0) , (1 / 2 , 0) , (1 , 0) , (3 , 0) , and (4 , 0) , i.e., with the same number of looks and varying covariance matrices. Fig. 5. Images generated from W ( Σ B · (1 + k ); 4) , for k = 0 , 1 / 2 , 1 , 3 , 4 , mapping [HH + VV] – [HV] – [HH − VV] onto the RGB channels. The precision and ex ecution time of the procedure were estimated using one thousand replications. The latter was measured in seconds of CPU cycles, while for the former we adopted a “hit-and-miss” criterion: a run is considered successful if it finds the true boundary , otherwise it is assumed wrong. The mean number of successful runs are reported in Fig. 6. Fig. 6 and T able I present the av erage estimates of precision for all methods under se veral situations; the first column of T able I shows the label for each case which is used in Figs. 6 and 7. The best estimators are highlighted in boldface. Situations 1 to 4 , which correspond to cases where the cov ariance matrix does not v ary or changes by a small amount, the hardest ones to perform edge detection. Thus they often lead to low precision regardless the technique. It is noticeable that entropy methods consistently outperform other techniques in these particularly challenging situations. The performance of all procedures is comparable at remaining situations. W e could identify that the maximum likelihood and entropy-based estimators excelled, in three and in two situations, respecti vely , but for a small dif ference of the value of the true boundary . T ABLE I E S TI M A T E S F O R B O U ND ARY P O I NT S ( E S T IM ATE S C L O S ES T T O T H E T RU E E D GE A R E H I GH L I G HT E D ) Label Case b ML b KL b BA b H b RD- 0 . 8 b S = b RE- 0 . 8 1 (0 , 3) 17 . 662 16 . 870 17 . 288 18 . 871 17 . 007 22 . 582 2 (0 , 7) 18 . 531 17 . 609 18 . 074 19 . 994 17 . 816 26 . 198 3 (0 , 1) 23 . 834 23 . 306 23 . 843 25 . 604 23 . 538 36 . 287 4 (0 . 1 , 1) 27 . 746 28 . 688 29 . 176 30 . 806 28 . 991 44 . 626 5 (0 . 1 , 0) 49 . 726 54 . 055 53 . 877 52 . 653 53 . 961 55 . 358 6 (1 , 3) 50 . 738 50 . 826 50 . 841 50 . 842 50 . 834 50 . 844 7 (2 , 7) 50 . 941 50 . 966 50 . 971 50 . 974 50 . 968 50 . 970 8 (1 , 0) 50 . 952 51 . 129 51 . 119 51 . 102 51 . 120 51 . 110 9 (2 , 0) 50 . 979 51 . 052 51 . 048 51 . 042 51 . 050 51 . 052 7 Fig. 6. Precison of the detection on polarimetric images with halves which follow W ((1 + k ) Σ B , 4) and W ( Σ B , (1 + v )4) distributions. Fig. 7 presents the mean ex ecution time of each method in seconds. Fig. 7(a) presents obtained detection times, where it is noticeable that the maximum likelihood method associated to b ML is the slowest procedure. Fig. 7(b) shows only the times required by procedures based on stochastic distances. W e notice that the method based on the Kullback-Leibler div er gence, which furnishes b KL , was the fastest one. The results can be summarized in the following inequalities of the required computational times t for each technique: t b ML ≥ t b RD ≥ t b RE ≥ t b S ≥ t b H ≥ t b BA ≥ t b KL . The influence of the case on the computing time is very small. All implementations are in the R version 2.13.2 programming language, running on a PC with an Intel© Core® i7-2630QM 2.00GHz with 4 GB RAM. (a) All times (b) Information theoretic tool times Fig. 7. Detection times of the proposed methods in terms of the situations presented in T able I. 2) Influence of the backscatter matrix SP AN and image r esolution: In the following we assess the relativ e information provided by the polarimetric data with respect to single- channel data for the problem of finding edges. Assuming the scaled complex Wishart with parameters Σ and L for the polarimetric data, each intensity channel is described by the gamma distribution with density gi ven by f Z i ( Z 0 i ; L/σ 2 i , L ) = L L Z 0 i L − 1 σ 2 L i Γ( L ) exp − LZ 0 i /σ 2 i , for i ∈ { HH,HV ,VV } , where σ 2 i is the ( i, i ) th entry of Σ and Z 0 i is the ( i, i ) th entry of the random matrix Z [30]. This density can be used in the log-likelihood of strips (cf. (3)) to deriv e the estimator of the edge position (cf. (4)). W e considered two random matrices X ∼ W ( Σ B , 4) and Y ∼ W ( Σ B 0 , 4) : • Case A: diag( Σ B 0 ) = (1 + δ ) diag ( Σ B ) and adiag( Σ B 0 ) = adiag( Σ B ) , where diag( A ) = [ A 11 A 22 . . . A mm ] > , for a square matrix A with order m , and adiag ( A ) = [ w > w ∗ ] > , w = [ A 12 . . . A 1 m A 23 . . . A 2 m . . . A ( m − 1) m ] > . This case represents the influence of the SP AN [31], i.e., the trace of backscatter matrix when δ ≥ 0 . • Case B: diag( Σ B 0 ) = diag ( Σ B ) and adiag( Σ B 0 ) = adiag( Σ B ) + (1 + δ ) {< [adiag( Σ B )] + = [adiag( Σ B )] } . This aims at quantifying the influence of the co variance between polarization channels v arying the values of δ ≥ − 1 . A Monte Carlo simulation was performed to quantify the performance of the edge detectors under these conditions. For Case A, 1000 images with 100 pixels in each half were generated with δ ∈ { 0 . 2 , 0 . 4 , 1 . 0 } . Edge detection was performed, and the probability of detecting within an error equal or smaller than k ∈ { 1 , 2 , . . . , 10 } pixels was estimated. Fig. 8 presents the results. As expected, all polarimetric methods outperformed the methods based on single-channel data. Additionally , these results provide e vidence that the performance of the methods tends to be similar when the SP AN is significantly different, i.e., when the halves are quite dif ferent. Moreo ver , boundary detection based on entrop y measures outperformed all other methods in Case A. Fig. 9 shows the performance of the discussed methods in Case B, for δ ∈ { 0 . 2 , 0 . 3 , 1 . 0 } . As in Case A, polarimetric data led to better results than single-channel images. In this case, detectors based on stochastic distances and maximum likelihood outperformed those based on entropies. Fig. 9(a) legend presents the detectors ordered from best to worst from top to bottom and from left to right. The best result was obtained by b ML , but small dif ferences were observed among methods in v olving distances. W e now analyze the effect of spatial resolution on the precision of the edge detection procedures. T o that end, we simulated a strip of 200 observations divided in two halves, each with different distributions, namely X ∼ W ( Σ B , 4) and Y ∼ W ( Σ B 0 , 4) , such that diag( Σ B 0 ) = 1 . 2 diag ( Σ B ) , with Σ B defined in (9). This strip is assumed to have the best spatial resolution, and is denoted “ 1 ÷ 1 ”. The position of the edge, which is at the middle of the strip, i.e. at 100, is estimated with all the available techniques. Then the spatial resolution of 8 (a) δ = 0 . 2 (b) δ = 0 . 4 (c) δ = 1 . 0 Fig. 8. Influence of the SP AN on the probability of detecting and edge with an error equal or smaller than a certain number of pixels. (a) δ = 0 . 2 (b) δ = 0 . 4 (c) δ = 1 . 0 Fig. 9. Influence of the cov ariance between polarization channels on the probability of detecting and edge with an error equal or smaller than a certain number of pixels. the strip is degraded by taking the mean of pairs of contiguous observations and downsampling one each two pixels obtaining, thus, a 1 ÷ 2 resolution image. The estimation of the edge position, which is now at 50, is performed. A new pyramid is formed, denoted “ 1 ÷ 4 ”, and the estimation of the edge (now at 25 ) is again performed. The equiv alent number of looks L is assumed kno w , and at each resolution tak es the values 4 , 8 and 16 . This procedure was repeated generating 1000 independent initial strips, and the bias ( b B , the expected v alue of the estimator minus the true v alue), the standard deviation ( sd ), the coef ficient of variation ( CV ) and the mean squared error ( MSE ) of each estimator b • ) were estimated. The results are shown in T able II. The detection bias was always very small, being the lar gest values in the order of 10 − 2 of a pixel and the smallest ones in the order of 10 − 3 of a pixel. The absolute bias tended to exhibit a small increase when the spatial resolution was reduced, while the standard deviation and the mean squared error were reduced. The width of the Gaussian symmetric con- fidence interv als at the 95% confidence level ranges between, approximately , half a pixel and one pixel, rendering, thus, that all techniques exhibit comparable accuracy . Changing the resolution had little effect on the coef ficient of variation. B. Application to r eal data W e applied the methods to three real images. The first example describes a simple situation: well separated regions with most of the strips including two regions only . The second and third examples present more sophisticated problems due to the size of the strips (lar ger strips may span more than two regions). The first application was performed on a San Francisco Bay image obtained by the AIRSAR sensor in L-band with four nominal looks, which is av ailable in [32]. Fig. 10(a) sho ws a 150 × 150 scene of the image with three well defined regions: ocean (dark area – top and left part of the image), forest (gray area – top and right), and urban area (light area – bottom). Figs. 10 and 11 present the result of detecting the edges which separate urban and ocean regions from other classes, respectiv ely . The following analysis was performed by visual inspection on edges reconstructed from the estimated transition points and B-splines of fourth degree. In Fig. 10(b), estimator b KL presents two mildly biased boundaries (highlighted with green squares), whereas b S and b RE- 0 . 8 present only one. Remaining methods present similar behavior . Fig. 11(b) also exhibits three situations where the detected edge was slightly biased, namely b KL , b RE- 0 . 8 and b H , each with one noticeable deviation. Again, other discussed methods behav e alike. The Bhattacharyya and likelihood techniques did not miss any detection in these examples. This, and the simulation results on accuracy and computational time, leads us to suggest b B as the fastest and most efficient detector . Fig. 12 sho ws an E-SAR image over the surroundings of Munich, Germany , which was obtained with 3 . 2 (equi v alent number of) looks. The nonconv ex region to the center of Fig. 12(a) is of interest, for which an arbitrarily centroid and thirteen rays were defined. Fig. 12(b) summarizes the results. It shows the edges, and the label of the ray for which the transition point was identified far from the visual true point. Both maximum likelihood and Kullback-Leibler methods failed at detecting only one situation, highlighted with a green square. The other results are similar . 9 T ABLE II E FF EC T O F T H E S PA T IA L R E S O LU T I O N O N T H E E D G E D E TE C T I ON Boundary detection methods Single channel data Full PolSAR data Resolution Measures b HH-ML b HV -ML b VV -ML b ML b KL b BA b H b RD- 0 . 8 b S = b RE- 0 . 8 1 ÷ 1 100 b B 0 . 502 − 0 . 547 2 . 866 0 . 273 − 0 . 793 − 0 . 785 − 0 . 545 − 0 . 792 − 0 . 171 sd( b • ) 52 . 850 48 . 948 50 . 683 18 . 388 24 . 338 22 . 733 18 . 826 24 . 338 15 . 028 CV( b • ) 0 . 263 0 . 246 0 . 246 0 . 092 0 . 123 0 . 115 0 . 095 0 . 123 0 . 075 MSE( b • ) 2791 . 361 2394 . 661 2599 . 036 338 . 076 594 . 280 518 . 758 355 . 249 594 . 232 225 . 726 1 ÷ 2 1 . 541 − 0 . 252 3 . 335 0 . 808 − 0 . 151 − 0 . 153 − 0 . 052 − 0 . 152 0 . 420 25 . 435 22 . 977 25 . 061 8 . 984 9 . 880 9 . 875 9 . 406 9 . 875 7 . 373 0 . 250 0 . 230 0 . 243 0 . 089 0 . 099 0 . 099 0 . 094 0 . 099 0 . 073 648 . 653 527 . 482 638 . 523 81 . 288 97 . 549 97 . 433 88 . 386 97 . 434 54 . 486 1 ÷ 4 2 . 144 1 . 190 4 . 504 1 . 876 0 . 784 0 . 932 0 . 990 0 . 890 1 . 362 12 . 037 11 . 235 11 . 790 4 . 451 4 . 933 4 . 713 4 . 671 4 . 737 3 . 603 0 . 236 0 . 222 0 . 226 0 . 087 0 . 098 0 . 093 0 . 092 0 . 094 0 . 071 145 . 882 126 . 445 143 . 948 20 . 670 24 . 468 22 . 404 22 . 039 22 . 617 13 . 435 (a) Urban area vs. sea and forest (b) Detected egdes Fig. 10. Performance of detectors with centroid on urban re gion from AIRSAR image of San Francisco Bay . Errors highlighted in green boxes. There are practical situations in which all methods perform alike. Consider the EMISAR image of the agricultural area of Foulum, Denmark, presented in Fig. 13. This image was obtained in L-band and quad-pol; its HH channel is shown in (a) Sea vs. urban area and forest (b) Detected egdes Fig. 11. Performance of detectors with centroid on ocean region from AIRSAR image of San Francisco Bay . Errors highlighted in green boxes. Fig. 13(a). Notice that the method based on the joint likelihood (Fig. 13(b)) works similarly to b BA and b RD- 0 . 8 (Fig. 13(c)), b RE- 0 . 8 (Fig. 13(d)), and b KL (Fig 13(e)). Ho wev er , the best technique regarding execution times is the one based on the 10 (a) HH channel of the ESAR image with selected rays (b) Detection in actual images Fig. 12. Edge detection in an E-SAR image over the surroundings of Munich, Germany . Error highlighted in the green box. Bhattacharyya distance. In order to analyze further the result obtained by the Hellinger distance, presented in Fig. 13(f), consider the ray zoomed in Fig. 14(b), and notice that it crosses three regions: gray , white and black leading, therefore, to two possible edges. As all the techniques are proposed in terms of the maximization of a discrimination measure, it is expected that the estimated boundary is the position of the highest distinction between two regions. In this case, it takes place in the second edge, i.e., between the white and black areas. This is confirmed by Fig. 14(c), which sho ws the likelihood, but not in Fig. 14(d), which shows the Hellinger distance. All other criteria behav e alike, as sho wn in Fig. 14(e). The Hellinger distance is limited to the [0 , 1] interval. Addi- tionally , let v ( k ) = d H ( θ 1 , θ 2 + k ) , empirical results provide evidence that there is a subset Θ of the parametric space of the scaled complex W ishart distribution for which v ( k ) ≈ 1 for all k ∈ Θ . This fact renders the statistics S H ( θ 1 , θ 2 + k ) inappropriate for quantifying distinctions between distributed W ishart random fields when k ∈ Θ . This behavior opens new research lines based on a redefini- tion of the proposed methods in order to cope with situations in which rays cross three or more distinct regions. I V . C O N C L U S I O N S In this paper , boundary detection procedures using infor- mation theory measures (stochastic distances and entropies) (a) Real Images with selected axes (b) b ML (c) b BA = b RD- 0 . 8 (d) b RE- 0 . 8 = b S (e) b KL (f) b H Fig. 13. Edge detection of an agricultural parcel in an EMISAR image of Foulum. and a lik elihood function were considered. Due to its analytic tractability , these techniques are deri ved under the assumption that the W ishart distrib ution is an acceptable model for full PolSAR data. In order to quantify and compare their perfor- mances, phantoms and real PolSAR images were used. The performance of each procedure was quantified by the probability of correctly detecting the edge position within at most k pixels, as well as by the e xecution time. Problems with dif ferent le vels of complexity were assessed in order to quantify the influence of the number of looks, the backscat- ter matrix as a whole, the SP AN, the covariance, and the spatial resolution. Also, the information provided by the full polarimetric format with respect to each intensity channel was assessed, leading to the conclusion that the complete data set is recommended for edge detection. The results provide evidence that all methods are able to detect edges correctly within four pixels, with the exception of entropy-based techniques which fail in more comple x scenarios with similar cov ariance 11 (a) A ray crossing three different regions (b) Zoom (c) b ML (d) b H (e) b • Fig. 14. Details of of the edge detection in a hard-to-deal-with configuration from the EMISAR image of Foulum. matrices. The discriminatory function based on the Kullback-Leibler distance is the f astest to compute, while the likelihood function is the slowest one among the considered measures. The simulation studies rev ealed that information theory measures are consistently closer to the true boundary than the joint likelihood detector . In particular , Shannon and Kullback- Leibler detectors provided the most accurate detection and the smallest ex ecution time, respectiv ely . Finally , three applications to real data obtained by E- SAR, EMISAR, and AIRSAR sensors were performed. The seemingly poor performance of the edge detection based on the Hellinger distance was identified and explained by its properties. As a conclusion, techniques which employ R ´ enyi and Bhat- tacharyya distances and entropies outperform other methods and are recommended for edge detection in PolSAR imagery . Further research aims at considering models which include heterogeneity [4], [21], [33], robust, improved and nonpara- metric inference [34]–[37], and small samples techniques [38]. A C K N O W L E D G M E N T The authors are grateful to CNPq, Facepe, Fapeal, F APESP , and Capes for their support. R E F E R E N C E S [1] J. S. Lee and E. Pottier , P olarimetric Radar Imaging: F r om Basics to Applications . Boca Raton: CRC, 2009. [2] C. Oli ver and S. Quegan, Understanding Synthetic Apertur e Radar Images , ser . The SciT ech radar and defense series. SciT ech Publishing, 1998. [3] J. Gambini, M. Mejail, J. Jacobo-Berlles, and A. C. Frery , “Feature extraction in speckled imagery using dynamic B-spline deformable contours under the G0 model, ” International Journal of Remote Sensing , vol. 27, no. 22, pp. 5037–5059, 2006. [4] A. C. Frery , J. Jacobo-Berlles, J. Gambini, and M. Mejail, “Polarimetric SAR image segmentation with B-splines and a ne w statistical model, ” Multidimensional Systems and Signal Pr ocessing , vol. 21, pp. 319–342, 2010. [5] R. T ouzi, A. Lopes, and P . Bousquet, “ A statistical and geometrical edge detector for SAR images, ” IEEE T ransactions on Geoscience and Remote Sensing , vol. 26, no. 6, pp. 764–773, 1988. [6] C. J. Oliv er , D. Blacknell, and R. G. White, “Optimum edge detection in SAR, ” IEE Proceedings Radar , Sonar and Navigation , vol. 143, no. 1, pp. 31–40, 1996. [7] R. Fjortoft, A. Lopes, P . Marthon, and E. Cubero-Castan, “ An optimal multiedge detector for SAR image segmentation, ” IEEE T ransactions on Geoscience and Remote Sensing , vol. 36, no. 3, pp. 793–802, 1998. [8] F . Xingyu, Y . Hongjian, and F . Kun, “ A statistical approach to detect edges in SAR images based on square successiv e dif ference of a verages, ” IEEE Geoscience and Remote Sensing Letters , vol. 9, no. 6, pp. 1094– 1098, 2012. [9] F . Baselice and G. Ferraioli, “Statistical edge detection in urban areas exploiting SAR complex data, ” IEEE Geoscience and Remote Sensing Letters , vol. 9, no. 2, pp. 185–189, 2012. [10] M. Horrit, “ A statistical activ e contour model for SAR image segmen- tation, ” Image and V ision Computing , vol. 17, no. 3-4, pp. 213–224, 1999. [11] O. Germain and P . R ´ efr ´ egier , “Edge location in SAR images: Perfor- mance of the likelihood ratio filter and accuracy improvement with an active contour approach, ” IEEE T ransactions on Image Pr ocessing , vol. 10, no. 1, pp. 72–78, 2001. [12] J. Gambini, M. Mejail, J. Jacobo-Berlles, and A. C. Frery , “ Accuracy of edge detection methods with local information in speckled imagery , ” Statistics and Computing , vol. 18, no. 1, pp. 15–26, 2008. [13] E. Giron, A. C. Frery , and F . Cribari-Neto, “Nonparametric edge detec- tion in speckled imagery , ” Mathematics and Computers in Simulation , vol. 82, pp. 2182–2198, 2012. [14] J. Morio, P . Refregier , F . Goudail, P . C. Dubois Fernandez, and X. Dupuis, “ A characterization of Shannon entropy and Bhattacharyya measure of contrast in polarimetric and interferometric sar image, ” Pr oceedings of the IEEE (PIEEE) , vol. 97, no. 6, pp. 1097–1108, June 2009. [15] E. Erten, A. Reigber, L. Ferro-Famil, and O. Hellwich, “ A new coherent similarity measure for temporal multichannel scene characterization, ” IEEE T ransactions on Geoscience and Remote Sensing , vol. 50, no. 7, pp. 2839–2851, july 2012. [16] K. Conradsen, A. A. Nielsen, J. Schou, and H. Skri ver , “ A test statistic in the complex Wishart distribution and its application to change detection in polarimetric SAR data, ” IEEE T ransactions on Geoscience and Remote Sensing , vol. 41, no. 1, pp. 4–19, 2003. [17] A. C. Frery , A. D. C. Nascimento, and R. J. Cintra, “Information theory and image understanding: An application to polarimetric SAR imagery , ” Chilean Journal of Statistics , vol. 2, no. 2, pp. 81–100, 2011. [18] M. Salicr ´ u, M. L. Men ´ endez, L. Pardo, and D. Morales, “On the ap- plications of diver gence type measures in testing statistical hypothesis, ” Journal of Multivariate Analysis , vol. 51, pp. 372–391, 1994. 12 [19] M. Salicr ´ u, M. L. Mend ´ endez, and L. Pardo, “ Asymptotic distribution of ( h, φ )-entropy , ” Communications in Statistics - Theory Methods , vol. 22, no. 7, pp. 2015–2031, 1993. [20] J. J. McConnell, Computer Graphics: Theory into Practice . Jones and Bartlett, 2006. [21] C. C. Freitas, A. C. Frery , and A. H. Correia, “The polarimetric G distribution for SAR data analysis, ” Envir onmetrics , vol. 16, no. 1, pp. 13–31, 2005. [22] A. D. C. Nascimento, R. J. Cintra, and A. C. Frery , “Hypothesis testing in speckled data with stochastic distances, ” IEEE Tr ansactions on Geoscience and Remote Sensing , vol. 48, no. 1, pp. 373–385, 2010. [23] N. Ebrahimi, E. S. Soofi, and R. Soyer, “Information measures in perspectiv e, ” International Statistical Review , 2010. [24] A. C. Frery , A. D. C. Nascimento, and R. J. Cintra, “ Analytic expressions for stochastic distances between relaxed complex Wishart distributions, ” IEEE T ransactions on Geoscience and Remote Sensing , in press. [25] S. N. Anfinsen, A. P . Doulgeris, and T . Eltoft, “Estimation of the equiv- alent number of looks in polarimetric synthetic aperture radar imagery , ” IEEE T ransactions on Geoscience and Remote Sensing , vol. 47, no. 11, pp. 3795–3809, 2009. [26] C. E. Shannon, “ A mathematical theory of communication, ” Bell System T echnical Journal , vol. 27, pp. 379–423, July 1948. [27] A. C. Frery , R. J. Cintra, and A. D. C. Nascimento, “Entropy-based statistical analysis of PolSAR data, ” IEEE Geoscience and Remote Sensing , in press. [28] L. Pardo, D. Morales, M. Salicr ´ u, and M. L. Men ´ endez, “Large sample behavior of entropy measures when parameters are estimated, ” Commu- nications in Statistics - Theory and Methods , vol. 26, no. 2, pp. 483–501, 1997. [29] S. Maitra, M. G. Gartley , and J. P . Kerekes, “Relation between degree of polarization and Pauli color coded image to characterize scattering mechanisms, ” in Society of Photo-Optical Instrumentation Engineers (SPIE) , 2012. [30] M. Hagedorn, P . J. Smith, P . J. Bones, R. P . Millane, and D. Pairman, “ A trivariate chi-squared distribution derived from the complex Wishart distribution, ” Journal of Multivariate Analysis , vol. 97, no. 3, pp. 655– 674, 2006. [31] F . Cao, W . Hong, Y . Wu, and E. Pottier , “ An unsupervised segmentation with an adaptive number of clusters using the SP AN/H/ α /A space and the complex Wishart clustering for fully polarimetric SAR data anal- ysis, ” IEEE T ransactions on Geoscience and Remote Sensing , vol. 45, pp. 3454–3467, 2007. [32] E. Pottier , L. Ferro-Famil, S. Allain, S. Cloude, I. Hajnsek, K. Pap- athanassiou, A. Moreira, M. L. Williams, A. Minchella, M. Lavalle, and Y .-L. Desnos, “Overview of the PolSARpro v4.0 software. The open source toolbox for polarimetric and interferometric polarimetric SAR data processing, ” in IEEE International Geoscience and Remote Sensing Symposium, IGARSS 2009 . Uni versity of Cape T own, Cape T own, South Africa: IEEE, July 2009, pp. 936–939. [33] A. C. Frery , A. H. Correia, and C. C. Freitas, “Classifying multifre- quency fully polarimetric imagery with multiple sources of statistical evidence and contextual information, ” IEEE T ransactions on Geoscience and Remote Sensing , vol. 45, pp. 3098–3109, 2007. [34] H. Allende, A. C. Frery , J. Galbiati, and L. Pizarro, “M-estimators with asymmetric influence functions: the GA0 distribution case, ” Journal of Statistical Computation and Simulation , vol. 76, no. 11, pp. 941–956, 2006. [35] E. Giron, A. C. Frery , and F . Cribari-Neto, “Nonparametric edge detec- tion in speckled imagery , ” Mathematics and Computers in Simulation , vol. 82, pp. 2182–2198, 2012. [36] M. Silva, F . Cribari-Neto, and A. C. Frery , “Improv ed likelihood inference for the roughness parameter of the GA0 distribution, ” En- vir onmetrics , vol. 19, no. 4, pp. 347–368, 2008. [37] K. L. P . V asconcellos, A. C. Frery , and L. B. Silva, “Improving estimation in speckled imagery , ” Computational Statistics , vol. 20, no. 3, pp. 503–519, 2005. [38] A. C. Frery , F . Cribari-Neto, and M. O. Souza, “ Analysis of minute features in speckled imagery with maximum likelihood estimation, ” EURASIP Journal on Applied Signal Processing , vol. 2004, no. 16, pp. 2476–2491, 2004. Abra ˜ ao D. C. Nascimento holds B.Sc. M.Sc. and D.Sc. degrees in Statistics from Universidade Federal de Pernamb uco (UFPE), Brazil, in 2005, 2007, and 2012, respectively . In 2013, he joined the Department of Statistics at Universidade Federal da Para ´ ıba. His research interests are statistical infor- mation theory , inference on random matrices, and asymptotic theory . Michelle M. Horta received the B.S. de gree in com- puter sciences from Universidade Cat ´ olica de Per- nambuco, Recife, Brazil, in 2002, the M.Sc. degree in computer sciences from Universidade Federal de Pernambuco, Recife, Brazil, in 2004, and the Ph.D. degree in applied physics from Universidade de S ˜ ao Paulo, S ˜ ao Carlos, Brazil, in 2009. She is currently working toward the Postdoctoral Research in the Departamento de Computac ¸ ˜ ao, Univ ersidade Federal de S ˜ ao Carlos, S ˜ ao Carlos, Brazil. Her research interests are remote sensing, pattern recognition and statistical models. Alejandro C. Frery graduated in Electronic and Electrical Engineering from the Universidad de Mendoza, Argentina. His M.Sc. de gree was in Ap- plied Mathematics (Statistics) from the Instituto de Matem ´ atica Pura e Aplicada (Rio de Janeiro) and his Ph.D. degree was in Applied Computing from the Instituto Nacional de Pesquisas Espaciais (S ˜ ao Jos ´ e dos Campos, Brazil). He is currently with the Instituto de Computac ¸ ˜ ao, Univ ersidade Federal de Alagoas, Macei ´ o, Brazil. His research interests are statistical computing and stochastic modeling. Renato J. Cintra earned his B.Sc., M.Sc., and D.Sc. degrees in Electrical Engineering from Universidade Federal de Pernambuco, Brazil, in 1999, 2001, and 2005, respectively . In 2005, he joined the Depart- ment of Statistics at UFPE. During 2008-2009, he worked at the University of Calgary , Canada, as a visiting research fello w . He is also a graduate faculty member of the Department of Electrical and Computer Engineering, University of Akron, OH. His long term topics of research include theory and methods for digital signal processing, communica- tions systems, and applied mathematics.
Original Paper
Loading high-quality paper...
Comments & Academic Discussion
Loading comments...
Leave a Comment